
Joined March 2014
- Tweets 871
- Following 48
- Followers 179
- Likes 37
416 Photos and videos


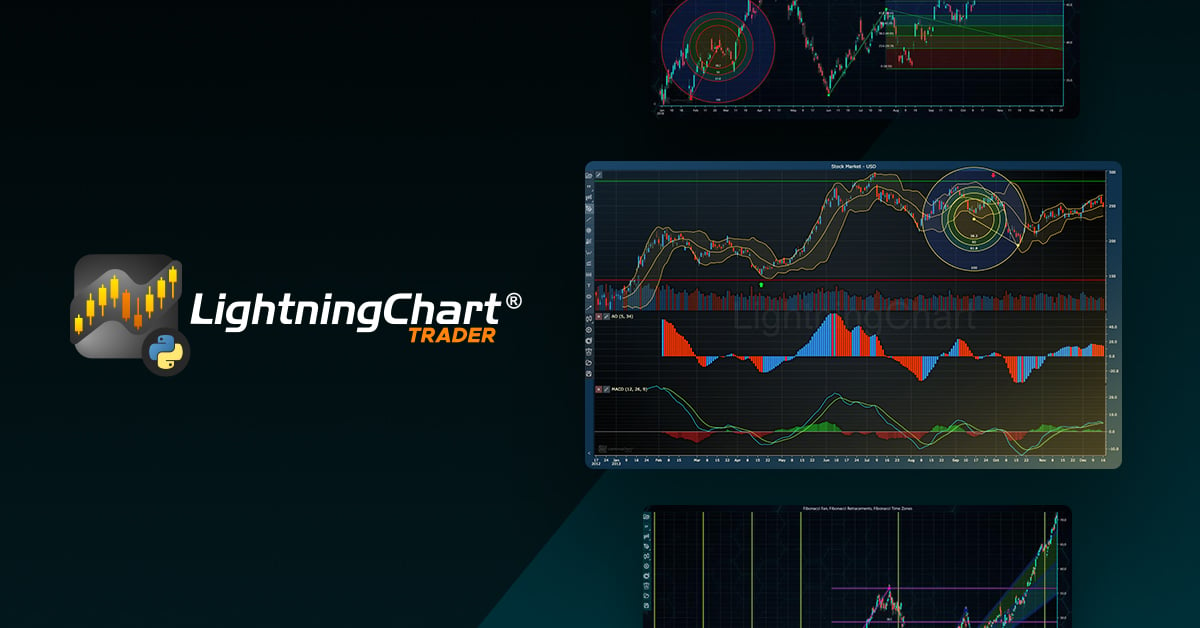


LightningChart® Python Trader v1.2 is out 🚀
New today:
✅ Hull Moving Average, Choppiness Index, Average Daily Range
✅ Freeform Line drawing tool
✅ Candlestick auto-width on zoom
✅ Data padding per edge
✅ DateTime–Index conversion methods.
👉 hubs.la/Q04l9N770
3
We're at #GITEXAIEurope 🇩🇪
June 30 – July 1 | Messe Berlin 📍 Hall 2.2, Stand D135
Come see what happens when your charts render 10 million data points in real time. Live demos at the stand.
#LightningChart #DataViz #Berlin2026
1
9
When evaluating charting libraries in 2026, it's no longer just about aesthetics.
A recent comparison puts LightningChart, ECharts, ApexCharts, Highcharts, Chart.js, and D3.js side-by-side and highlights how rendering architecture impacts scalability.
hubs.la/Q04kTKF60
9
Chart.js, Plotly, ECharts, all CPU-bound. All hit a wall eventually.
LightningChart® JS is WebGL, GPU-accelerated, 100 chart types, 60 FPS live streaming, and hundreds of millions of points.
Free non-commercial. 30-day trial.
→ hubs.la/Q04ks5SG0
#LightningChart
34
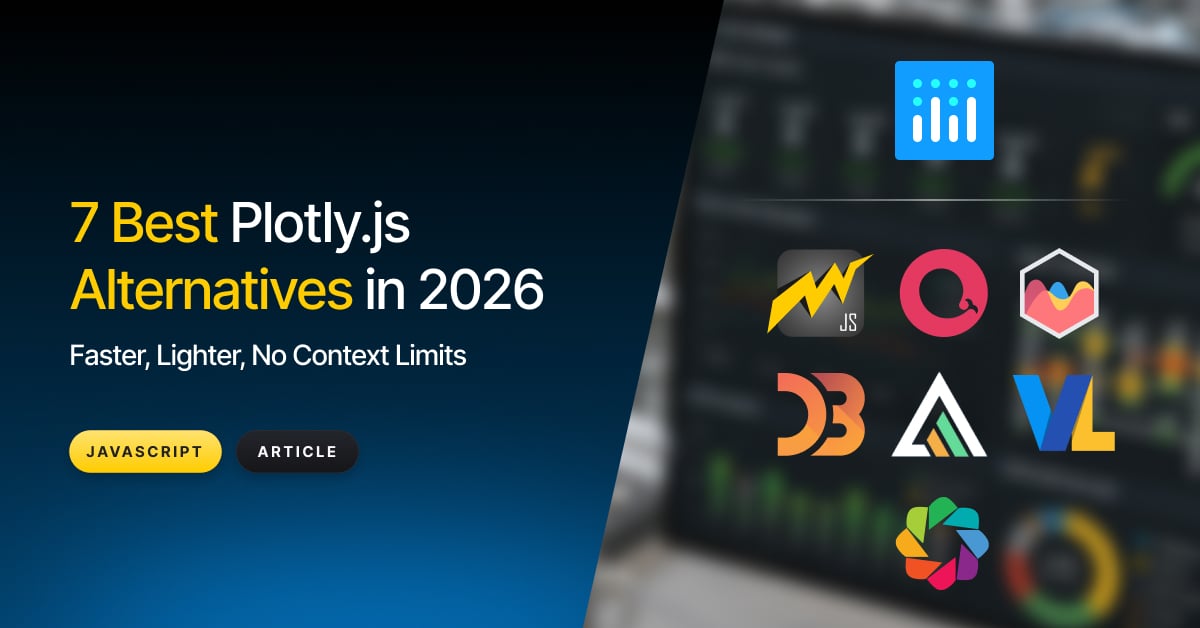
Plotly.js: great for Python/JS teams. Until the data gets serious.
3.6MB bundle. SVG/Canvas. Breaks past ~500k points.
We ranked 7 faster, lighter alternatives for 2026, honestly.
hubs.la/Q04kf-l80
#LightningChart #JavaScript #Plotly #DataVisualization #DataScience
11
10M points in 0.29s. 60 FPS live streaming. No downsampling.
LightningChart®, GPU-accelerated charting for JS, .NET & Python.
Trusted by Fortune 500 companies and developers worldwide!
hubs.la/Q04jVh2s0
#LightningChart #DataVisualization #WebGL
13
What's the best JavaScript charting library?
The answer depends on your use case.
📊 Dashboarding
⚡ Real-time streaming
📈 Financial charts
🔬 Scientific visualization
🎯 Massive datasets
This comparison reviews performance, features, and scalability.
hubs.la/Q04jJyyN0
1
8
OxyPlot: great for simple apps. Not for real-time data at scale.
LightningChart® .NET in 2026:
✅ GPU DirectX rendering
✅ 170 chart types native 3D
✅ Billions of data points
✅ Commercial support
When OxyPlot hits its ceiling, this is what’s next.
hubs.la/Q04jtszj0
13
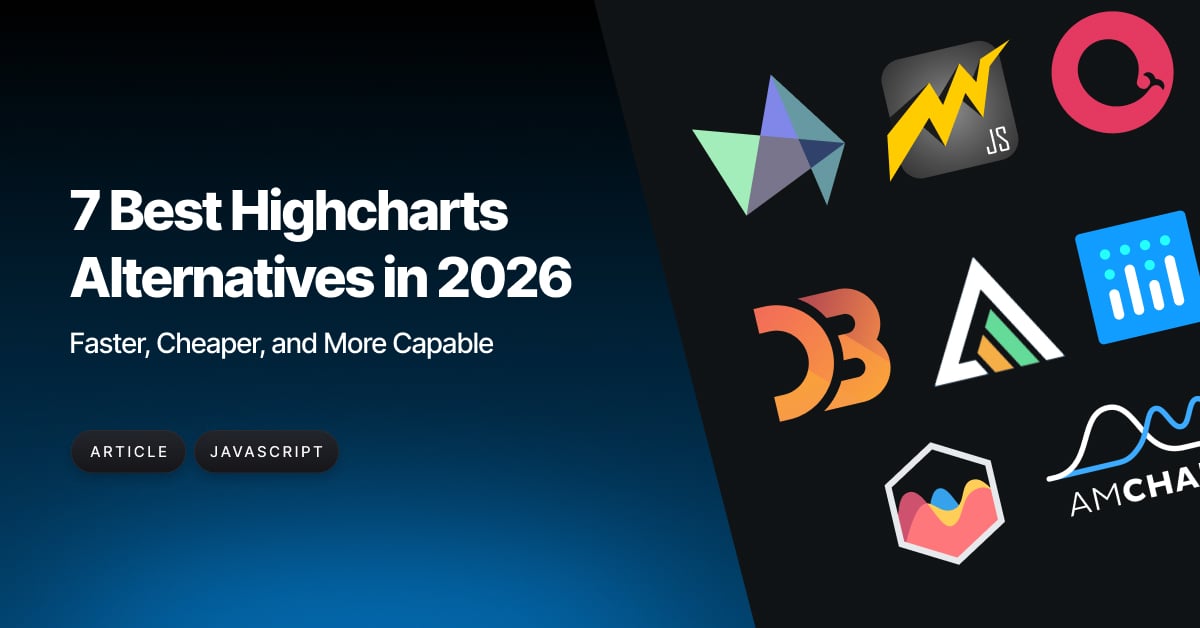
Highcharts alternatives in 2026, we ranked 7 of them.
Faster. Cheaper. More capable.
If your charts are hitting performance walls, this is worth 5 minutes.
hubs.la/Q04jlPcy0
#LightningChart #JavaScript #Highcharts #DataVisualization
13
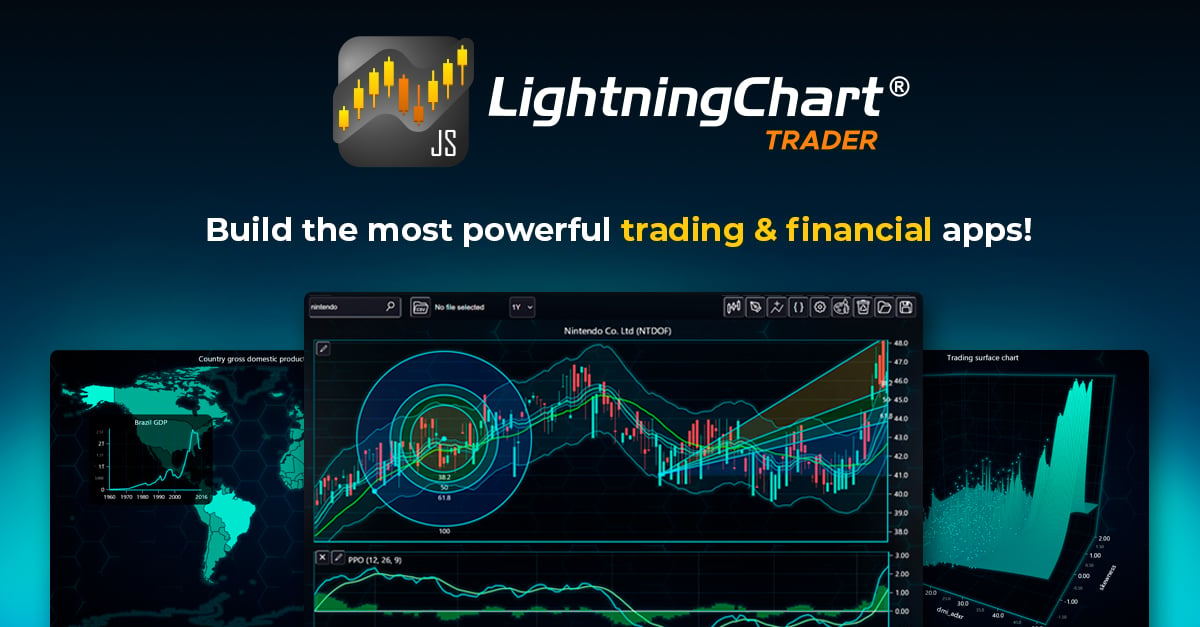
LightningChart® JS Trader 4.1 is out.
What’s new:
✅ Hull Moving Average, Choppiness Index, Average Daily Range
✅ Freeform Line drawing tool
✅ Candlestick auto-width on zoom
✅ Data padding per edge
✅ DateTime–Index conversion methods
Try it free → hubs.la/Q04hZdqq0
22
SES operates 70 satellites and needed 6M data points per plot at 10Hz in a browser.
LightningChart® JS was the only library that delivered.
Pre-built TelCo components. Multi-channel real-time monitoring. JS & .NET.
→ hubs.la/Q04hTyq90
#LightningChart #Telecom
1
22
Python financial charting, finally done right.
LightningChart® Python Trader: GPU-accelerated, 100 indicators, CandleStick, Heikin-Ashi, Renko, Kagi. Real-time ready. Pandas & Alpha Vantage support.
hubs.la/Q04hCF1D0
#LightningChart #Python #AlgoTrading #QuantFinance
44
LightningChart® is NATO-registered. NCAGE code A970G.
Real-time radar, telemetry, LiDAR, 3D flight mapping - JS, .NET & Python. Air-gapped environment ready.
Trusted by Raytheon and the U.S. Air Force.
→ hubs.la/Q04hsHRR0
#LightningChart #Aerospace #Defence #NATO
46
If you've ever watched a .NET chart flicker under heavy data load, you know the problem isn't the data.
LightningChart® .NET runs on DirectX GPU rendering, 170 chart types, billions of data points, native WPF & WinForms. No wrappers. No GDI ceiling.
→ hubs.la/Q04hgR5h0
1
21
CPU-rendered charts hit a wall. GPU-rendered ones don’t.
LightningChart® JS: WebGL, 60 FPS, hundreds of millions of points, no downsampling.
Works with React, Angular, Vue.
hubs.ly/Q04h4YvX0
#LightningChart #JavaScript #WebGL #DataViz
18
LightningChart® was built for science first.
ECG/EEG monitoring. Seismic spectrograms. 3D volumetric imaging. Genomics. Flow cytometry.
8 billion data points in real time. No downsampling. Trusted by Medtronic.
👉 hubs.la/Q04gYnBj0
27
LightningChart® handles thousands of real-time sensor channels - speed, throttle, RPM, tire temp - at the highest FPS rates. No lag. No dropped points.
F1, NASCAR, automotive R&D. Built for where it counts.
👉 hubs.la/Q04gM5sV0
#F1 #motorsports #lightningchart

9
Matplotlib too slow? Plotly hitting limits?
LightningChart® Python benchmarks:
✅ 3,630× faster in real-time
✅ 22,155× faster with static data
✅ GPU-accelerated via WebGL
100 chart types. pip install. 7-day free trial.
👉 hubs.la/Q04gpknz0
#LightningChart #Python
35
LightningChart® .NET runs on DirectX GPU rendering - not CPU, not GDI .
170 chart types. Billions of data points. WPF, WinForms & UWP. Zero flicker.
Developed since 2009. Trusted in defence, aerospace, medical & finance.
👉 hubs.la/Q04gd9k10

12
Building a trading app in JS?
LightningChart® JS Trader:
✅ 8 TA chart types incl. CandleStick & Heikin-Ashi
✅ 100 indicators
✅ 33 drawing tools
✅ 4,000 real-time charts at 60 FPS
GPU-accelerated. Built exclusively for fintech.
👉 hubs.la/Q04g3DBX0
11