
Assistant Professor at @NYUStern researching links between finance and the macroeconomy.
Joined October 2018
- Tweets 303
- Following 370
- Followers 3,668
- Likes 590
39 Photos and videos


Jan 29
Sure, I can explain this.
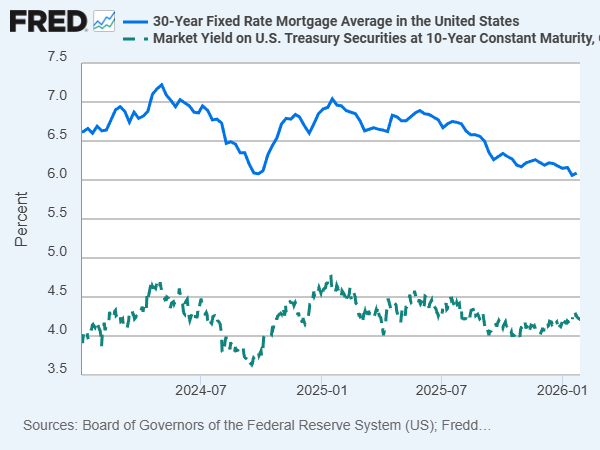
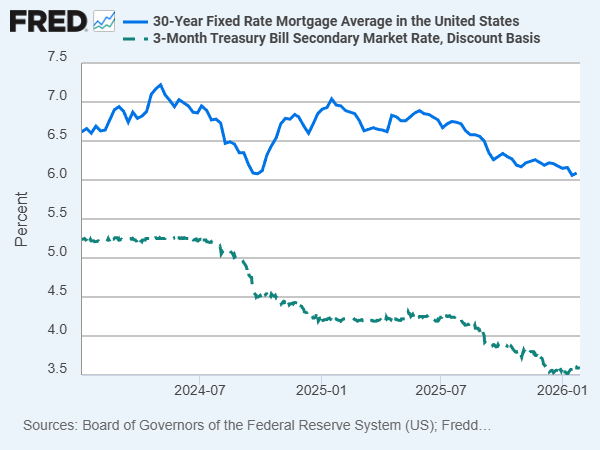
Let’s start with a recap of the facts: current mortgage rates are 6.09% (Freddie Mac average), compared to current 3mo treasury rates of 3.68%. This is indeed a large difference of around 2.4pp. Further, as the OP notes, the mortgage rate has not fallen much since 2024 even though 3mo treasury rates have fallen by almost 2pp (see graph).
1/5
Jan 28

Explain to me like I'm 5 years old how rates are 3.5%, but mortgage rates are still at 7%.
1
2
10
1,199
Jan 29
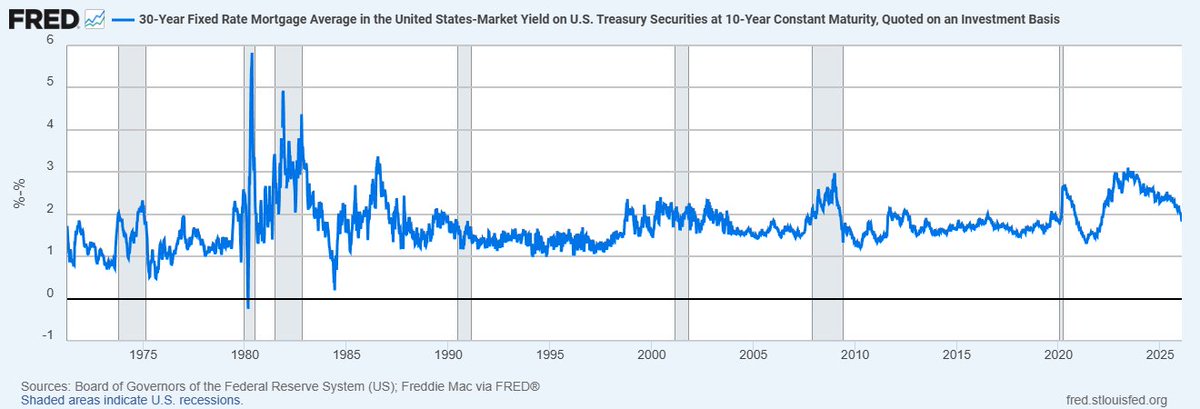
Last, why are mortgages so much more expensive than treasury bonds in the first place?
The difference takes into account a) the costs of creating and collecting payments on the mortgage, b) the cost of insuring the mortgage against default, c) prepayment risk (the fact that borrowers tend to refinance when rates are low but keep their cheap loans when rates are high), and d) lender profits.
Historically these have added up to spreads of 1.5pp to 2pp (see graph for historical gaps), so our current 1.8pp is right around average.
4/5
1
2
324
Jan 29
TL;DR: mortgages are like long term bonds, but with rates around 1.5pp to 2pp higher due to additional costs and risks, which continues to be right on the money today. Even though short term interest rates have fallen, long term interest rates have not, so neither have mortgage rates.
1
4
617
11 Nov 2025
Adam Solomon and I are seeking a highly skilled and motivated predoctoral research assistant to work with us at NYU Stern. This is a full-time position aimed at candidates interested in an economics or finance PhD. Faculty, please tell your students to apply! Link here:
apply.interfolio.com/176733
2
10
21
7,618
Dan Greenwald 🇺🇦 retweeted

2 Aug 2025
Thanks to all who contributed to our successful three-day summer school for PhD students at @TuftsEconomics.
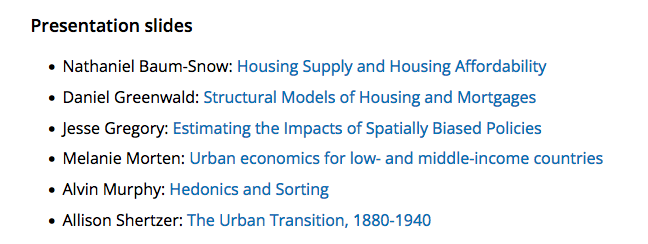
Presentation slides from our six faculty presenters are now available on the UEA webpage: urbaneconomics.org/workshops…
24
86
5,688
2 Nov 2024
My one and only election post.
For anyone who cares deeply about the outcome of this election, I urge you to not just vote but VOLUNTEER. It is easy to do, makes a real difference, and is surprisingly fun. If you have never done it before now is the PERFECT time to start. 🧵
3
3
34
6,680
2 Nov 2024
8/ PS. If you can't canvass consider phone banking. It's surprisingly easy: you do it from home on the computer and they automate the dialing. You're just calling likely supporters, and are largely providing key info on where and how to vote, which really helps. Try it out!
1
2
796
2 Nov 2024
9/ If anyone from NYC wants to head to PA on Tuesday, let me know and we can coordinate on the same bus (or even carpool). Let's do this!
4
654

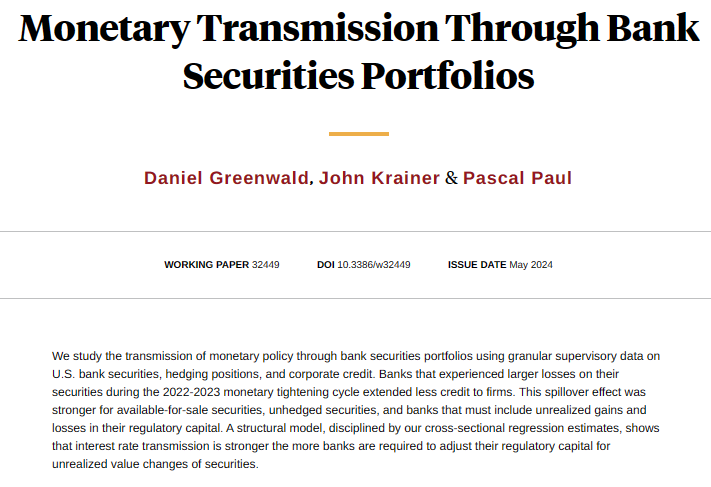
Banks facing losses on their securities portfolios cut lending to firms, but mainly when those losses tighten their capital requirements, from @ProfGreenwald, John Krainer, and @pascalpaul nber.org/papers/w32449
12
23
9,154
Dan Greenwald 🇺🇦 retweeted

29 Nov 2023
Wealth inequality increases when r declines👇
papers.ssrn.com/sol3/papers.…
28 Nov 2023

By the way, while it is a widely held view that wealth inequality is high when r-g is large because of Piketty's book, this is not true among economists who understand finance or have just looked at the data.
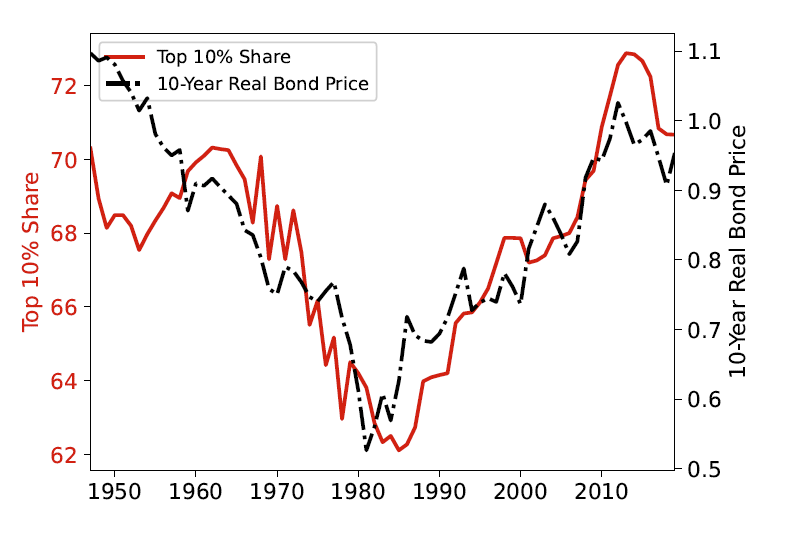
As the graph below shows, there is a perfect time correlation between the level of wealth concentration and the inverse of r (1/r, represented here by the price of bonds).
The fact that the correlation between wealth inequality and r-g in the data is the opposite of what the Piketty story predicts was pointed early on in Acemoglu and Robinson (2015).
It's incredible that a story that is rejected by casual regressions/plotting the data is so popular.
Intuitively, falling interest rates have the direct mechanical effect of increasing the market value of assets, and in particular that of long-term assets such as start ups and stocks, which tends to be disproportionally owned by the rich. It also inflates the fair value of non-tradable assets such as Social Security benefits which disproportionnally accrue to the middle-class but are left out of these computations in most of the literature.
1
14
97
27,746
Dan Greenwald 🇺🇦 retweeted
29 Nov 2023
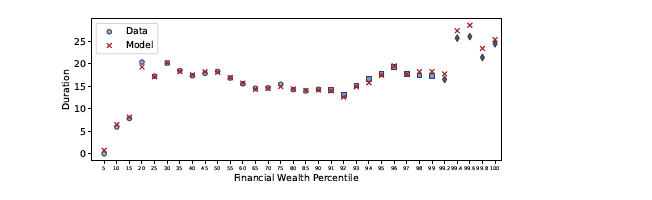
The key driver of this tight relation between inequality and r is the fact that the wealthiest households have much duration than other households, leading to the concentration of capital gains in the right tail of the wealth distribution when r declines.
28 Nov 2023
By the way, while it is a widely held view that wealth inequality is high when r-g is large because of Piketty's book, this is not true among economists who understand finance or have just looked at the data.
As the graph below shows, there is a perfect time correlation between the level of wealth concentration and the inverse of r (1/r, represented here by the price of bonds).
The fact that the correlation between wealth inequality and r-g in the data is the opposite of what the Piketty story predicts was pointed early on in Acemoglu and Robinson (2015).
It's incredible that a story that is rejected by casual regressions/plotting the data is so popular.
Intuitively, falling interest rates have the direct mechanical effect of increasing the market value of assets, and in particular that of long-term assets such as start ups and stocks, which tends to be disproportionally owned by the rich. It also inflates the fair value of non-tradable assets such as Social Security benefits which disproportionnally accrue to the middle-class but are left out of these computations in most of the literature.
8
19
133
47,273
13 Nov 2023
Talented students interested in working with @arpitrage and myself on research in economics and household finance, please apply!
13 Nov 2023

Hiring a predoc with @ProfGreenwald at NYU Stern to work on real estate and finance. Apply here!
apply.interfolio.com/135959
@econ_ra

10
31
12,372