
Joined August 2021
- Tweets 541
- Following 3
- Followers 33
- Likes 1
482 Photos and videos


2 Mar 2025
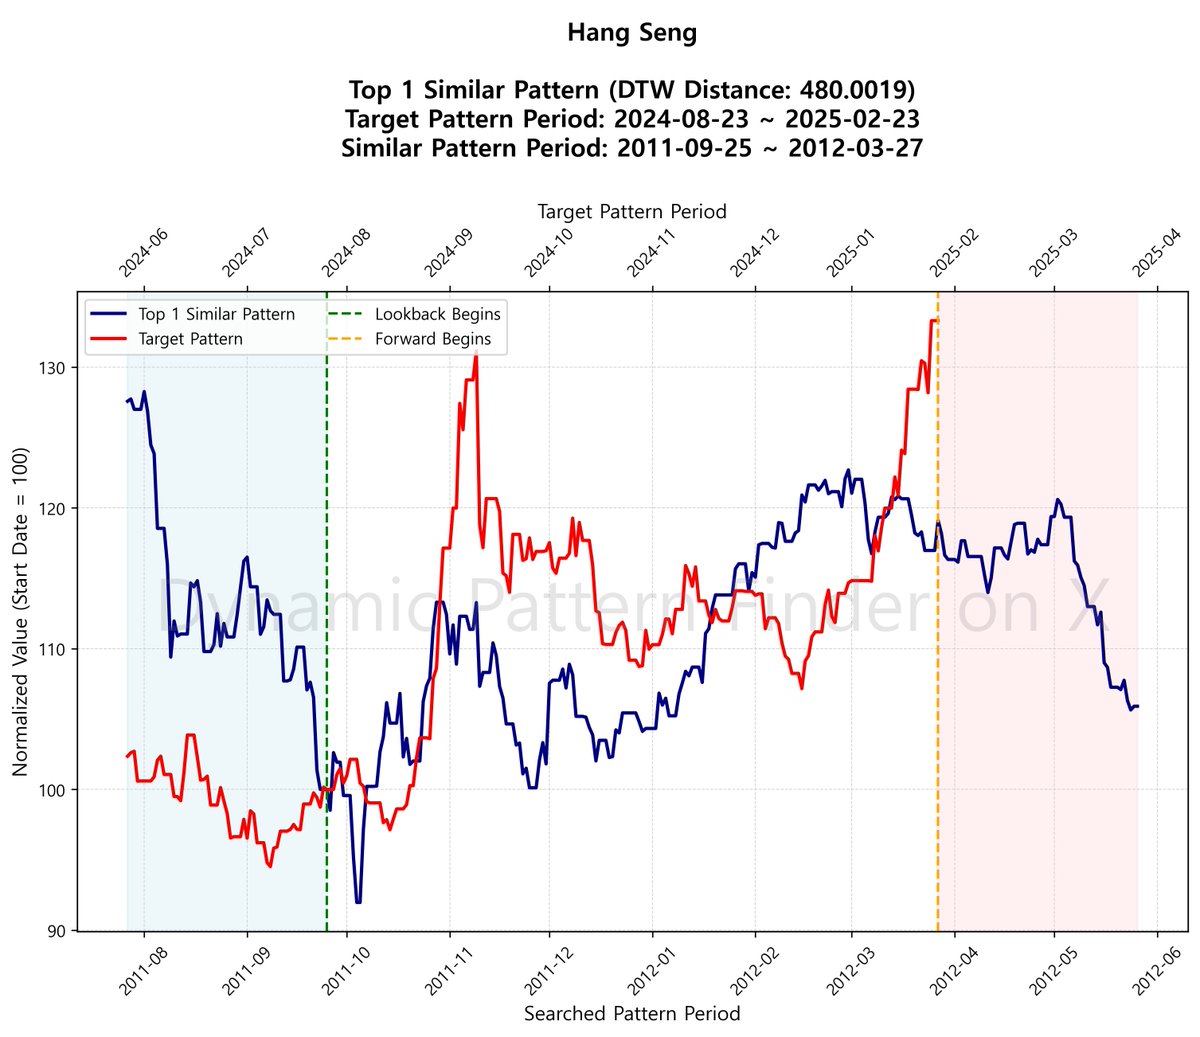
🚨[Hang Seng: Future Moves Unveiled?]
Is history about to repeat itself or simply tease us with déjà vu? Watch as we dive into the Hang Seng's past to uncover what might be in store for 2025! Highlighting patterns from August 2024-February 2025 and their eerie resemblance to events in late 2011 to early 2012, the graph reveals a striking rate of change with rapid climbs and sharp falls. Expect volatility, as the blue and red lines dance to their unpredictable tune.
#HangSeng $HSI #StockMarket #Investing #HistoricalPatterns #MarketAnalysis
Curious about more historical insights or just love a good market mystery? Follow RAWriginal for more!
80
2 Mar 2025
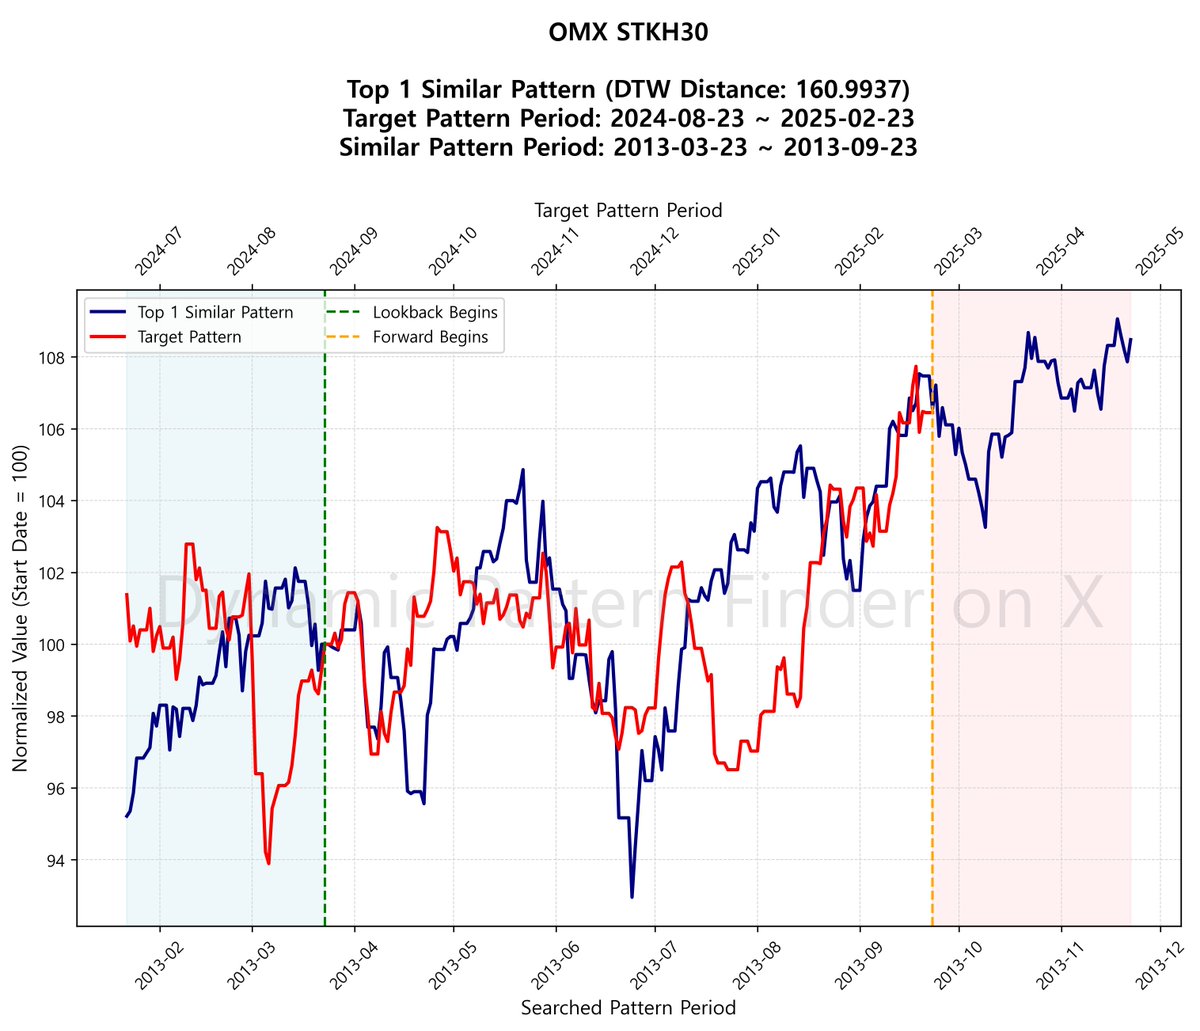
🚨[OMX STKH30: Past Lessons for Future Gains]
Get your time-traveling goggles on, because we're diving into OMX STKH30's past to predict its future! The graph shows a remarkable similarity between the movements from August 2024 to February 2025 and a pattern from March to September 2013. With a climb in both periods, the steepness reveals optimistic volatility. Could history be repeating itself? Stay tuned as we explore these intriguing connections.
$OMX #PatternRecognition #StockInvesting #DynamicPatterns #FutureGains #PredictiveAnalysis #FollowForMore #InvestmentInsights
17
2 Mar 2025
🚨[Hang Seng China Enterprises: Predicting Future Moves?]
Time travel with data! Our Dynamic Time Warping analysis found a historical twin from 2002-2003 that's eerily similar to the recent pattern of Hang Seng China Enterprises from Aug 2024 to Feb 2025. As the past anticipates the future, the steep climb in past months suggests a bullish trend ahead. Will history repeat? Follow us to find out—and maybe predict the future yourself! #StockMarket #HangSeng $HSCEI #InvestSmart #PredictiveAnalytics
1
44
2 Mar 2025
🚨[Swiss Market Prediction: History Repeating?]
Embark on a time-traveling journey with the Swiss Market as we map today’s trends onto the echoes of 2000! Our Dynamic Time Warping analysis reveals a steep climb in volatility and a promising upward trajectory from August 2024 to February 2025. Could the Swiss Market mirror its past moves? Join us to find out if past patterns truly dictate future performance. Follow RAWriginal to stay ahead in the investment game!
#SwissMarket $SMI #FinanceInsights #InvestmentTrends #TechAnalysis #MarketPatterns #FollowForMore #InvestmentJourney
29
2 Mar 2025
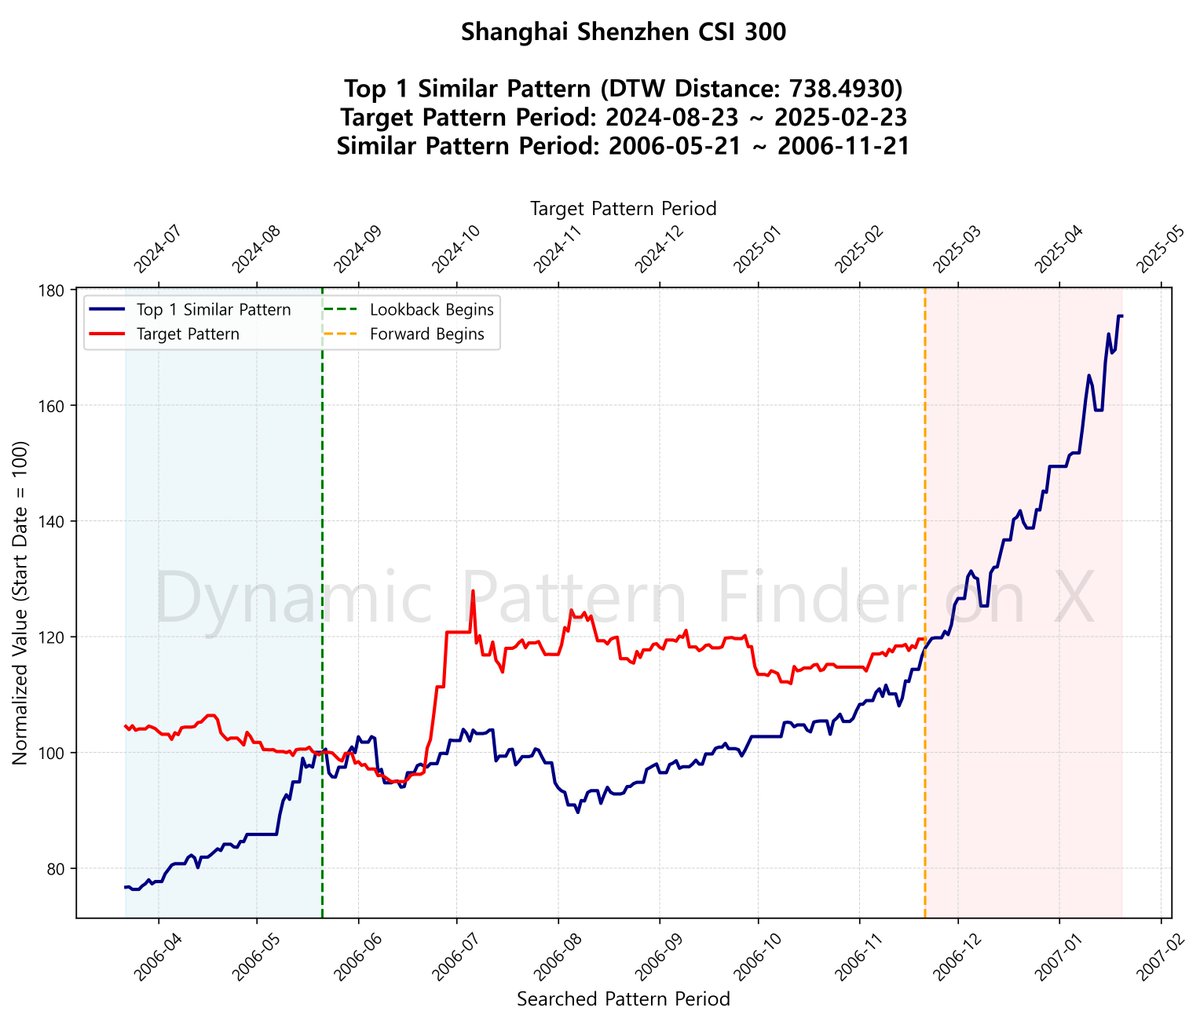
🚨[Shanghai Shenzhen CSI 300: Historical Patterns Dancing on the Edge of Tomorrow!]
Our trusty Dynamic Time Warping algorithm has unearthed a fascinating parallel between the Shanghai Shenzhen CSI 300’s potential future movements and its historical data from 2006. As we stand on the brink of the target pattern period from August 2024 to February 2025, the path ahead might just echo the steady climb and sudden leaps seen in mid-2006. Watch how the blue line skyrockets steeply in early 2007—will today’s market follow suit? Keep your eyes peeled (and maybe your wallets ready) as history writes its rhymes. Explore more insights like these by clicking through our profile.
#HistoricPatterns #ShanghaiShenzhenCSI300 $CSI300 #Investing #MarketAnalysis
31
2 Mar 2025
🚨[Shanghai Composite: A Journey Through Time]
Unveiling the Shanghai Composite's potential future by pairing today's movements with eerie echoes from 2006! Our dynamic time warping voyage suggests an intriguing pattern resemblance, hinting that the Composite might relive this past journey with steep volatility increases starting August 2024. If you like plotting the future based on history, follow us or explore our threads for more unique insights!
$SSE $ShanghaiComposite #StockMarket #InvestSmart #PatternMatching #FinanceInsights #FollowUs
26
2 Mar 2025
🚨[Shenzhen Composite: Historical Echoes from 2006 Revealed!]
Unraveling the past to predict the future! Our analysis of the Shenzhen Composite dives into a fascinating pattern match between Aug 2024 - Feb 2025 and its historical cousin from 2006. With the Dynamic Time Warping algorithm, the eerie similarity is striking. Notice the steep climb post-January 2007, hinting at a volatile showdown ahead. Could history repeat itself? Time will be the judge. Follow this intriguing journey! #Investing #StockAnalysis #ShenzhenComposite
For more insights like these, tap that follow button and explore our threads!
13
1 Mar 2025
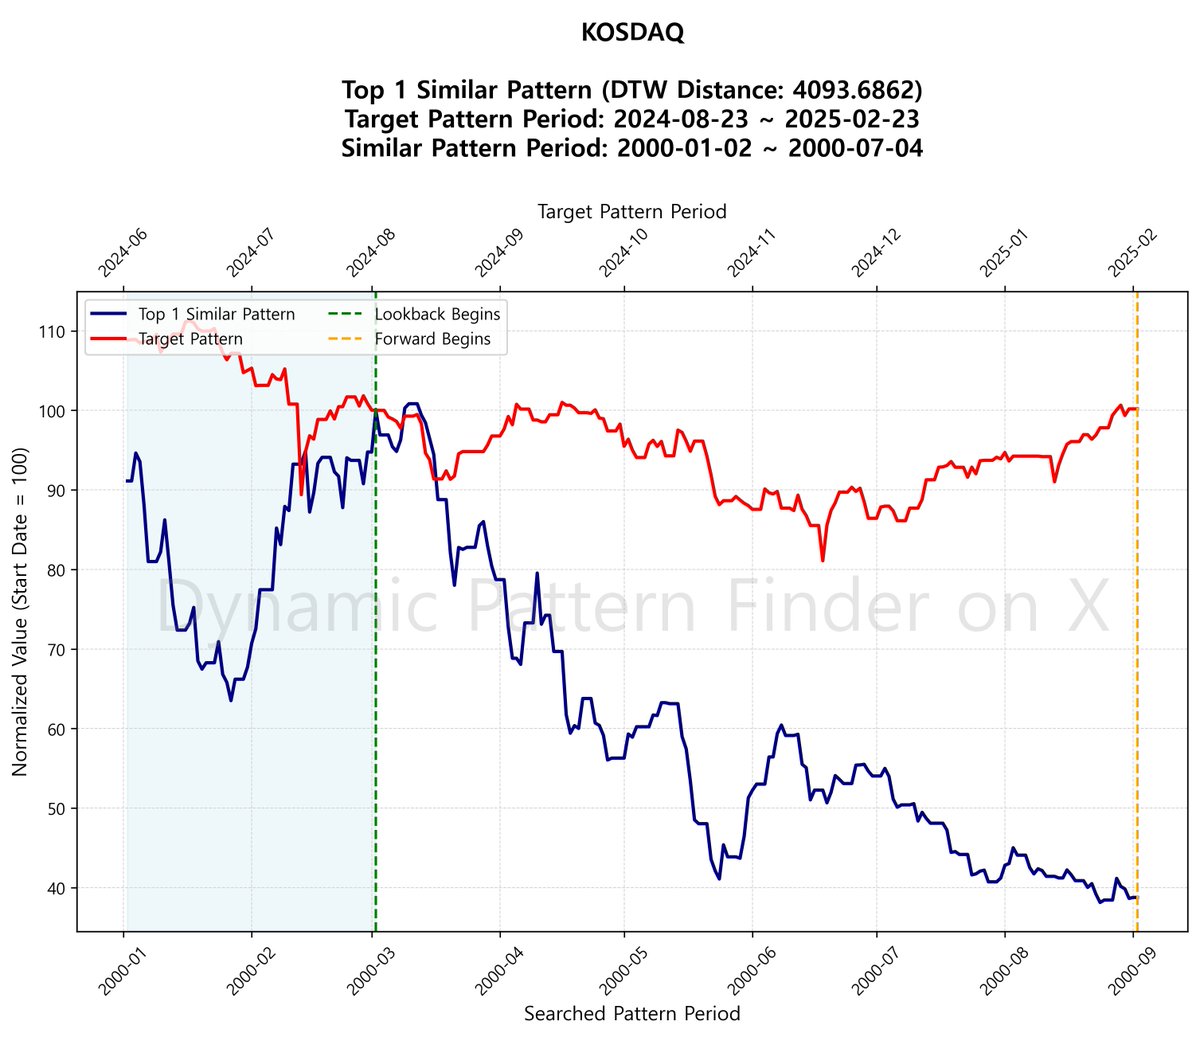
🚨[KOSDAQ: Echoes from the Past]
Fasten your seatbelts, investors! History might just be replaying itself on the KOSDAQ stage. This graph uses Dynamic Time Warping to compare the period from August 2024 to February 2025 with a pattern from January to July 2000. With a sudden plunge starting around October and November, the market volatility could mirror its historical counterpart. Will the bull take charge again as it did post-July 2000? Follow us to find out! #KOSDAQ #MarketAnalysis $KOSDAQ
Discover more fascinating patterns by clicking our profile and stay ahead with RAWriginal!
15
1 Mar 2025
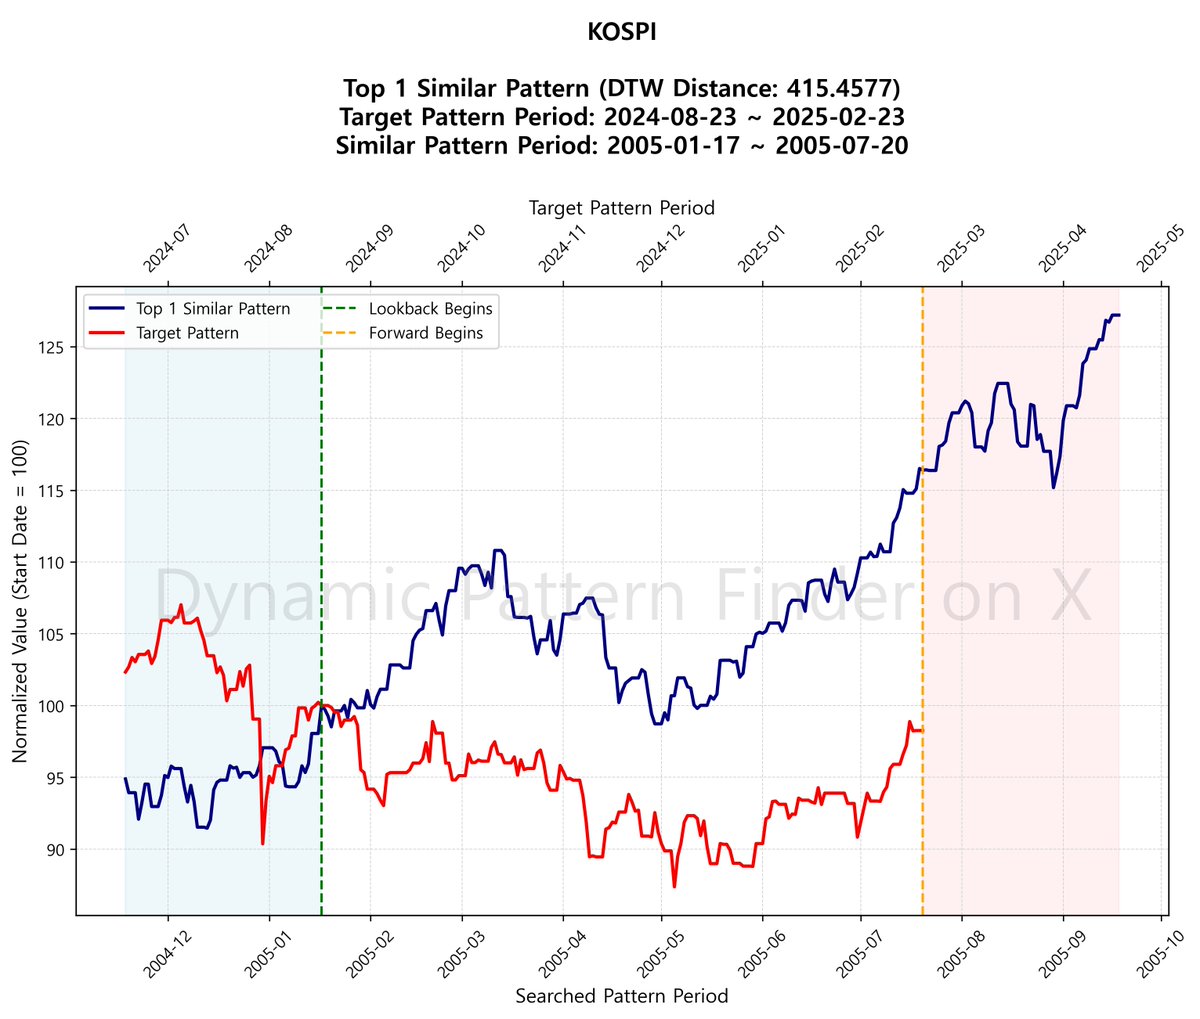
🚨[KOSPI Pattern Wizardry: History’s Echoes for Aug 2024 - Feb 2025]
In our latest analysis, we’ve unearthed a striking similarity in KOSPI’s patterns from 2005 to potentially preview its path for August 2024 to February 2025. As we glance at history, the steep rise post-2005 suggests a thrilling possibility of future upticks. Are past events whispering hints about KOSPI’s future? Dive into the data dance, connect the dots, and keep an eye out—history may just be your guide! Follow RAWriginal for more pattern revelations.
Tags: $KOSPI #StockMarket #Patterns #Investing #TimeWarpInsights
5
1 Mar 2025
🚨[Examining the Future: Taiwan TAIEX Moves]
Could the past guide the future? Our latest analysis suggests the Taiwan TAIEX might just repeat a history lesson from 2013-2014. Using Dynamic Time Warping, we’ve unearthed a strikingly similar pattern to the one expected in 2024-2025. Notice how the TAIEX's past march toward prosperity was steady yet volatile, mirroring potential future moves. Will history repeat or are we writing a new chapter? Stay tuned, investors! Follow RAWriginal for dynamic insights.
#TaiwanTAIEX #InvestmentPatterns #StockMarketAnalysis #HistoryRepeats #PredictTheFuture #FollowForMore
25
1 Mar 2025
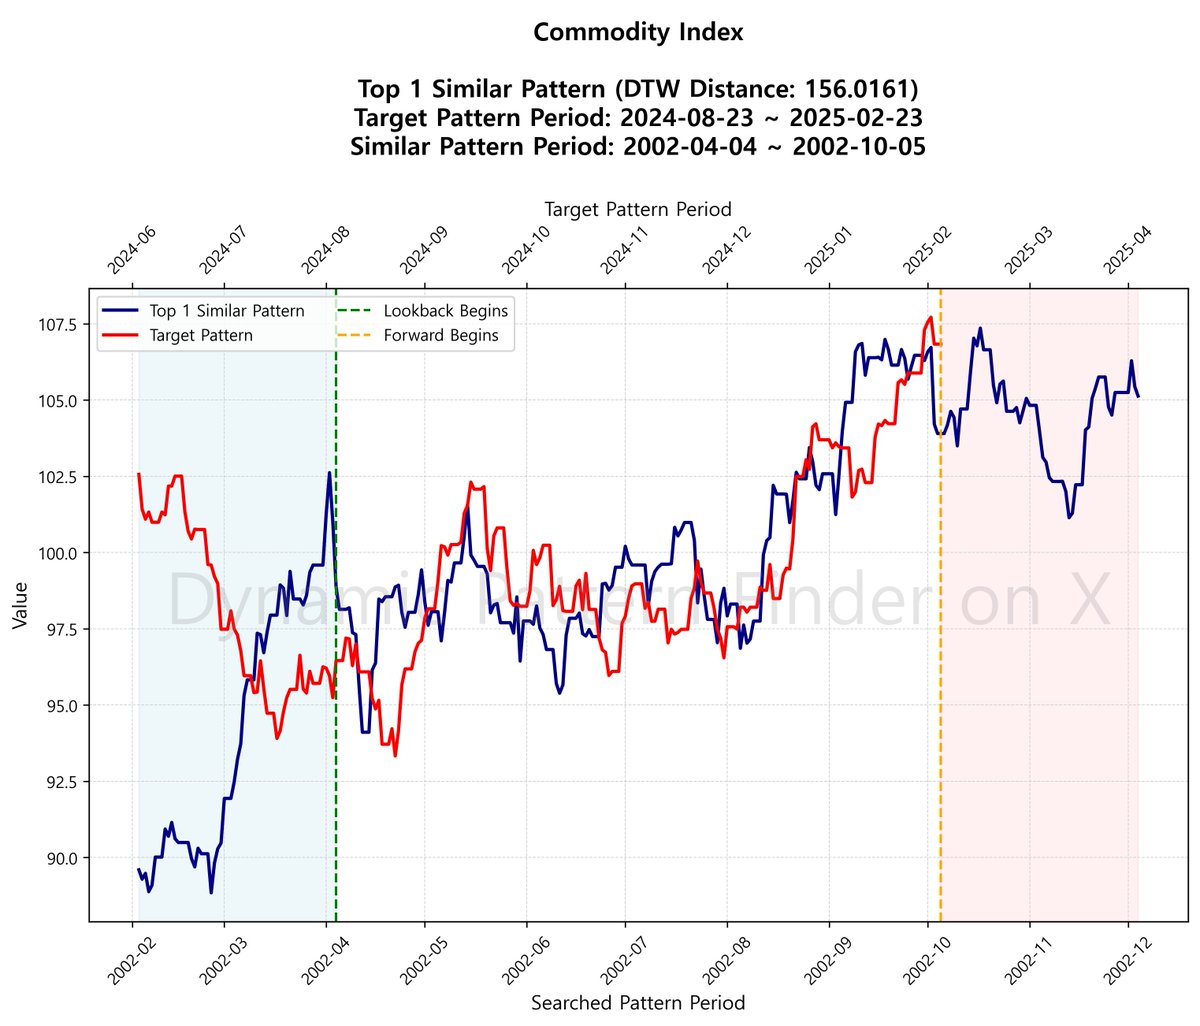
🚨[Commodity Index Pattern Analysis: August 2024 - February 2025]
Ever feel like the market’s playing déjà vu with your investments? Our latest analysis suggests history might just be echoing through time. As we inspect the Commodity Index from August 2024 to February 2025, it mirrors an earlier pattern from April 2002 to October 2002. Notice how the target pattern’s rise in late 2024 is more volatile and steeper compared to the 2002 data. Could the past be whispering hints about the future? Follow RAWriginal for more insights and stay ahead of the curve! #CommodityIndex #MarketAnalysis
$COMMODITY #InvestmentPatterns #HistoricalTrends
8
1 Mar 2025
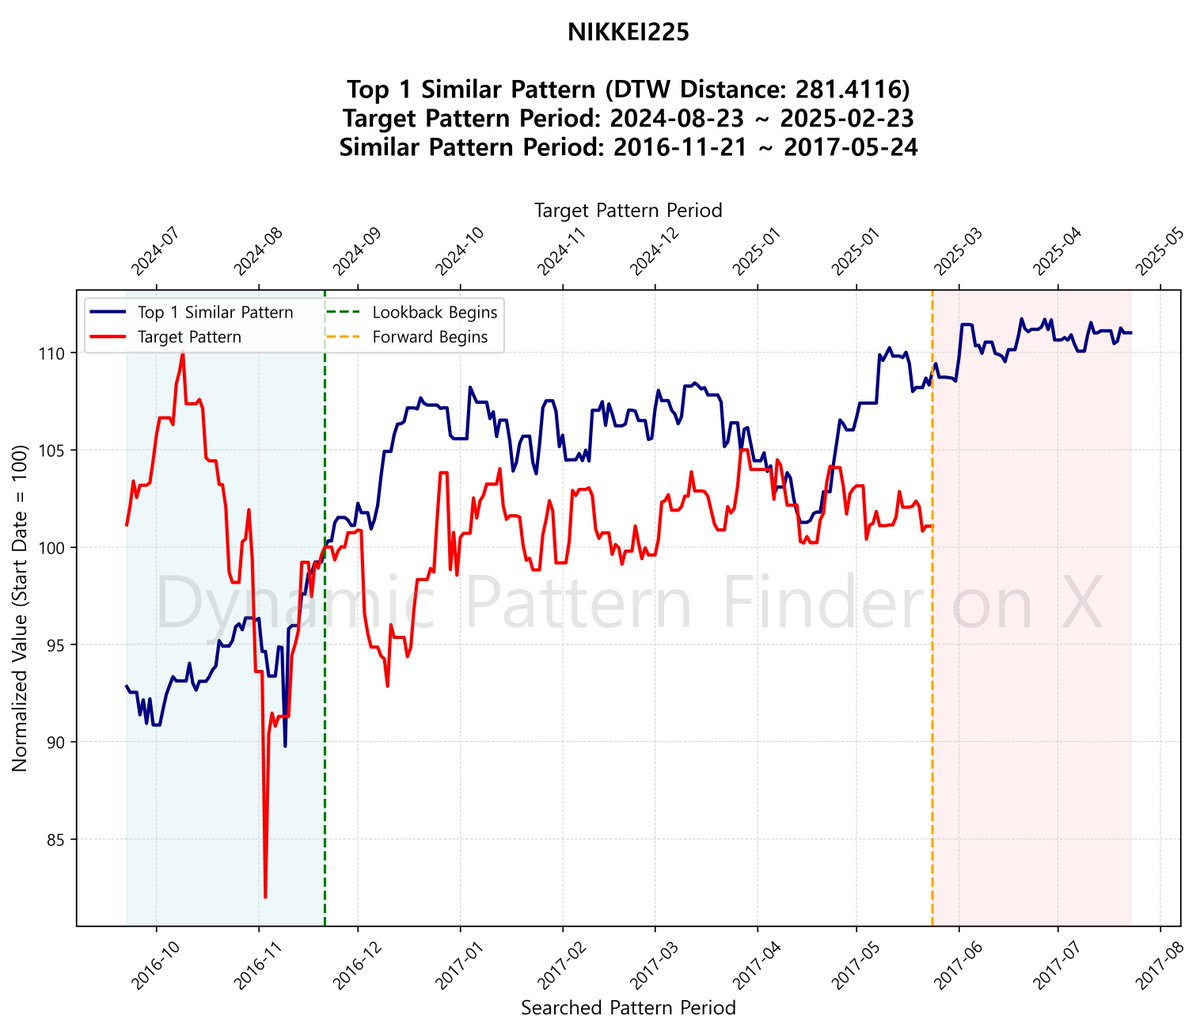
🚨[NIKKEI225: Unearthing the Past to Predict the Future]
Discover how the NIKKEI225's historical echoes might shape its future! By comparing the target period from August 2024 to February 2025 with a remarkably similar period in late 2016 to mid-2017, we unlock potential insights. As we sail through volatile seas, note the slight upward momentum yet steady undulations of late 2016—could history be our guide? Follow us for more intriguing journeys through time, where past patterns illuminate future possibilities.
$NIKKEI225 #HistoricalPatterns #InvestingInsights #FollowUs RAWriginal #DynamicTimeWarping #StockMarketPredictions
17
1 Mar 2025
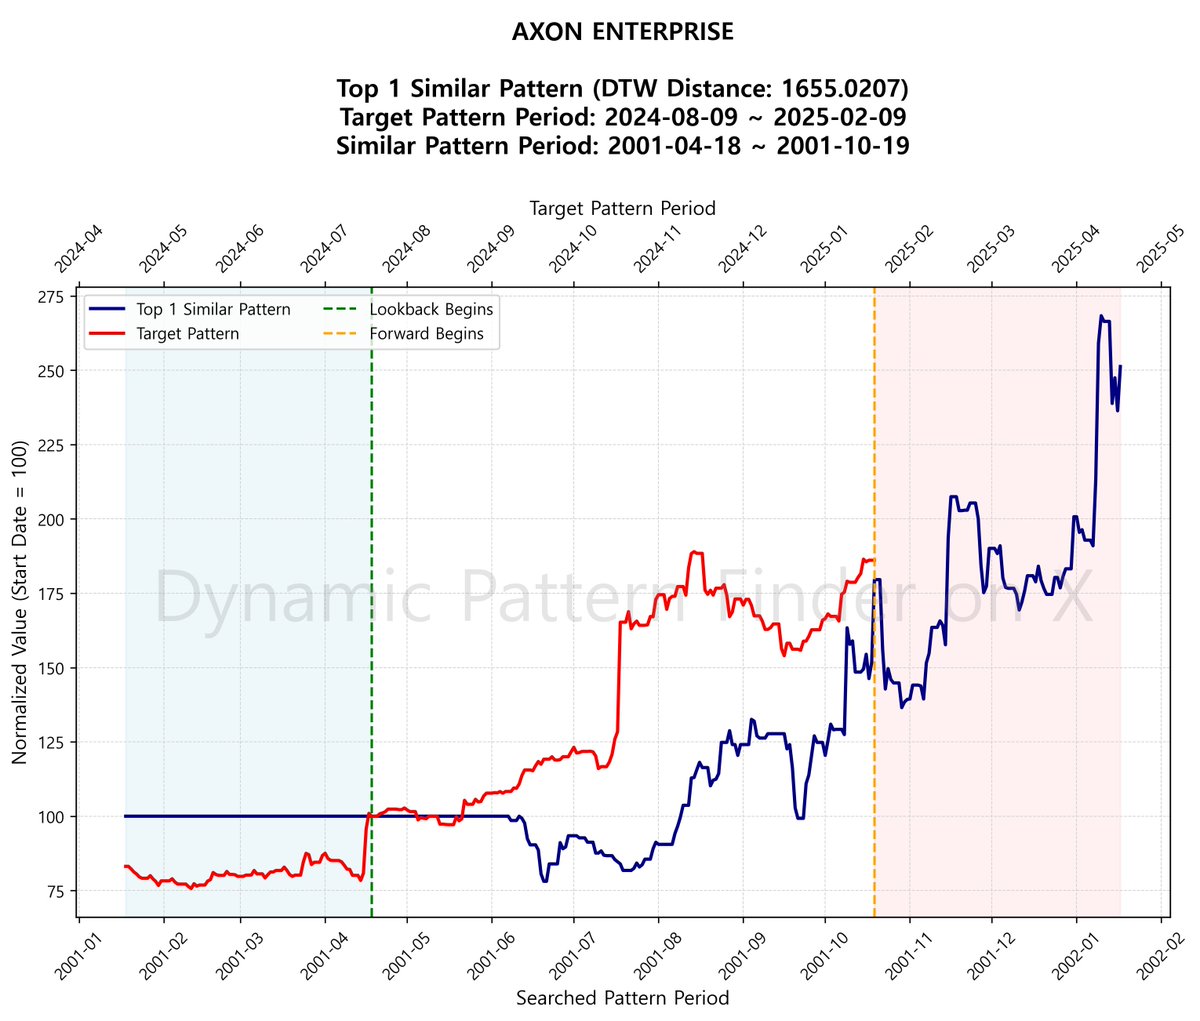
🚨[AXON ENTERPRISE's Historical Echo: What 2001 Tells Us About 2025]
Dive into the past to foresee the future with our latest analysis on AXON ENTERPRISE. Using Dynamic Time Warping, we've matched patterns from 2001 to draw potential scenarios for 2025. From August 2024 to February 2025, the target pattern shows a steady rise, echoing the volatility and upward trend seen in 2001. Are we about to witness history repeat itself in the stock market? Stay tuned! Follow RAWriginal for more insights and updates.
$AXON #StockMarket #PatternFinder #InvestmentInsights #HistoricalAnalysis
11
1 Mar 2025
[Ball Corp's Historical Echoes: Predicting Patterns from 2000 to 2025]
🎯 Will Ball Corp repeat a pattern from the 2000s in 2025? As we delve into historical similarities using Dynamic Time Warping, the journey from August 2024 to February 2025 mirrors a striking past from January to July 2000. As the line climbed with stability in April 2000 and took some exciting dips after, is a similar rollercoaster ride on the horizon? Follow us for more intriguing predictions and let's see if history truly does repeat itself! #BallCorp #InvestmentInsights #PatternAnalysis $BLL
15
1 Mar 2025
[Dayforce Inc: Uncovering Patterns from 2018 to Predict 2025]
Peek behind the curtain of market history with Dayforce Inc's intriguing similarities from 2018 and its potential dance into 2025. While the blue line shows a significant period of volatility and growth in mid-2018, the red line suggests calm seas ahead with potential upward momentum, defying gravity like a market trapeze artist. Could these patterns hint at what's next for Dayforce Inc? If history's wheel spins again, the current trend might just mirror past movements. Follow us for more exciting pattern revelations! #MarketPatterns #InvestSmart $DAY किसका छेहरा है कीमत बदल सकता है?
71
28 Feb 2025
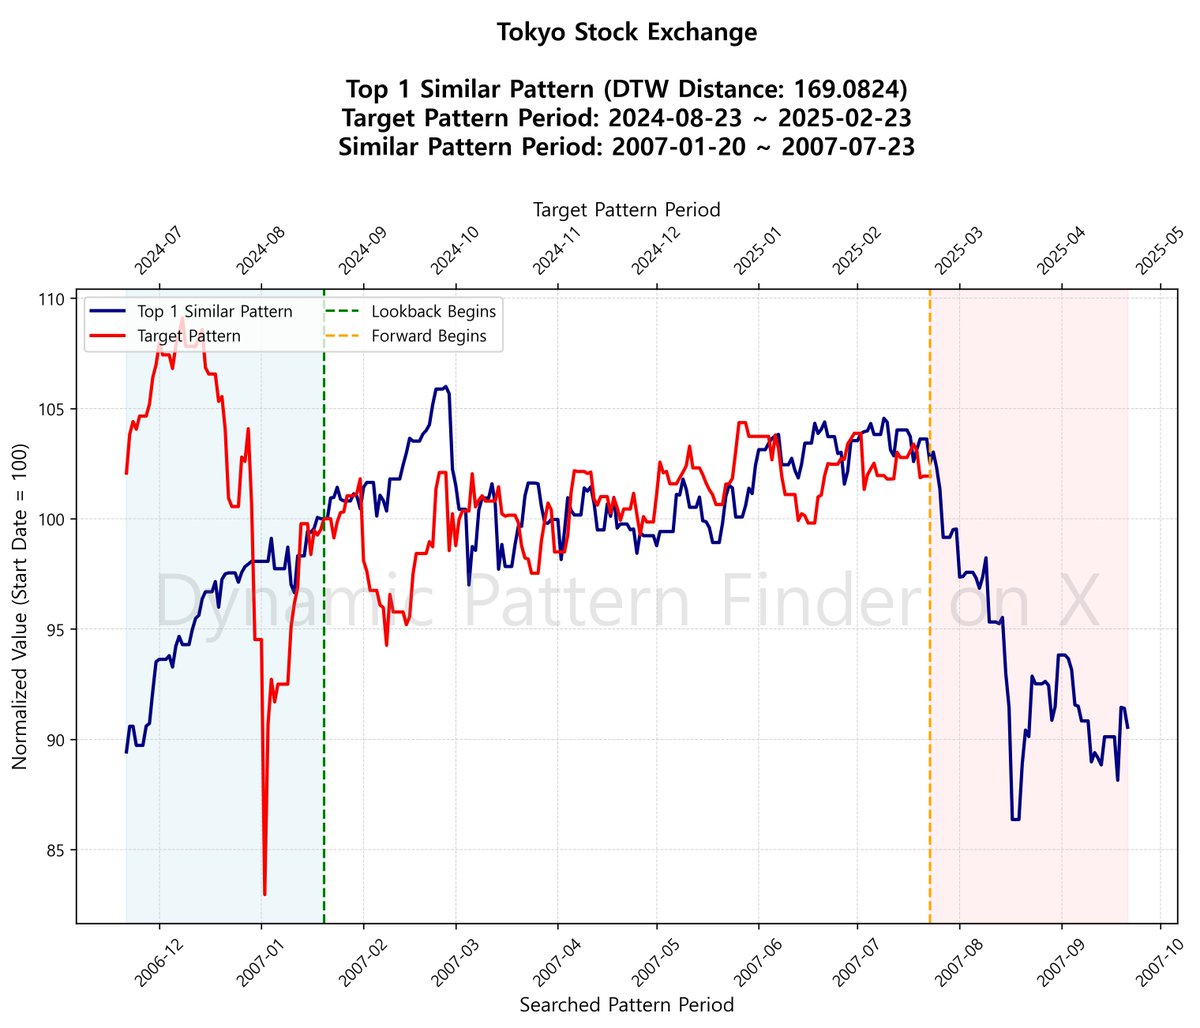
[Tokyo Stock Exchange: A Journey Through Time]
In the world of investments, the past often whispers secrets about the future. Our analysis of the Tokyo Stock Exchange reveals a striking pattern from 2007 closely mirroring recent movements since August 2024. With volatility on the rise in early 2025, could history be gearing up to repeat itself? Follow us on this analytical adventure, where old patterns might predict new profits! Want to see if this trend continues? Dive into our insights and stay ahead of the curve. #StockPredictor $TokyoStockExchange #HistoricalAnalysis #InvestmentAdventure #JoinTheJourney
15
28 Feb 2025
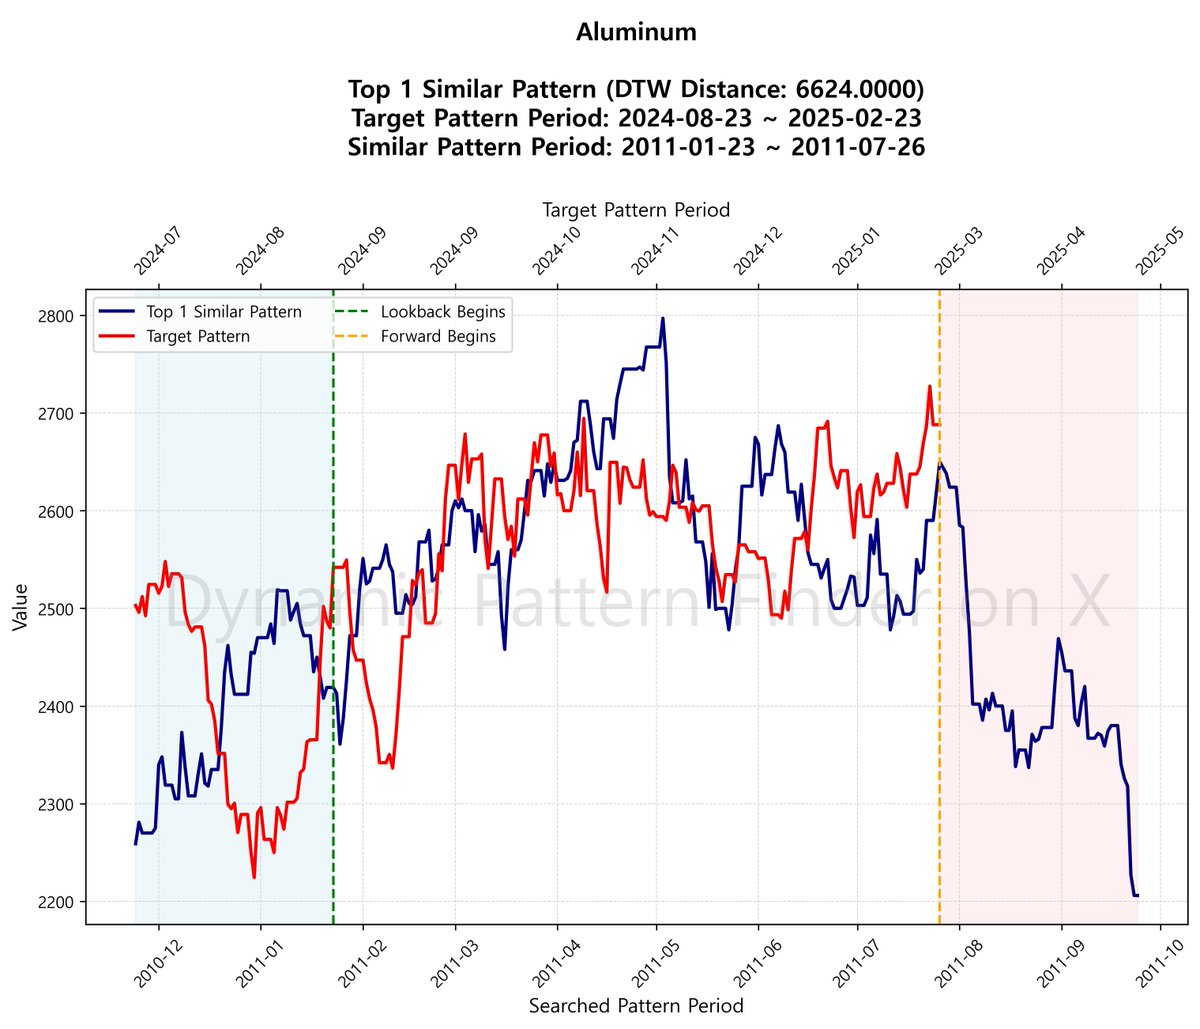
[Foresight Unveiled: Aluminum Trends]
Unravel Aluminum's future with extraordinary past insights! By leveraging the Dynamic Time Warping algorithm, we map today's trends to a similar pattern from 2011. With steep climbs and volatile twists from August 2024 to February 2025, could history repeat itself? Follow along to see if the future aligns with past trajectories. For an in-depth dive, click my profile and explore more surprises lurking in historical data!
$Aluminum #Investment #MarketTrends #StockPredict #HistoricalPatterns #FollowForMore
8
28 Feb 2025
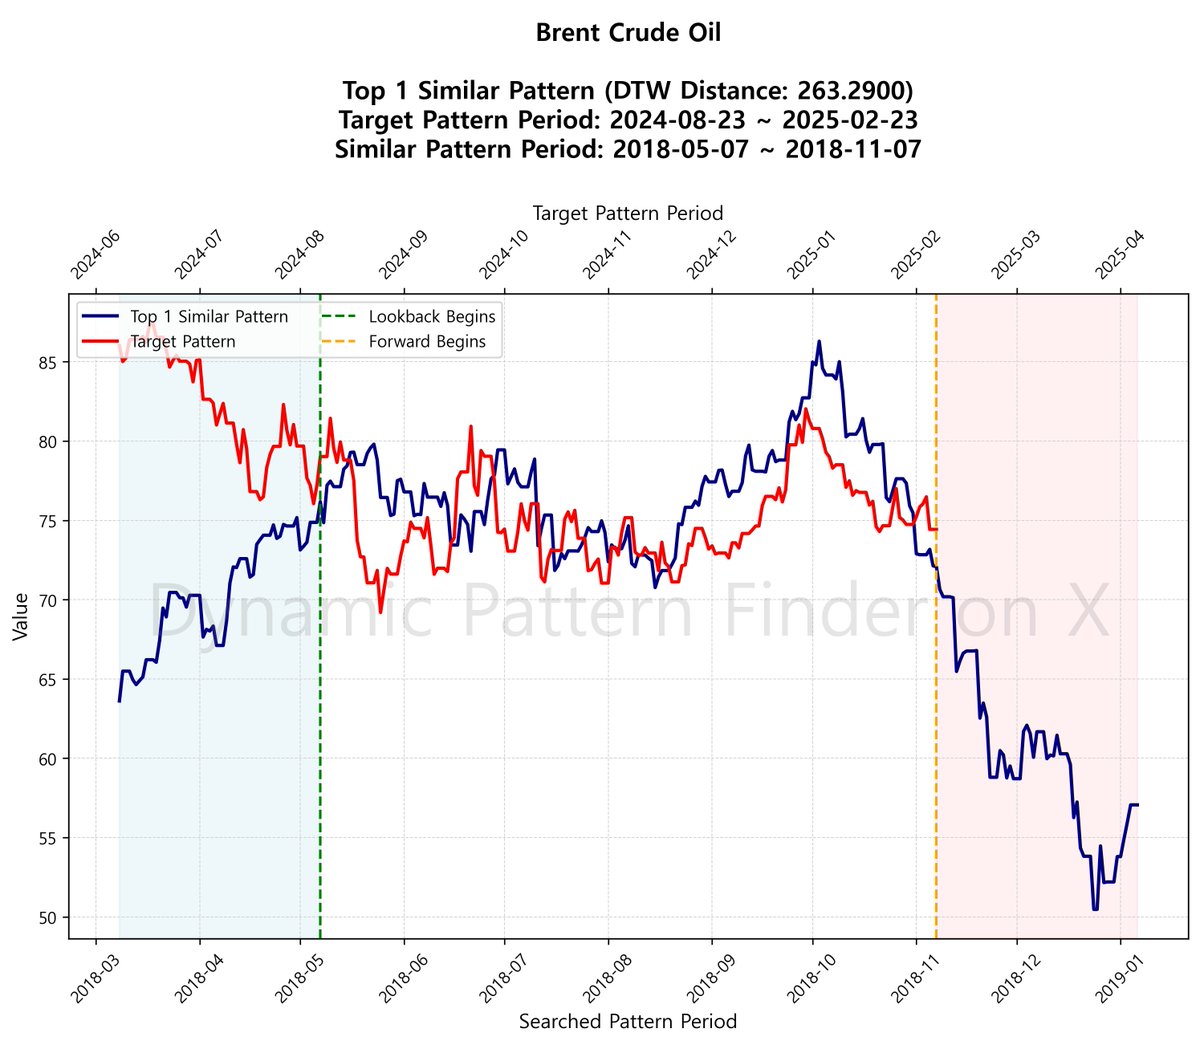
[Exploring Brent Crude Oil Patterns: A Glimpse into the Future?]
Are we peering into a crystal ball, or just hoping history has the audacity to repeat itself? This chart reveals Brent Crude Oil’s intriguing parallels between 2018's rollercoaster and the near future from August 2024 to February 2025. With a similar historical pattern boasting sharp drops and climbs, could the upcoming months spell a repetition? Let’s watch and see if this ride meets our predictions. Dive into the dynamics and explore more insights by checking out RAWriginal! #BrentCrudeOil #Investing #HistoricalPatterns $BNO
Follow for more thrilling market insights and discover how we turn past data into future predictions!
41
28 Feb 2025
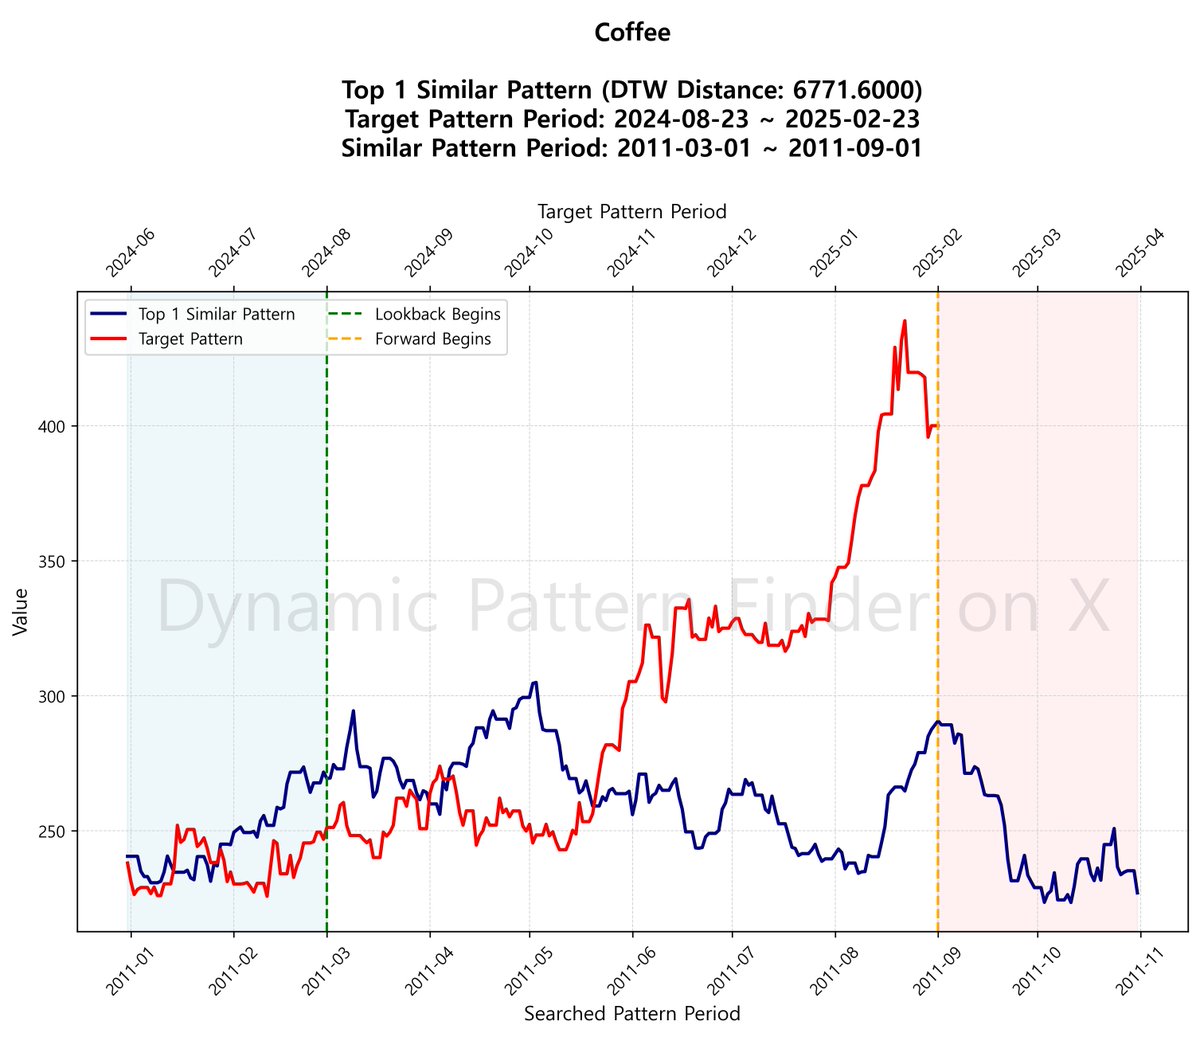
[Caffeine Boost: Coffee's Historical Pattern Analysis]
Dive into the brew of the past with our latest coffee analysis! Using Dynamic Time Warping, the data reveals compelling similarities between the months of March to September 2011 and August 2024 to February 2025. The recent trend shows a steep rise, possibly hinting at future volatility. Are we witnessing history repeating itself in the coffee market? Follow RAWriginal to stay updated on these fascinating patterns!
#Coffee $COF #Investment #MarketTrends #HistoricalPatterns #PredictiveAnalysis
10
28 Feb 2025
[Corn: Echoes from the Past – A Historical Ride]
Hungry for the past? Dive into Corn's historical patterns and feast on potential future insights! Our graph shows Corn's target pattern period from August 2024 to February 2025, linked with a remarkably similar wave from late 2010 to mid-2011 using DTW magic. The searched pattern’s steep climb after February 2025 hints at a promising ascent—if history dares to repeat! Will the future mirror this mysterious past dance? Follow the breadcrumbs and stay ahead with us.
$CORN #Investing #PatternAnalysis #StockMarket #FuturePredictions #HistoricalPatterns RAWriginal

12