
Joined September 2020
- Tweets 587
- Following 55
- Followers 10,354
- Likes 409
230 Photos and videos


Pinned Tweet

27 Jun 2024
🎉🚀 Introducing R-PACKAGES.IO 🚀🎉
Discover & Explore R Packages, Functions, and Datasets like never before! 🌟
✨ 20k Packages
✨ 400k Functions
✨ 40k Datasets
The ultimate resource for R developers! 📊🔍
🔗 r-packages.io
#RStats
5
28
109
28,323
22 May 2025
[Tip of the day]
Write your R scripts like others will read them, because future you is someone else
Comment generously, name clearly
#rstats #CodeStyle
2
10
1,229
14 May 2025
💡 Try {ggspatial} to easily add scale bars, north arrows, and basemap layers to your ggplot2 maps
🔗 r-packages.io/packages/ggspa…
21
94
4,377
12 May 2025
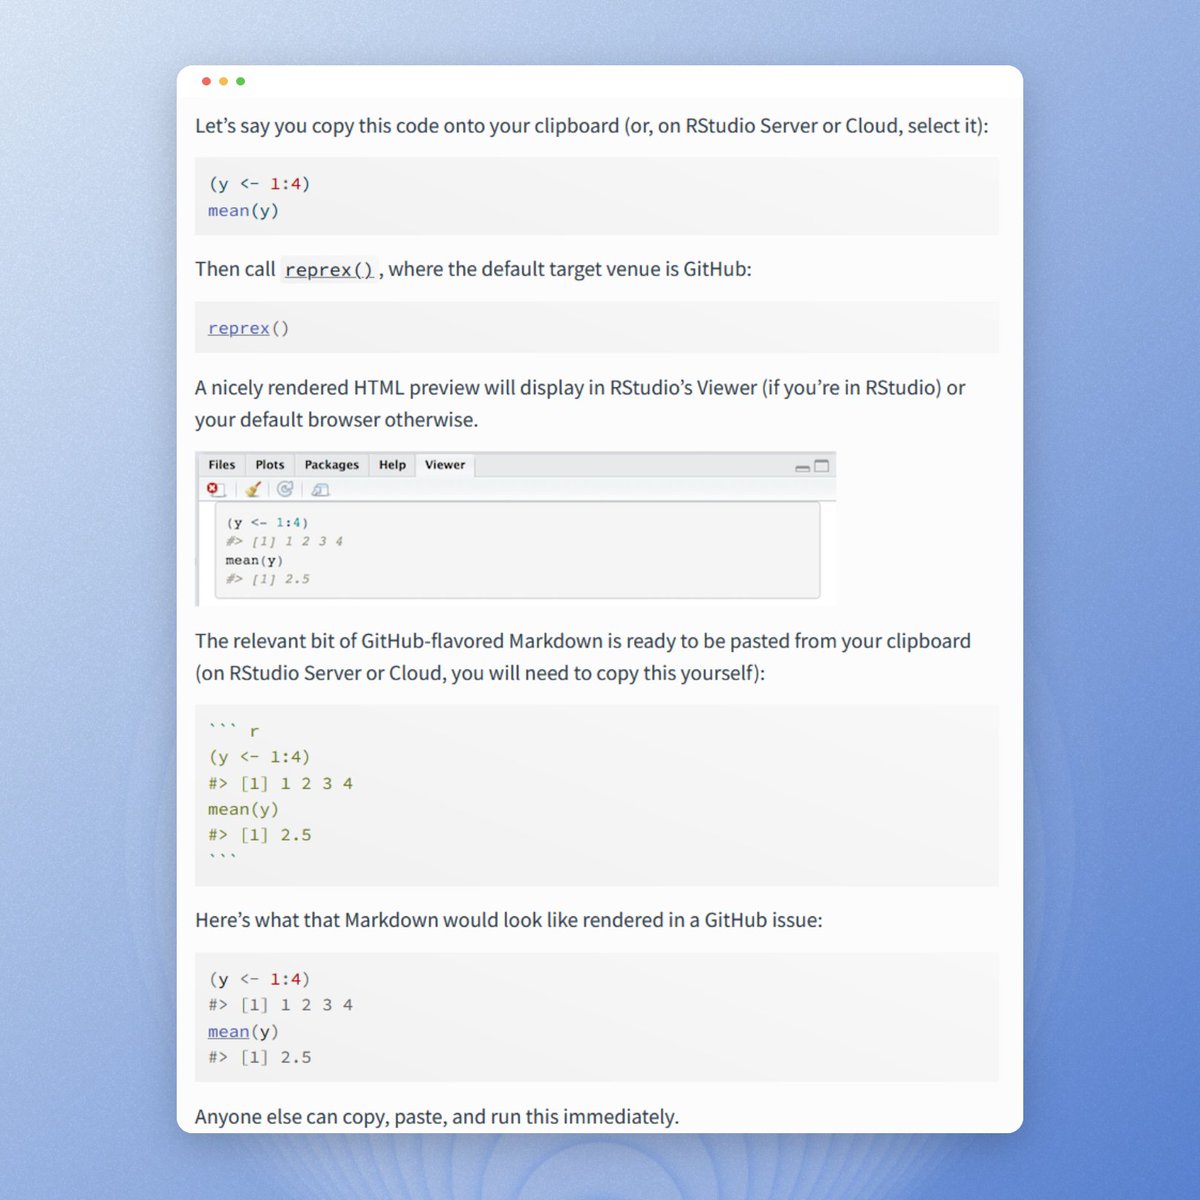
💡 Struggling to get help with your R code online?
Try {reprex} package to create a reproducible example that shows exactly what your code does
Just write your code, run reprex(), and paste the result. Easy, clean, helpful.
👉 r-packages.io/packages/repre…
13
53
3,153
8 May 2025
🌈 Try rainbow parentheses!
They color each level of nesting so you can spot mismatches instantly.
A simple trick, a huge difference for debugging 👇
#rstats #rstatsTips #DataScience #Productivity
1
8
23
1,488
R CODER | Jose Carlos Soage 📊 retweeted

7 May 2025
🧵 How to clean data like a pro with dplyr and tidyr in R
If you're still struggling with messy datasets or spending hours on manual cleanup…
This thread is your shortcut to clean, tidy, analysis-ready data 👇
#rstats #DataCleaning #DataScience
1
5
18
1,186
7 May 2025
📢 Si eres de España o LATAM y te interesa el mundo de la ciencia de datos…
En mi LinkedIn personal (en español) comparto ideas, herramientas y reflexiones sobre IA, data science y emprendimiento 👤
¿Conectamos?
👉 linkedin.com/in/jose-carlos-…
1
2
528
6 May 2025
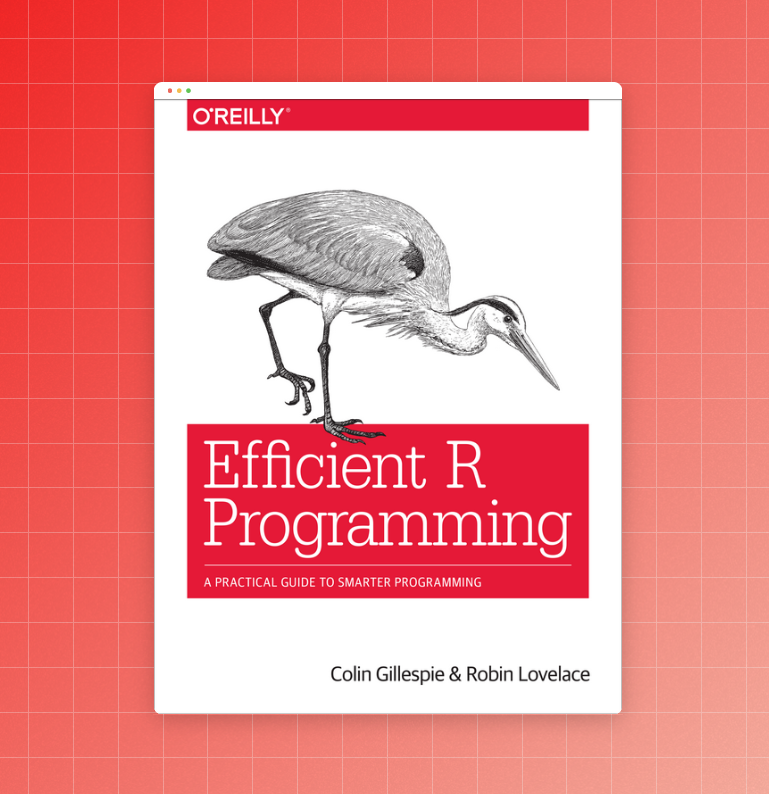
🚀 Want to write faster and more efficient R code?
Check out Efficient R Programming — a practical guide packed with tips on writing clean, optimized, and production-ready R code.
🔗 csgillespie.github.io/effici…
#rstats #DataScience #Rprogramming #Productivity
24
108
4,889
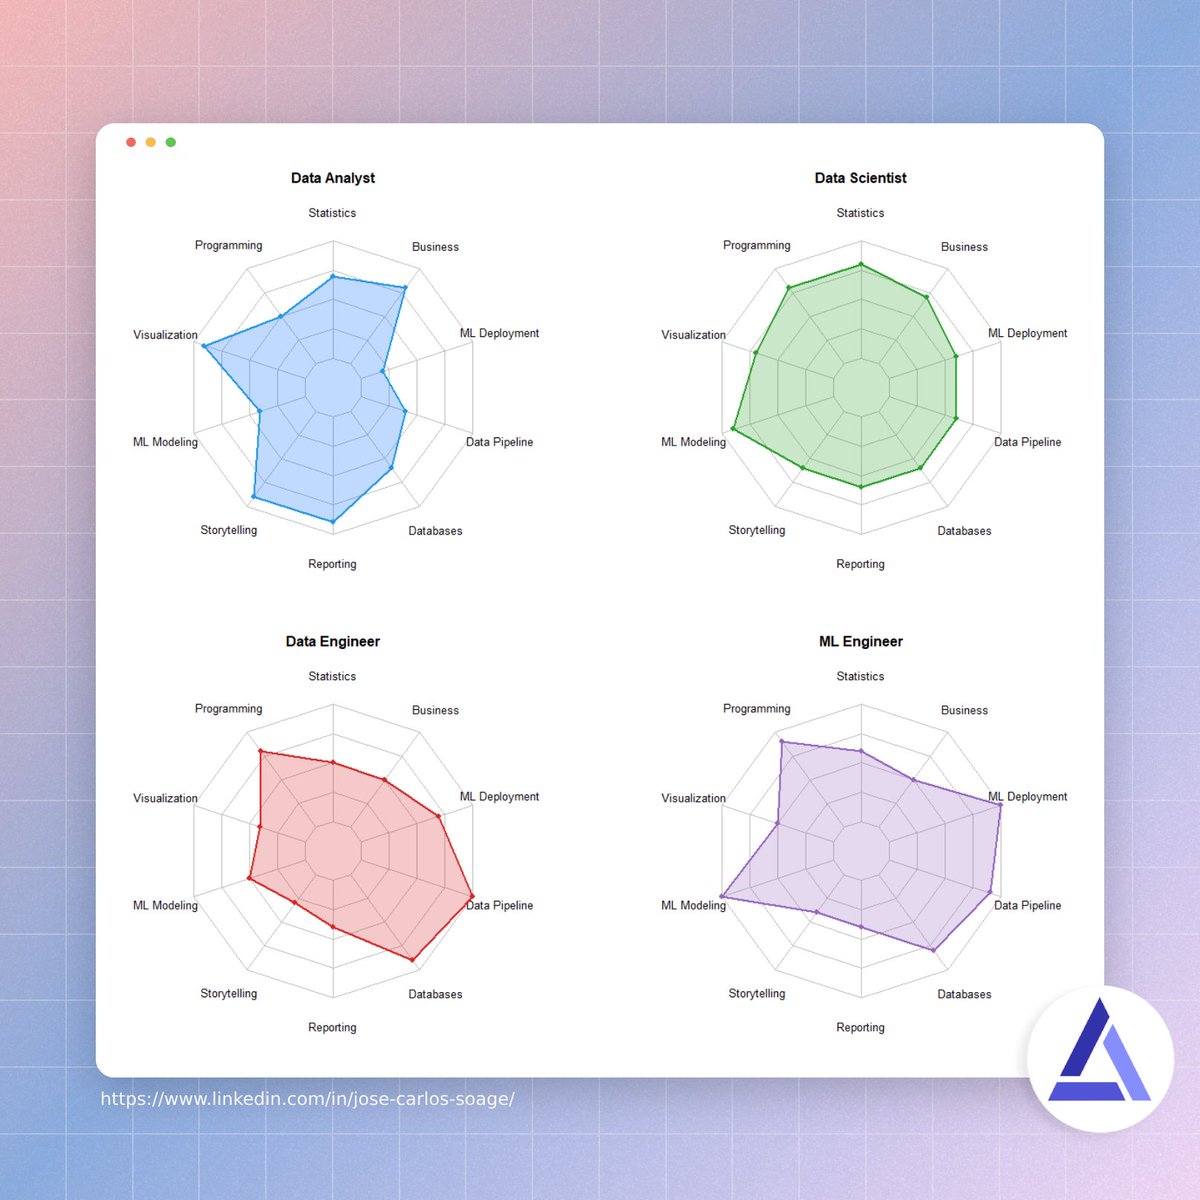
R CODER | Jose Carlos Soage 📊 retweeted
6 May 2025
🎯 Ever wondered what really sets apart a Data Analyst, Data Scientist, Data Engineer, and ML Engineer?
They might sound similar, but each role has a different focus, skill set, and mission
Let’s break it down 🧵👇
#DataScience #rstats #Statistics
1
1
4
670
6 May 2025
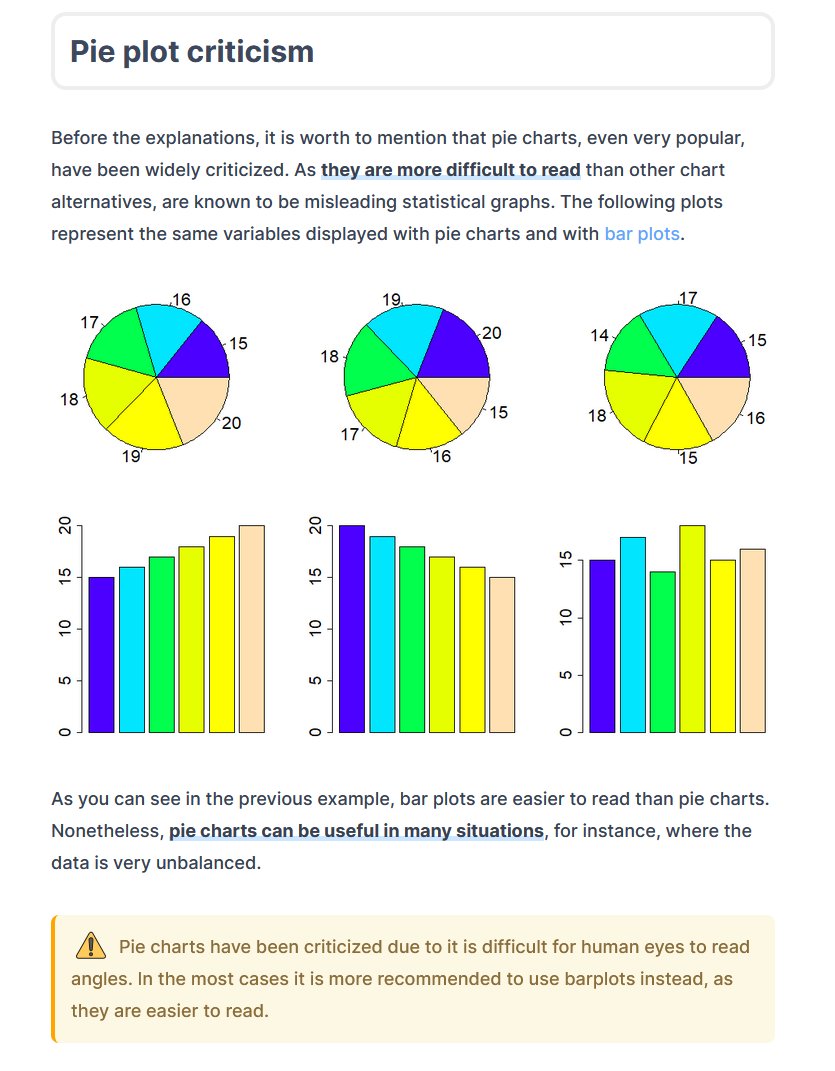
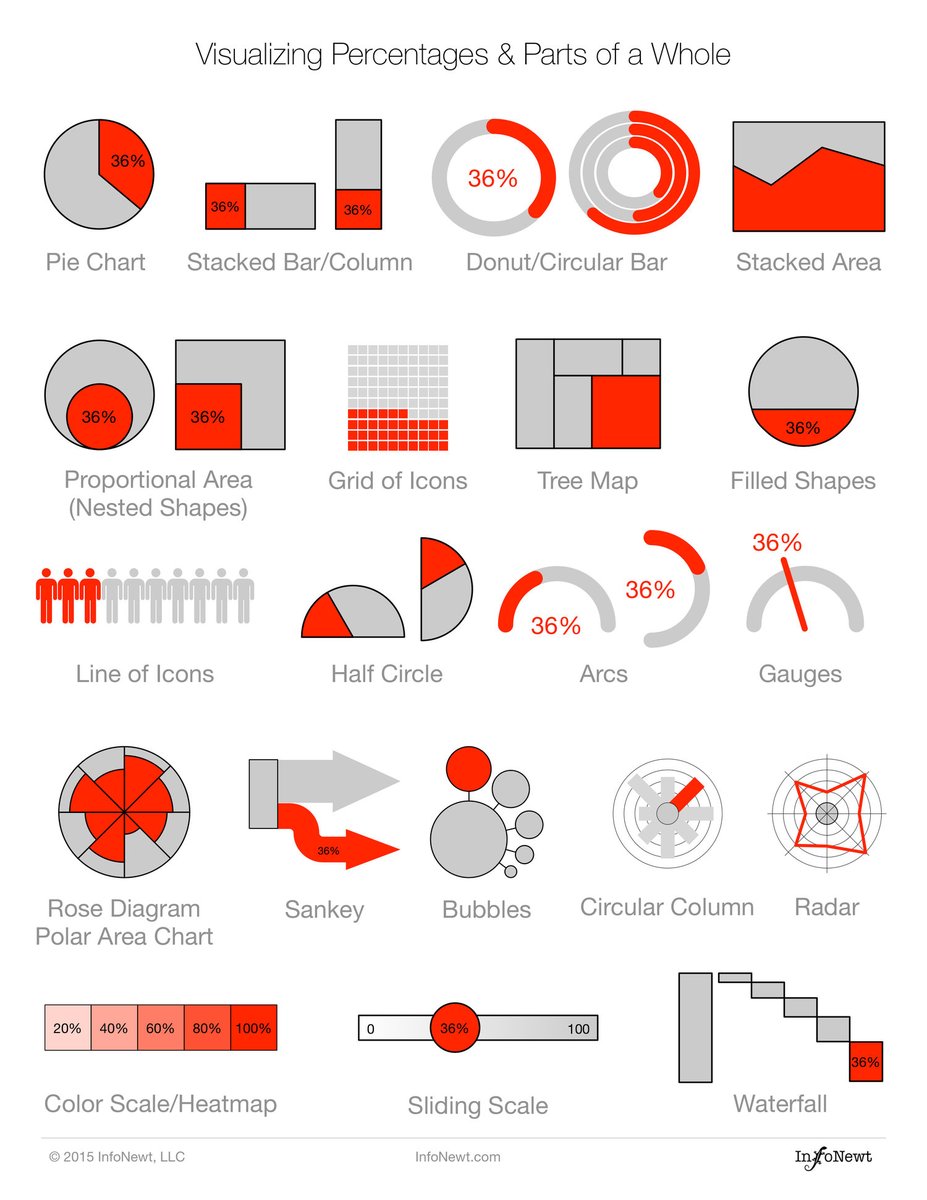
Found a great cheatsheet with different ways to visualize percentages and parts of a whole 📊
(Pie charts are just the beginning…)
And if you work in R, I’ve gathered real code examples here:
🔗 r-charts.com/part-whole/
#rstats #DataViz #ggplot2 #DataScience
24
158
6,507
6 May 2025
👋 If you enjoy the R content I share here, you might also like what I post on my (new) personal account: data science, AI, and entrepreneurship
Follow me at 👉 [@josecarlossoage ]
Or on LinkedIn (in Spanish) 👉 linkedin.com/in/jose-carlos-…
#rstats #datascience
1
3
500
16 Apr 2025
🦸♂️ Meet the newest superhero in town — Captain R!
Fighting messy data, one line of code at a time 💪📊
Powered by tidyverse. Shielded by ggplot2
#rstats #DataScience #SuperCoder
1
9
79
3,501
19 Mar 2025
[FREE R BOOK]
🚀 "Tidy Modeling with R" by Max Kuhn & Julia Silge is a must-read! 📘 Learn how to streamline your ML workflow using the tidymodels framework
🔗 tmwr.org/
#RStats #MachineLearning
1
25
138
5,221
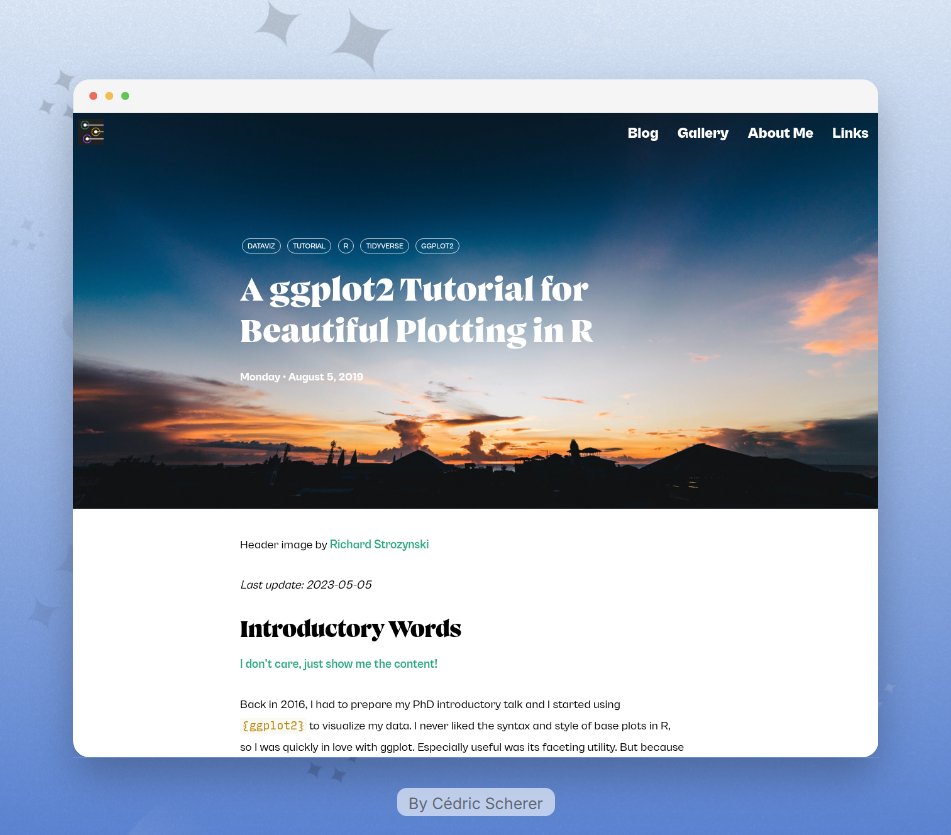
18 Mar 2025
🚀 This #ggplot2 tutorial by @CedScherer never gets old!
📊 One of the best resources to master beautiful plotting in R
🔗 cedricscherer.netlify.app/20…
26
108
4,530
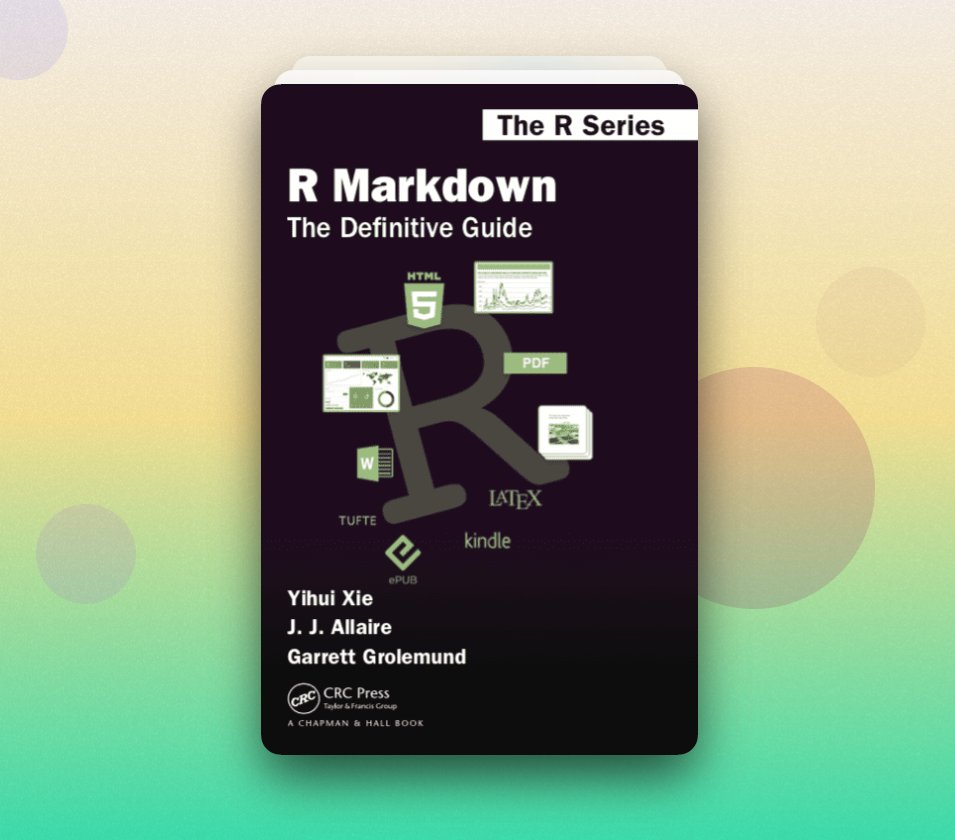
17 Mar 2025
[FREE ONLINE BOOK] 📗
R Markdown: The Definitive Guide
Learn how to create dynamic reports, presentations, and interactive documents with R Markdown!
🔗 bookdown.org/yihui/rmarkdown…
#rstats #DataScience
29
121
5,193
R CODER | Jose Carlos Soage 📊 retweeted

9 Mar 2025
I've been trying out different ways of creating dumbbell charts with {ggplot2}. For this one I used a 'wide' summary table for the source data (which feels more intuitive to me). The method owes a lot to this tutorial from @RCoderWeb:
r-charts.com/distribution/du…
#rstats #ggplot2
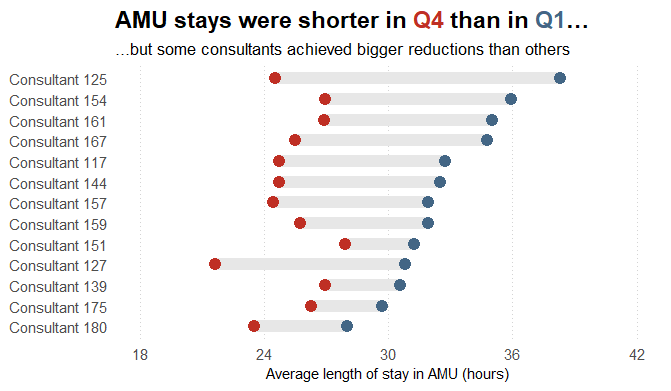
ALT A dumbbell chart that shows reductions in average length of stay in an Acute Medical Unit (AMU) separately for 13 consultants. All consultants achieved reductions, but some reductions were bigger than others.
1
3
21
2,092
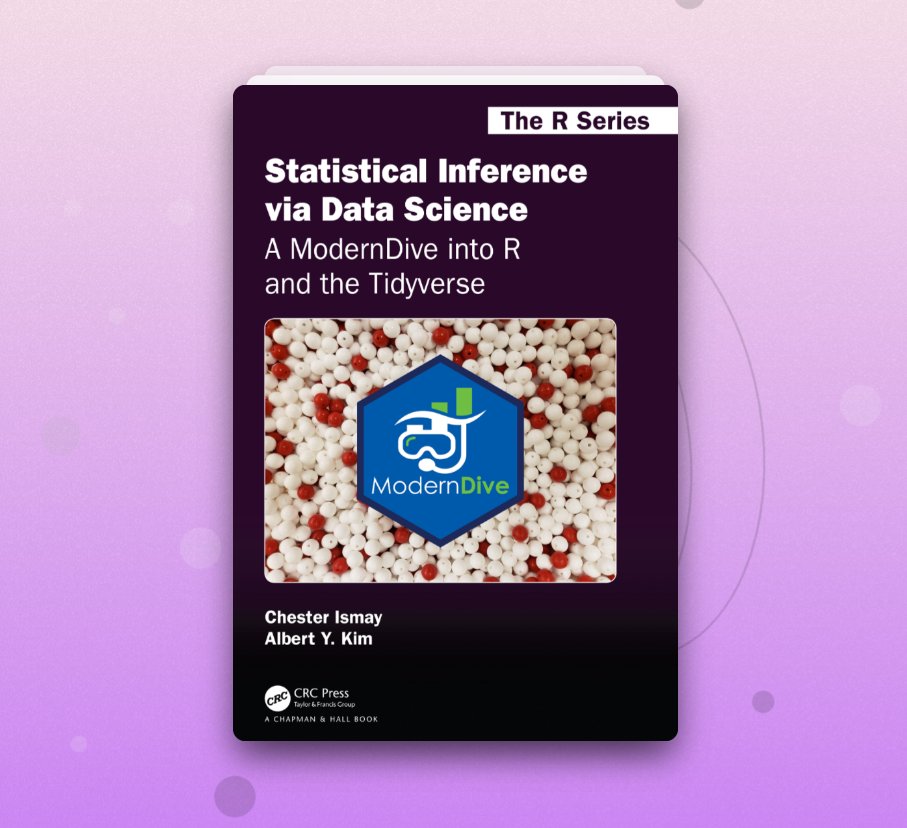
25 Feb 2025
[FREE BOOK]
Statistical Inference via Data Science: A ModernDive into R and the Tidyverse
Written by Chester Ismay and Albert Y. Kim
🔗 moderndive.com/
1
15
59
3,194
24 Feb 2025
> R-PACKAGES.IO
The easiest way to discover and search the documentation of all CRAN packages
26
118
5,663
14 Feb 2025
🌍📊 Geocomputation with R is a free online book that covers everything from spatial data handling to advanced GIS analysis using R! 🚀📌
Check it out here: r.geocompx.org/
#RStats #GIS #Geocomputation
34
152
6,875