
Easy Charting and Analysis. Simple but Powerful Software & Knowledge for Lean Six Sigma and Quality Professionals.
Joined March 2020
- Tweets 622
- Following 8
- Followers 57
- Likes 1
604 Photos and videos


Is your quality culture built on a few experts — or on everyone understanding variation?
In 1939, Walter Shewhart argued the future of quality wouldn't rest on expert statisticians, but on engineers who all think in terms of variation. Still true.
#SPCforExcel #ControlCharts
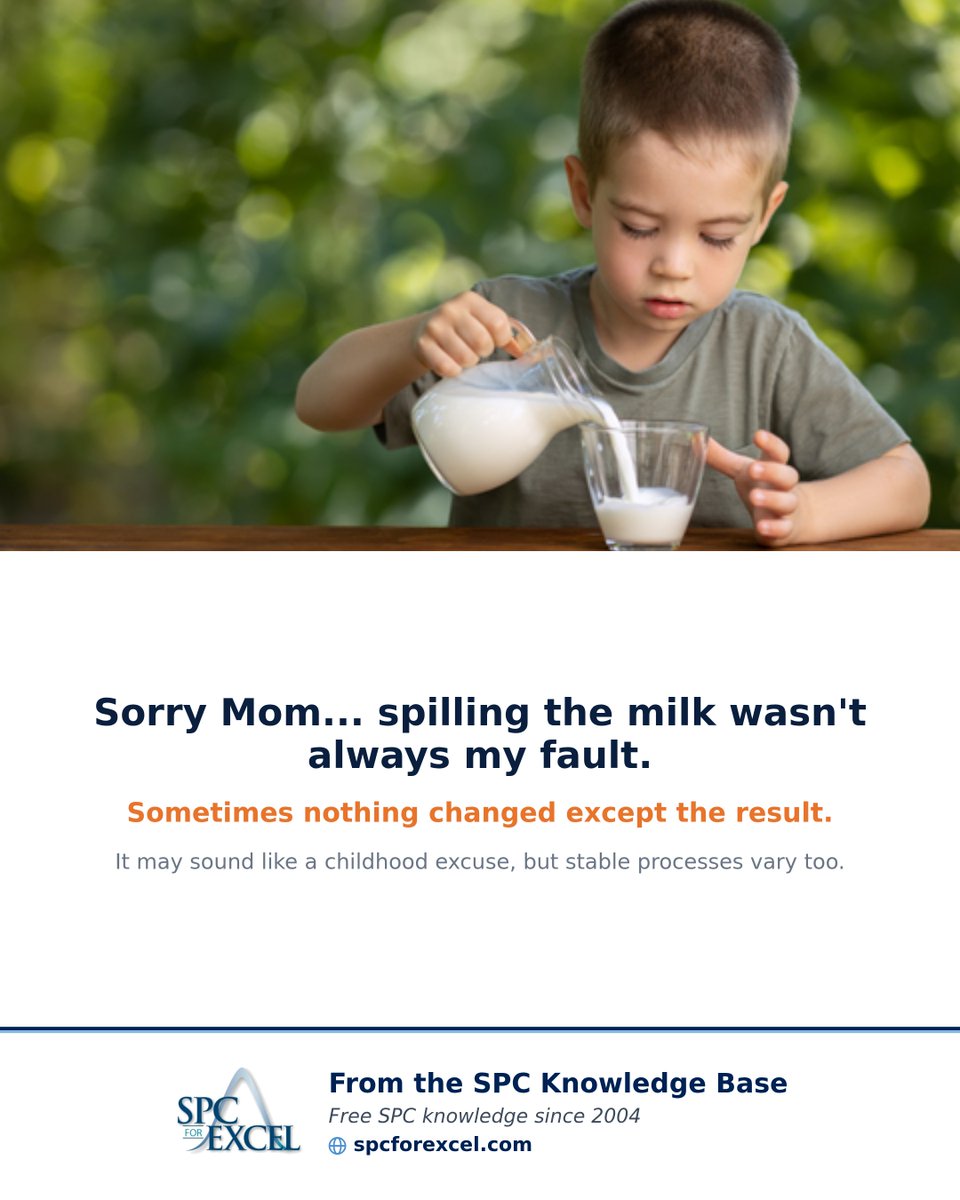
This popular article explores why stable processes can produce surprisingly different results — and why recreating control charts each month may lead to misleading conclusions.
Read here:
spcforexcel.com/knowledge/va…
#SPC #Variation #ControlCharts #LeanSixSigma #SPCforExcel
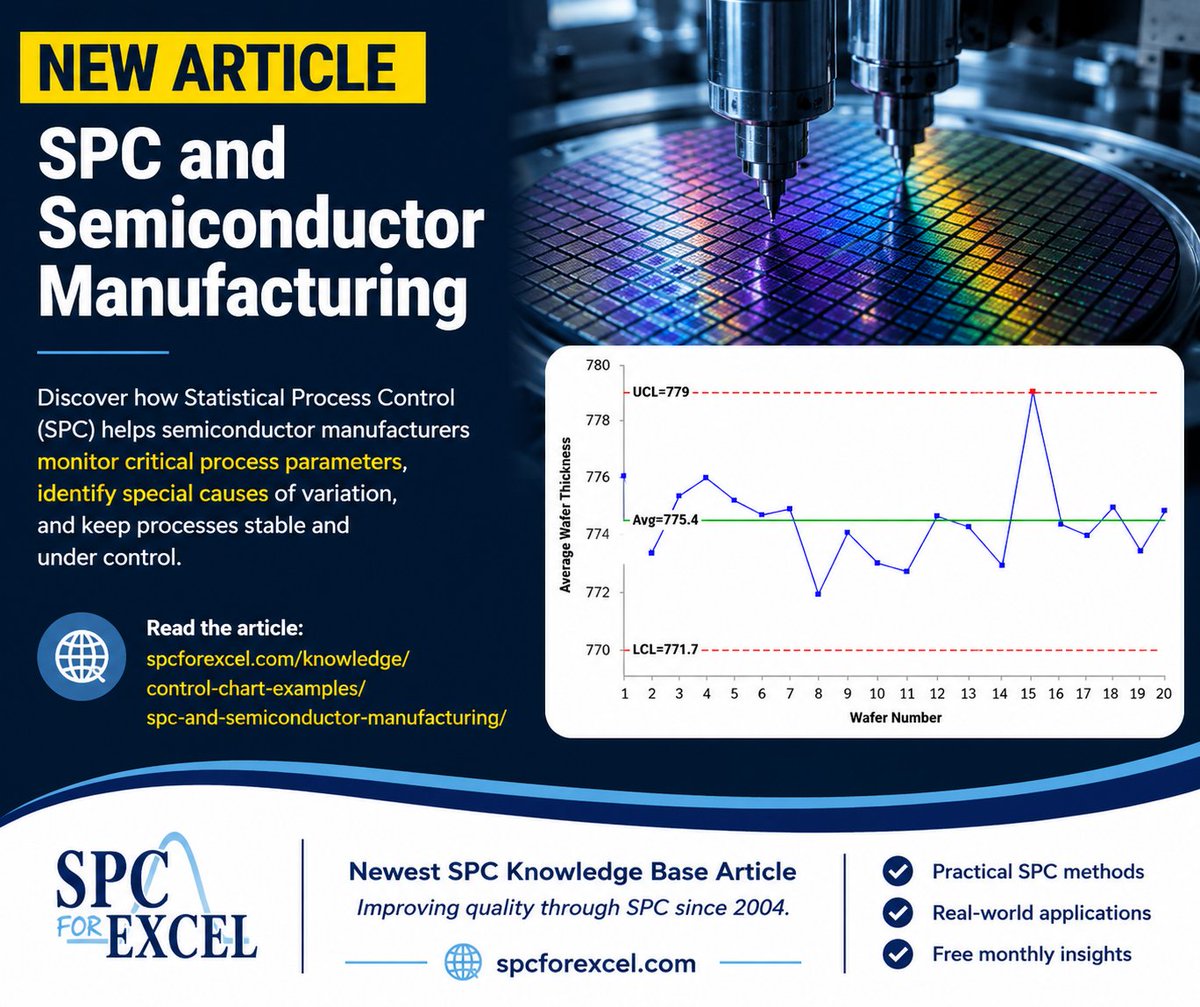
Explore here how Statistical Process Control (SPC) can help semiconductor manufacturers monitor critical process parameters, identify special causes of variation, and maintain process stability.
Read the article:
spcforexcel.com/knowledge/co…
#SPCforExcel #SemiconductorManufacturing
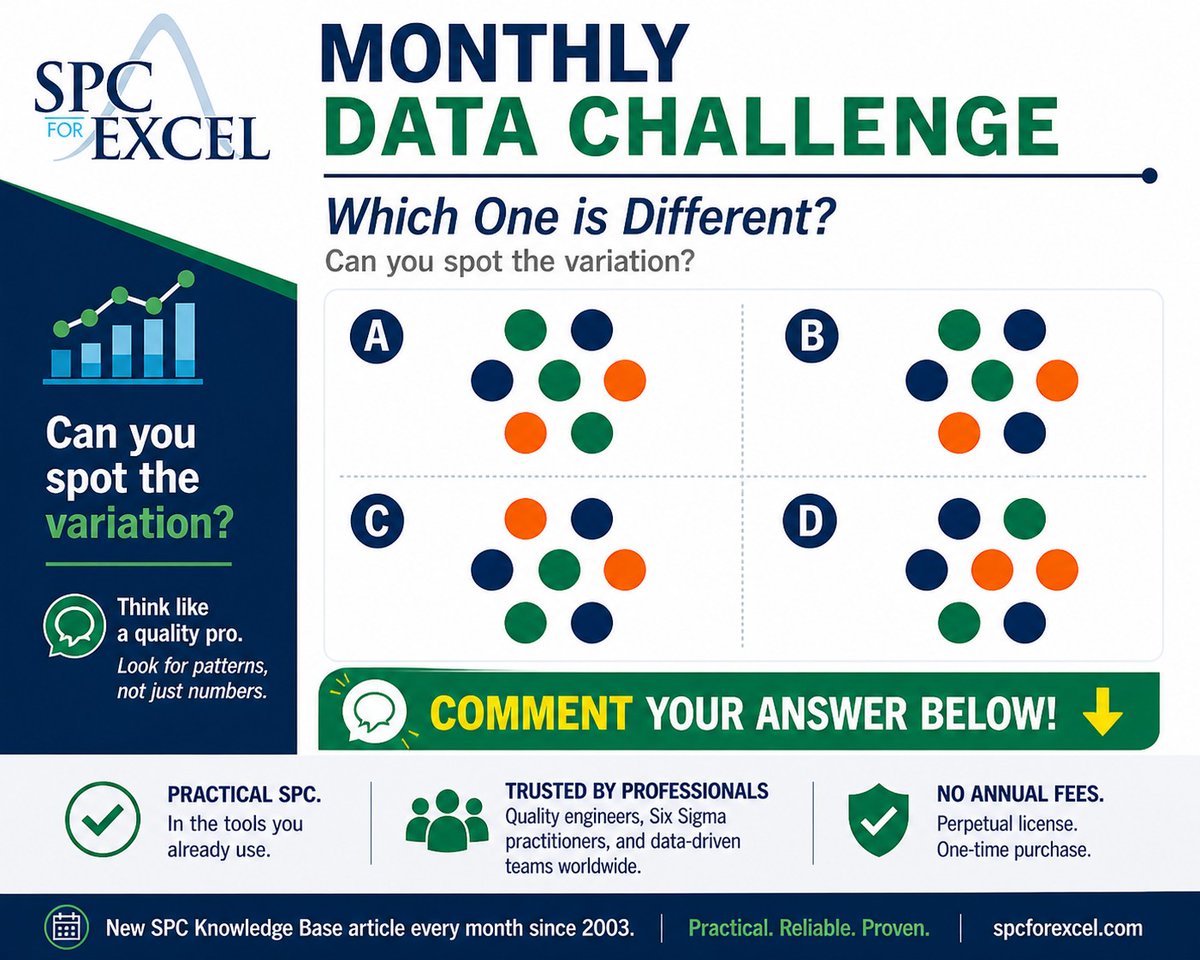
Variation is the clue. Can you find it?
This month’s data challenge:
Four groups of data points. One is different.
Can you spot the variation?
Look closely — it’s not about the numbers, it’s about the pattern.
👇 Comment below (A, B, C, or D) and what you see.
#SPCforExcel
2
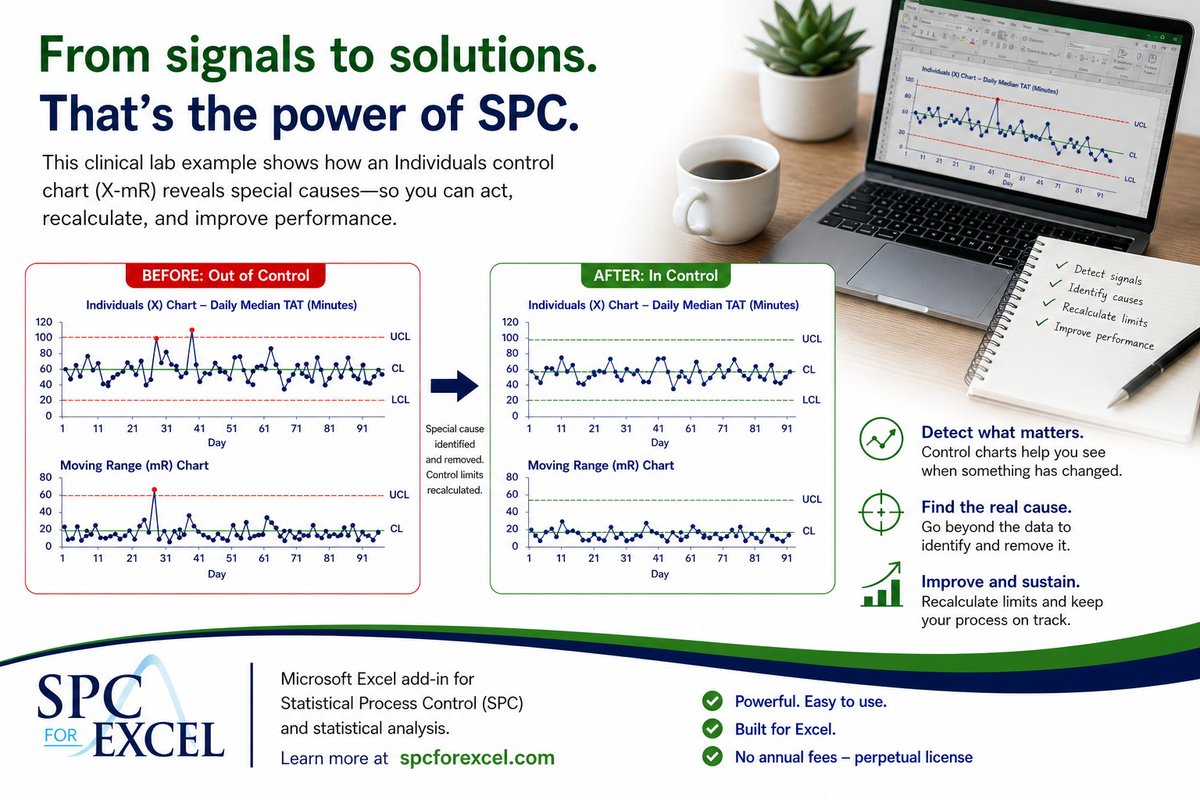
Out-of-control points aren’t the problem. Ignoring them is.
This clinical lab example shows how one signal led to real process improvement using an X-mR chart.
Still time to catch up:
spcforexcel.com/knowledge/co…
#SPCforExcel #StatisticalProcessControl #XmRChart #DataDriven
2
Curiosity drives improvement. In SPC and quality, that curiosity shows up as one question: “What is really causing this?” When you stay curious long enough to understand variation, better decisions follow.
#SPCforExcel #RootCause #Quality #ContinuousImprovement #DataDriven
3
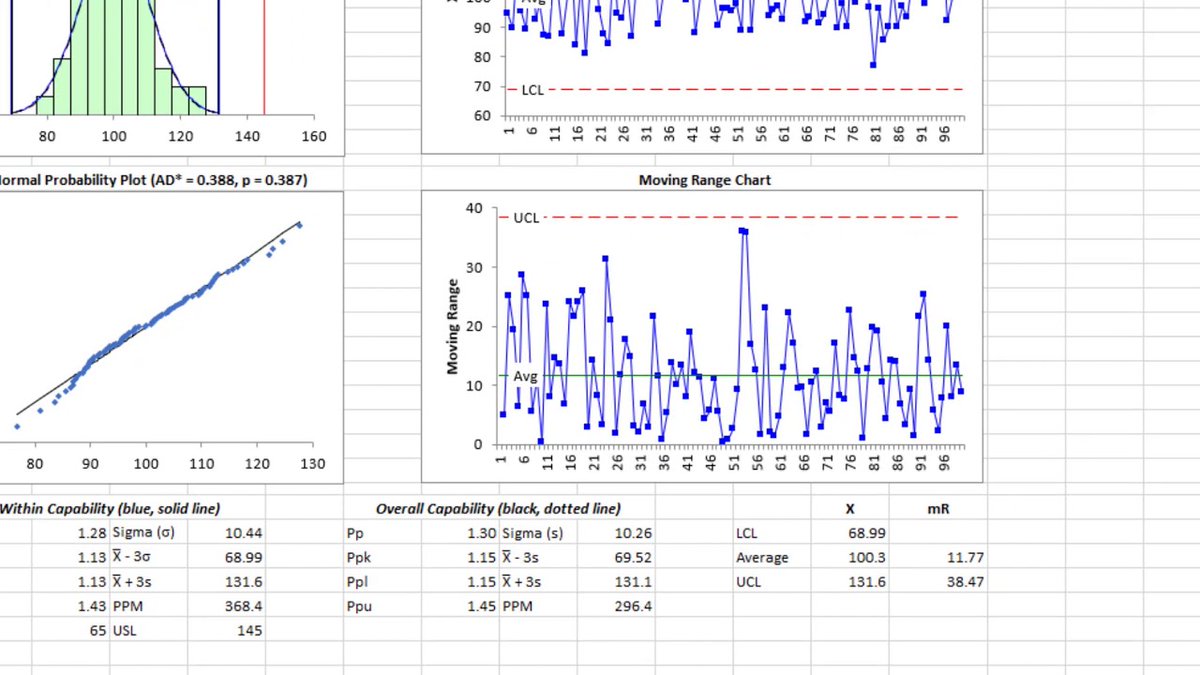
Doing capability analysis in Excel—but not seeing the full picture?
A Process Capability Snapshot puts everything in one view:
Cpk/Ppk, control charts, probability plot metrics.
👉 youtu.be/iCUKhGcTLok
#SPCforExcel #SixSigma #Quality #ProcessCapability
5
When you focus on helping your team succeed:
✔ Processes improve
✔ Variation is understood
✔ Results follow
That’s the spirit of Kaizen — continuous improvement through people.
#SPCforExcel
11
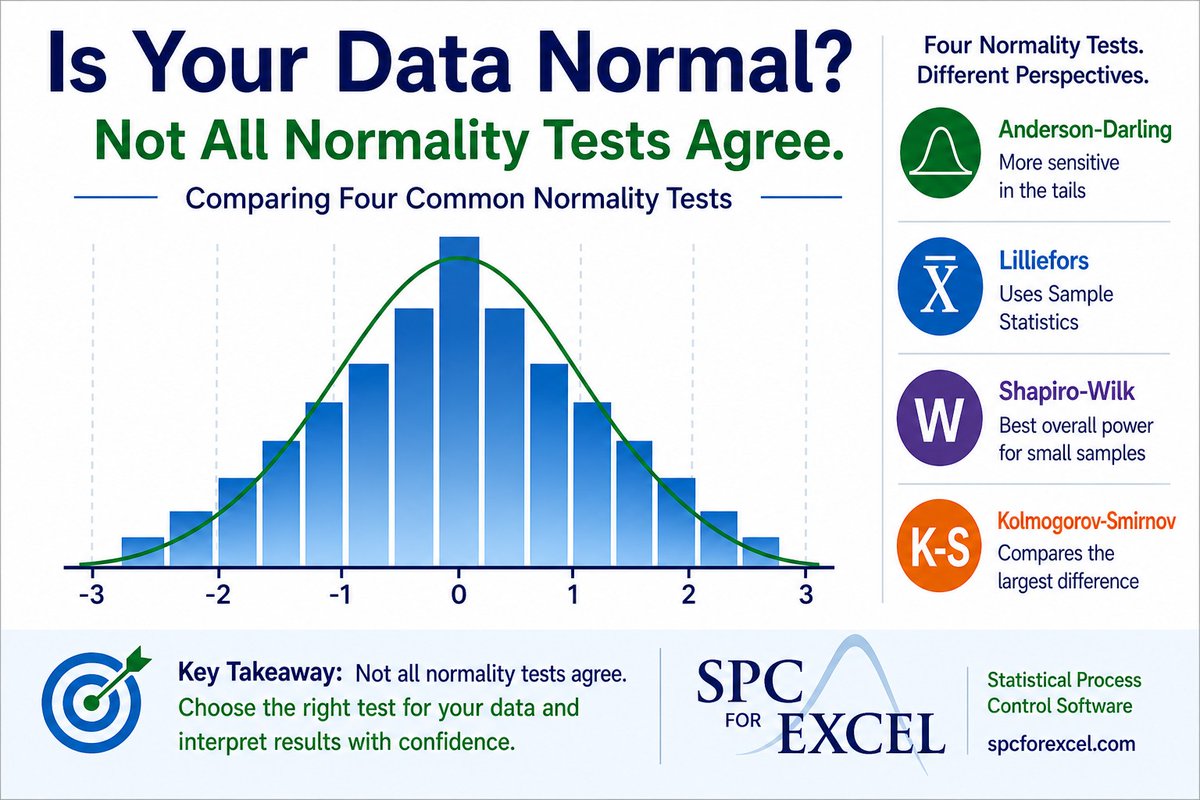
Is your data normal?
Different normality tests can give different answers—especially with small samples.
This article compares 4 common tests and why it matters 👇
spcforexcel.com/knowledge/ba…
#SPCforExcel #Statistics #DataAnalysis
2
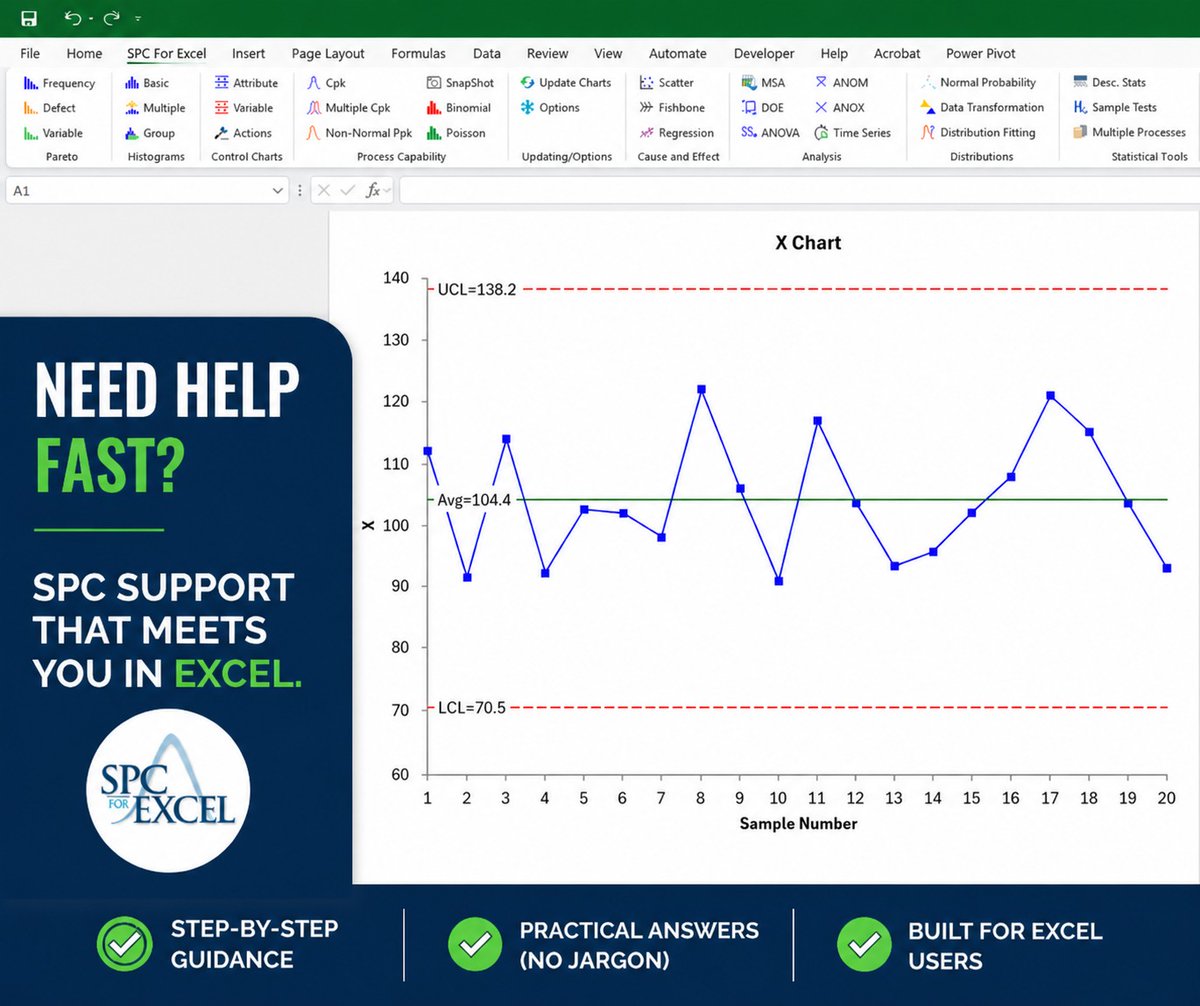
Struggling to get quick answers when working with your data in Excel?
👉 spcforexcel.com/support/
✔ Step-by-step guidance
✔ Practical answers (no statistical jargon)
✔ Built for the way you already work—in Excel
#QualityImprovement #SixSigma #DataAnalysis #SPCforExcel
1
Most clinical labs are reacting to noise—and don’t know it.
An X-mR chart helps you separate routine variation from real signals in turnaround time.
See how it works:
spcforexcel.com/knowledge/co…
#SPCforExcel #SPC #XmRChart #HealthcareQuality
5
Better tools ≠ better results.
Better thinking does.
The right tools help you:
See patterns
Ask better questions
Make smarter decisions
That’s where improvement starts.
#Leadership #ContinuousImprovement #SPCforExcel
1
You don’t judge a baseball player by one at-bat.
So why judge your process by one result?
Variation is normal.
SPC helps you:
• Stop overreacting
• See real patterns
• Act at the right time
Read more:
spcforexcel.com/knowledge/co…
#SPC #Quality #Lean #OperationalExcellence
13
Quick brain teaser 👇
This one looks easy… but it has two solutions.
What do you get for the last equation?
Share your answer 😊
#BrainTeaser #Math #ProblemSolving #SPCforExcelSoftware
5
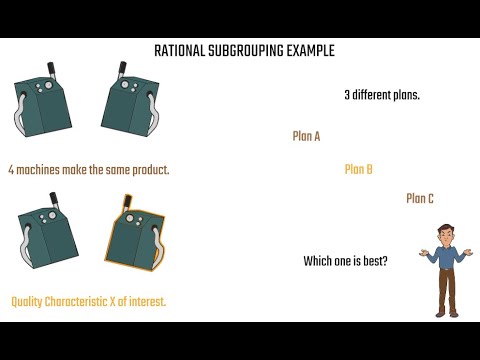
Are your control charts misleading you?
It might be your subgrouping.
✔ Min variation within subgroups
✔ Max variation between subgroups
This video shows 3 examples of how to do it right 👇
youtu.be/bvu8mAYyInU
#SPCforExcel #Quality #ProcessImprovement #RationalSubGrouping
Need practical SPC guidance?
We’ve built a knowledge base with 250 articles over 20 years — all focused on real-world application.
No fluff. Just useful SPC.
Start here 👇
spcforexcel.com/spc-for-exce…
#SPCforExcel #Quality #ProcessImprovement
2
If your control chart looks “off”…
It might not be the data — it might be your subgrouping.
Rational subgrouping is one of the most misunderstood parts of SPC — and one of the most important.
Learn more 👇
spcforexcel.com/knowledge/ra…
#RationalSubGrouping #SPCforExcel

3
SPC isn’t about charts giving answers.
It’s about helping you ask better questions:
Common cause or special cause?
Signal or noise?
Better questions → Better decisions.
#SPCforExcel #Quality #ContinuousImprovement

1
The New York Yankees opened the 2026 season with a 7–0 win over the San Francisco Giants.
But baseball is more than scores — it’s data over time.
That’s where SPC comes in.
See how control charts apply to:
spcforexcel.com/knowledge/co…
#SPC #Baseball #Quality #ContinuousImprovement

22
SPC isn’t about complex math.
It’s about:
• Understanding variation
• Knowing common vs. special causes
• Using control charts correctly
• Responding properly
Full article:
spcforexcel.com/knowledge/co…
#SPC #Quality #OperationalExcellence #Lean #SPCforExcel
7