
Joined February 2024
- Tweets 3,207
- Following 50
- Followers 900
- Likes 1,760
2,597 Photos and videos


23 Nov 2025
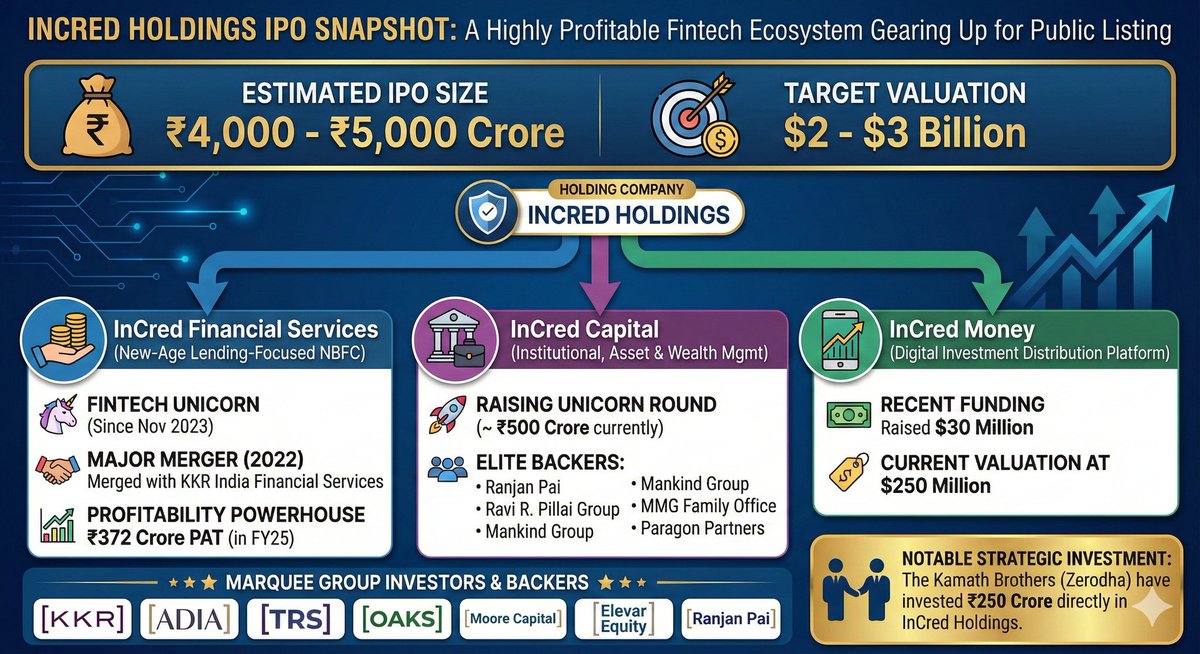
InCred Holdings Limited Files DRHP With SEBI via Confidential Route
The IPO Size is Likely to be 4,000-5,000 Crore
156
21 Nov 2025
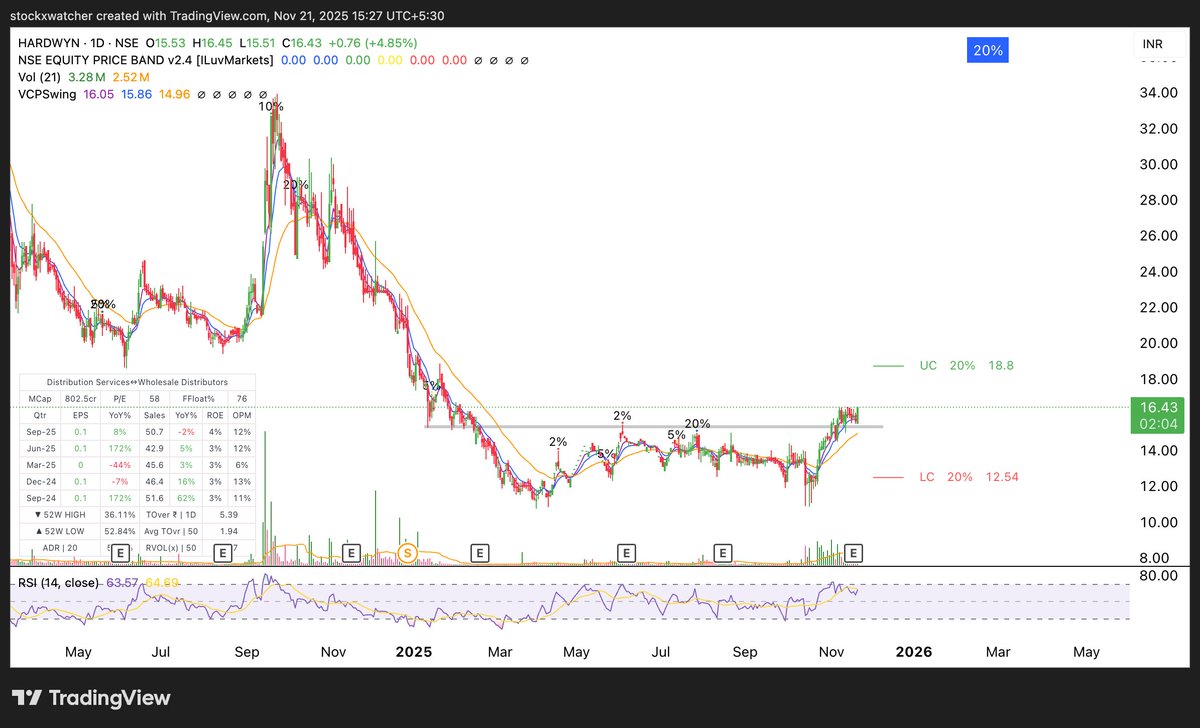
#HARDWYN
Hardwyn Doing Base Breakout with Volume keep Eyes on this For Play For Movement
CMP 16.44
2
202
20 Nov 2025
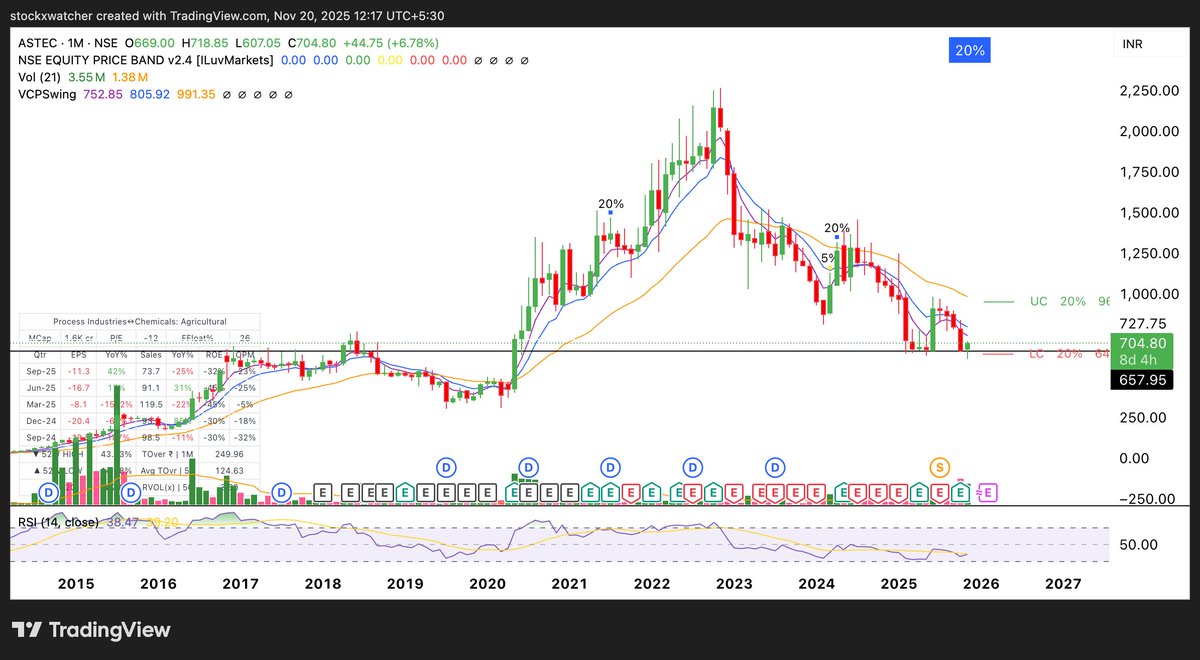
#ASTEC Technical View (Monthly)
Stock testing long-term support zone around ₹660–700 after a multi-year downtrend.
Hold above ₹660 = strength
Breakout above ₹750 = trend reversal signal
Falling volumes = exhaustion selling
#Stocks #ASTEC #TechnicalAnalysis #SwingTrading
1
550
22 Sep 2025
Upcoming SME IPO to Watch
Here is List of All Upcoming SME IPO That Have
potential future growth engines worth tracking.
#SME #IPO #IndiaInvesting #DalalStreet #StockMarketIndia
1
151
17 Sep 2025
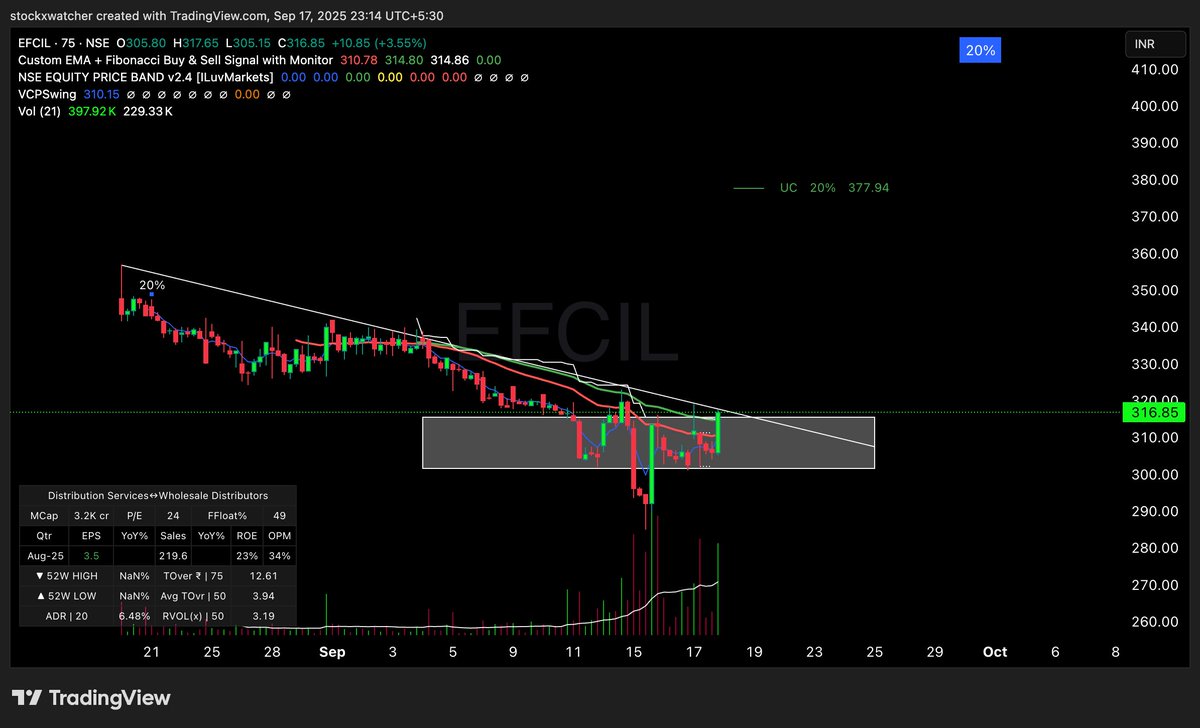
#EFCIL –
🔹 Daily Time Frame (NSE)
Stock got listed recently and faced selling pressure post listing.
Now forming a base near ₹300 → acting as strong swing support.
Daily chart indicates that ₹300 zone is being defended, showing buyers absorption.
CMP 314
1
1
629
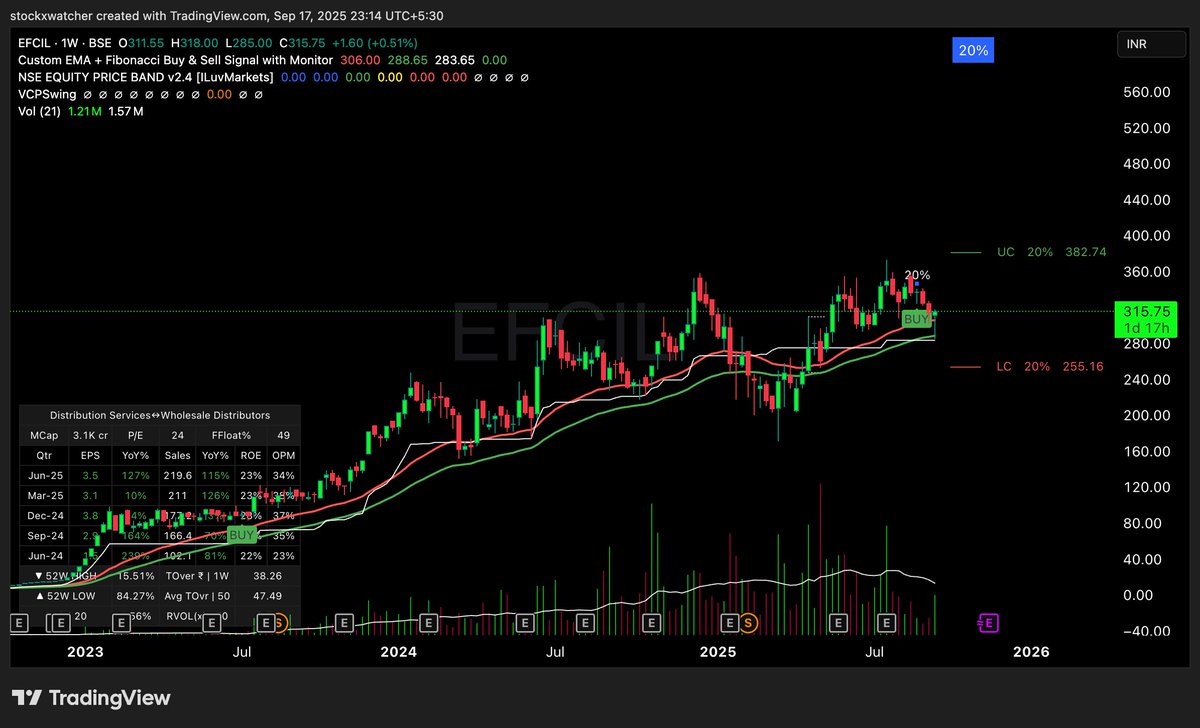
17 Sep 2025
Weekly chart gives the fuller picture → Stock is taking strong support at 30 EMA (green) & 50 EMA (red).
This EMA confluence is very important for mid-term trend → indicates underlying strength.
Price holding above EMAs after selling → confirms that weakness is temporary
1
107
17 Sep 2025
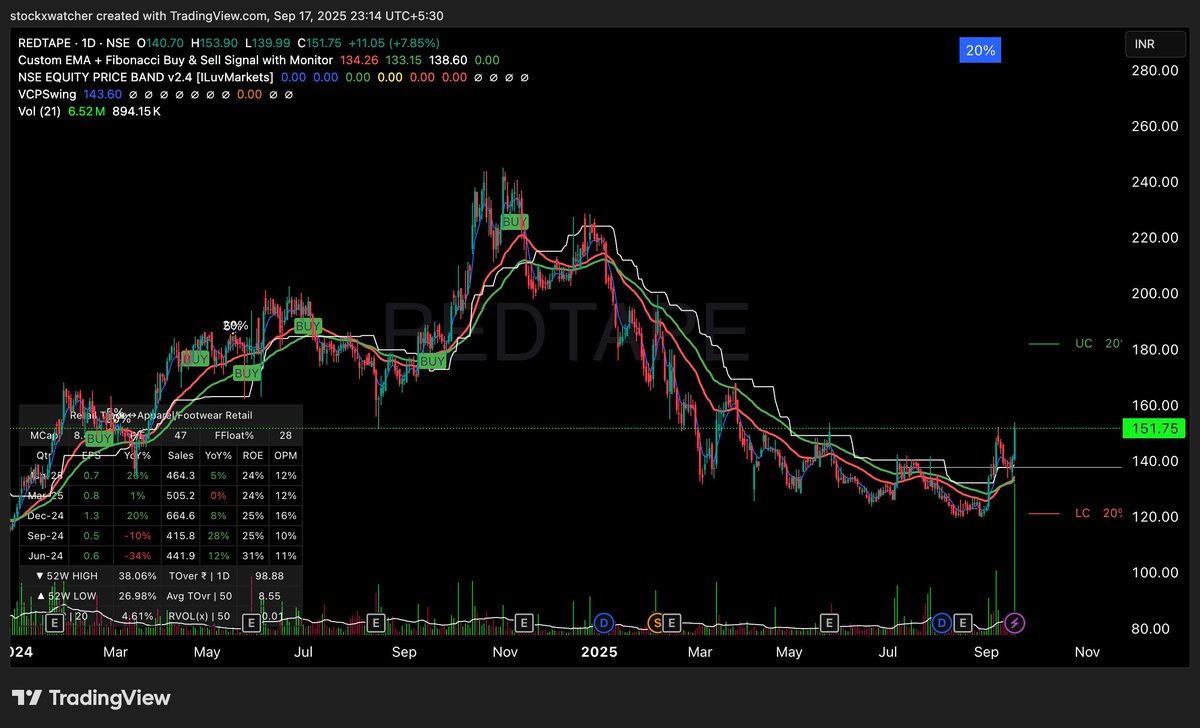
#Redtape
Stock has completed a good consolidation phase and is now showing reversal signs on chart.
Strong volume candle with price breakout → clear sign of accumulation & momentum shift.
Supported by good quarterly results, giving fundamental backing to the move.
CMP 151
1
281
17 Sep 2025
#KPIT Tech
Stock is taking strong support at 30 EMA (green) & 50 EMA (red) → trend intact.
Holding well at 0.555 Fib level, confirming demand zone.
Price is attempting to break out of the Downtrend Line (DTL) → bullish
CMP 1296
#BREAKOUTSTOCKS #stocktowatch

2
484
17 Sep 2025
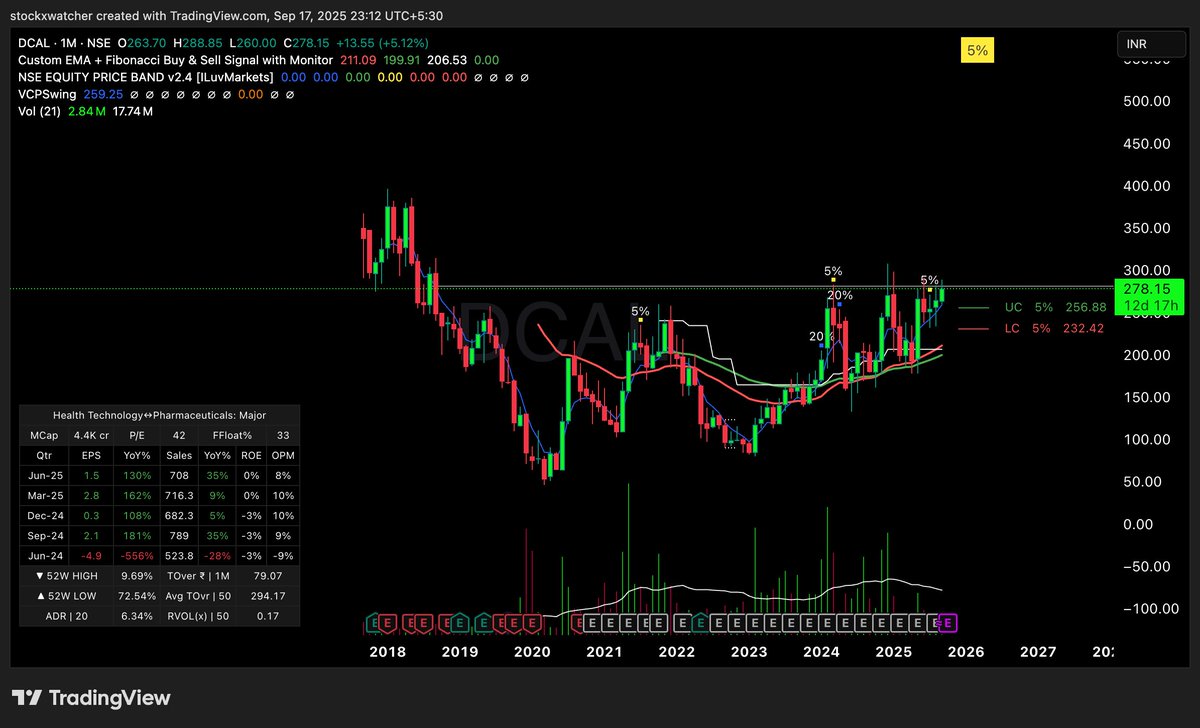
#DCAL – Technical View
is in a strong uptrend above EMAs, with the 0.555 Fib acting as a reliable support. Looking Good By Driven Good Result and Also Stock Done Good Consolidation
CMP 278
#BREAKOUTSTOCKS #stocktowatch
2
361
17 Sep 2025
☁️ IT & Cloud Infra
➡️ E2E Networks – Cloud Hosting
➡️ Aurion Pro – Cybersecurity & Infra
➡️ Blackbox – IT Solutions
#E2ENetworks #AurionPro #Blackbox
1
3
918
17 Sep 2025
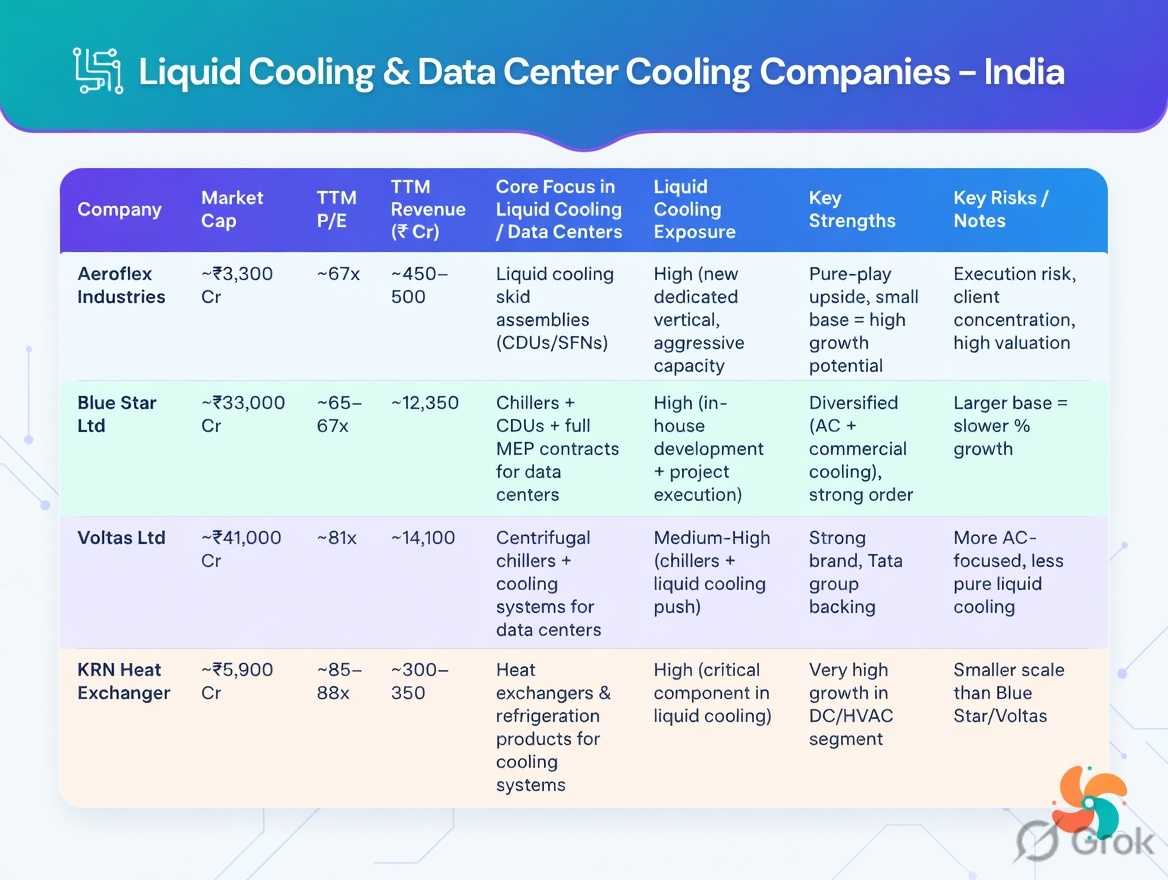
❄️ Cooling & HVAC
➡️ Bluestar – Cooling Systems
➡️ KRN Heat Exchanger – Heat Mgmt.
🔋 Battery Backup & Generators
➡️ TD Power – Backup Generators
➡️ Amara Raja – Industrial Batteries
#Bluestar #KRNHeatExchanger #AmaraRaja
🚨 Note: DYOR
3
511