
Joined March 2026
- Tweets 114
- Following 121
- Followers 24
- Likes 1,284
9 Photos and videos


Great communities don't grow by chance
As a Community Moderator, I focus on:
• Keeping discussions engaging 🤝
• Helping members quickly ⚡
• Maintaining a positive environment 🛡️
• Supporting projects and their communities every day.
#CommunityManager #Moderator #Telegram
1
1
18
They grow through consistency, communication, and trust.
Always open to new moderation opportunities and collaborations.
Telegram: t.me/Swift_Mod
#CommunityManager #Moderator #Telegram #Web3 #CryptoCommunity #RemoteJobs
1
4
Swift Mod retweeted

Jun 4
Call it first. Claim what's yours.
Sign up and start at 60% cashback.
Shotgun.fun is coming to Solana.
June 9.
1,383
7,839
9,302
314,718
Swift Mod retweeted

Feb 27
Wondering if AI productivity gains are real? Here’s the tale of our big rewrite @zardotapp from the perspective of one of our engineers medium.com/p/b2fbea18d1eb
4
10
52
15,871
Swift Mod retweeted

Jun 7
Some things never lose their shine. solana:GoLDppdjB1vDTPSGxyMJFqdnj134yH6Prg9eqsGDiw6A now available in ZAR. 🟡
LBMA and UAE GD-certified gold, insured and independently verified by RSM.
Powered by @orogoldapp
27
26
133
15,441
Swift Mod retweeted
28 Oct 2025
ZAR has raised $12.9 million to bring ROCK. SOLID. DOLLARS. to the Global South 💵🌍
Led by @a16zcrypto, with @dragonfly_xyz, @vaneck_us, @cbVentures, and Endeavor Catalyst.
🧵👇
178
354
1,504
247,209
Swift Mod retweeted

Jun 4
someone defend grandpa bitcoin:native before he needs life support!!
1
1
52
Swift Mod retweeted
May 9
2026 job market:
doctor ❌
lawyer ❌
professional token deployer ✅
3
2
26
11,298
Swift Mod retweeted

Jun 4
Crypto Market Update - June 4
Market is clearly in risk-off mode today.
Major caps are down 4–6% in the last 24h:
$BTC: $63,970 -4.39%
$ETH: $1,787 -4.36%
$SOL: $70.42 -5.86%
$BNB: $604.95 -5.64%
BTC RSI is now around 21.8, which is deeply oversold. A short-term relief bounce is possible, but MACD remains negative and momentum is still weak.
ETH looks even more stretched with RSI near 19.9, showing stronger pressure across altcoins.
Key BTC levels:
- Support: $62K, then $60K
- Resistance: $66K, then $68K
My view: this is not the zone to panic, but also not the place to blindly buy the dip.
I want to see BTC hold the $60K–$62K area and reclaim momentum before calling a real reversal.
Risk management first.
Not financial advice.
1
1
141
Swift Mod retweeted
Jun 4
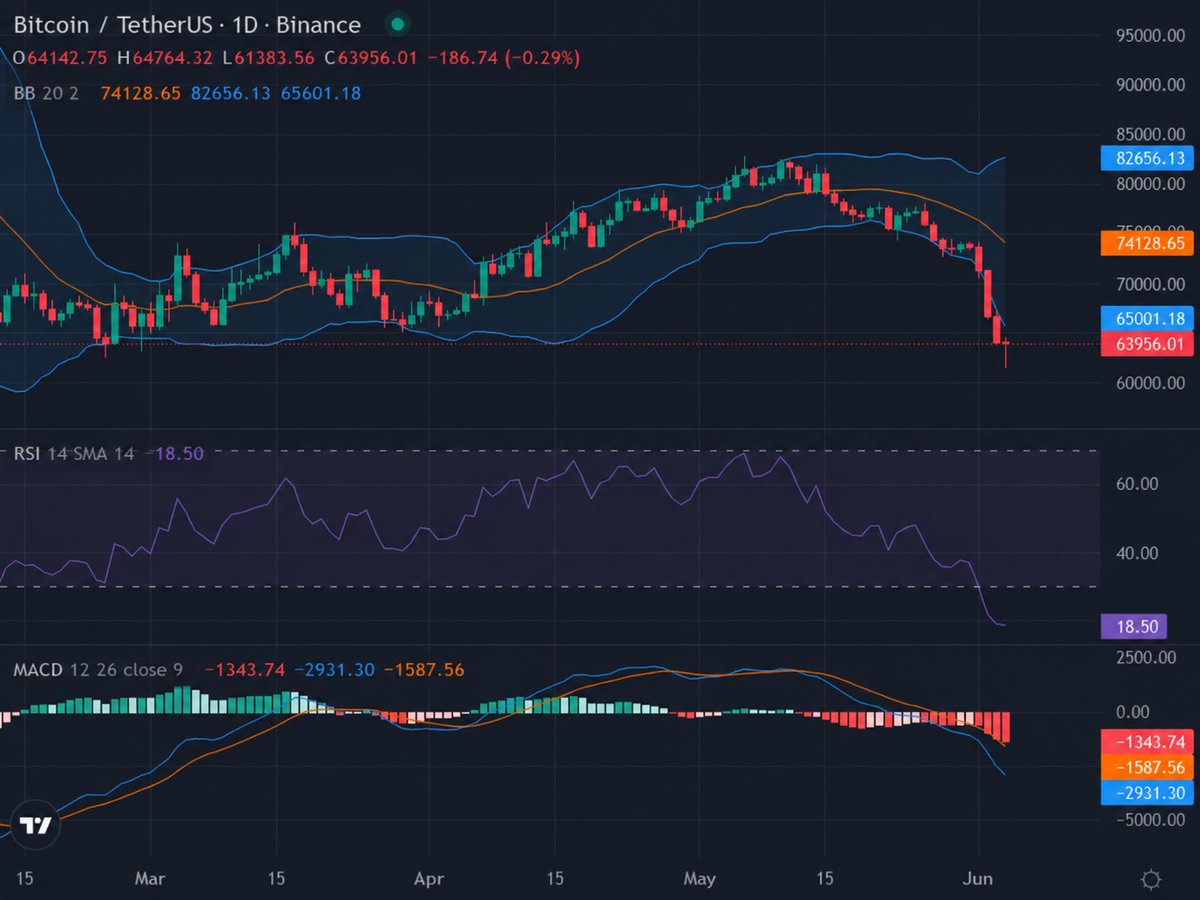
📊 Short-Term Market View - $BTC
- Current price: ~$62,979
- 24h: -5.42%
- Market cap: ~$1.26T
- 24h volume: ~$61B
$BTC is clearly in a strong selloff phase.
Price has dropped from the ~$77K–$79K zone in mid-May to below $63K, losing more than 18% from the recent high.
📐 Short-term technical signals: bearish
🔴 RSI: ~21.8
BTC is now deeply oversold. Selling pressure is extreme, but this also increases the chance of a technical bounce.
🔴 MACD: negative and widening around -1,875
Bearish momentum is still dominant. No clear reversal signal yet.
🔴 Bollinger Bands
Price is trading below the lower band near ~$69.4K, showing high volatility and an oversold move.
🔴 MA50: around ~$77K
BTC is far below the 50-day moving average, meaning the medium-term structure has turned negative.
Key levels to watch:
- Near support: $60,000
This is the major psychological level. If BTC loses it, the next downside zone could be $57K–$58K.
- Near resistance: $66K–$67K
BTC needs to reclaim this area to show early signs of buying pressure returning.
- Strong resistance: $69.4K
This is near the lower Bollinger Band. Above that, the next major level is the MA50 around $77K.
Summary:
The short-term trend remains bearish, and momentum is still weak.
However, RSI is deeply oversold and BTC is trading below the lower Bollinger Band, so a technical bounce over the next 1–3 sessions is possible.
To confirm stronger demand, BTC needs to reclaim $66K–$67K and push RSI back above 30.
If $60K breaks, the next leg lower could open quickly.
My view:
Risk management comes first.
Avoid catching a falling knife while MACD is still expanding to the downside.
Better to wait for confirmation than enter too early.
⚠️ Not financial advice. You are responsible for your own decisions.
Jun 4

Crypto Market Update - June 4
Market is clearly in risk-off mode today.
Major caps are down 4–6% in the last 24h:
$BTC: $63,970 -4.39%
$ETH: $1,787 -4.36%
$SOL: $70.42 -5.86%
$BNB: $604.95 -5.64%
BTC RSI is now around 21.8, which is deeply oversold. A short-term relief bounce is possible, but MACD remains negative and momentum is still weak.
ETH looks even more stretched with RSI near 19.9, showing stronger pressure across altcoins.
Key BTC levels:
- Support: $62K, then $60K
- Resistance: $66K, then $68K
My view: this is not the zone to panic, but also not the place to blindly buy the dip.
I want to see BTC hold the $60K–$62K area and reclaim momentum before calling a real reversal.
Risk management first.
Not financial advice.
1
1
111
Swift Mod retweeted
Jun 4
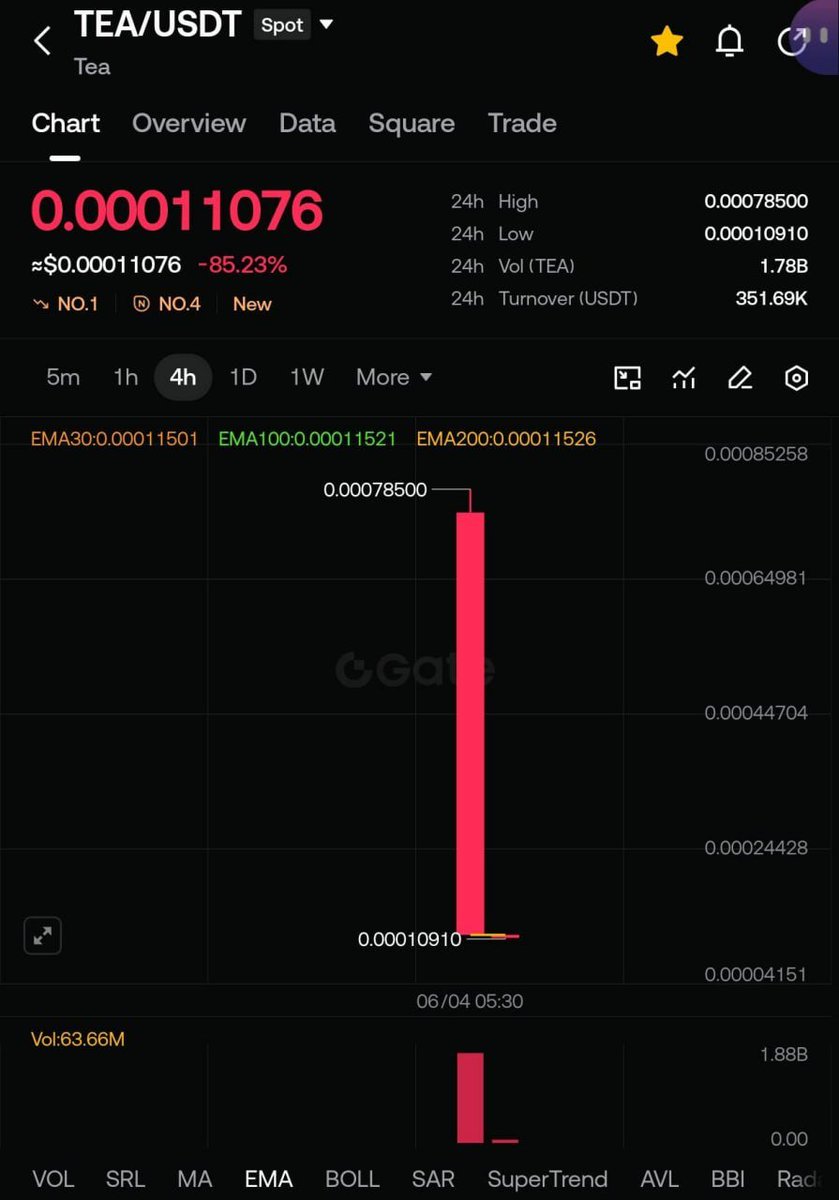
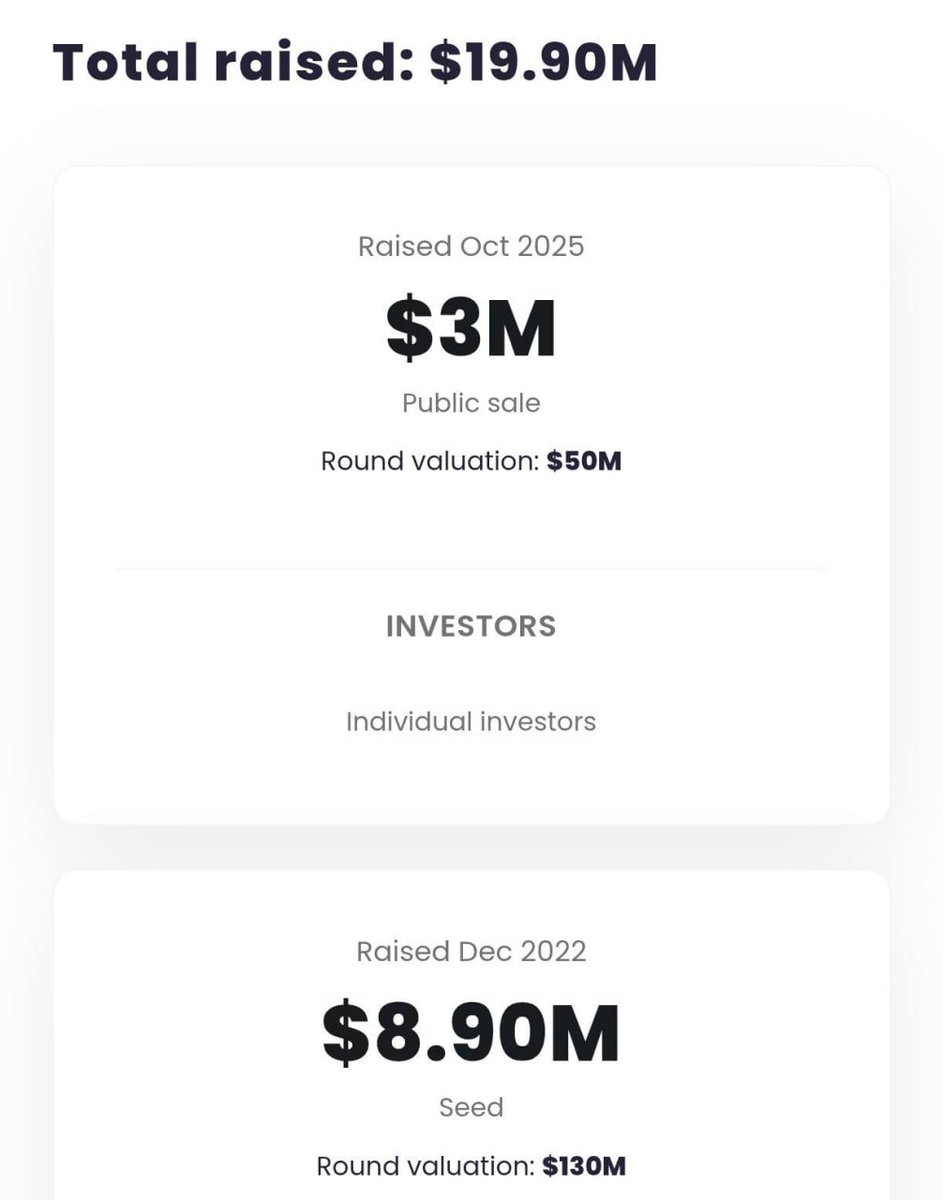
😩 CoinList really feels past its prime now.
They just hosted the Tea ICO, a project backed by YZi Labs, raising nearly $20M.
ICO price: $0.0005
Listing price: $0.0001
And it is still dumping.
What happened to the 2021 golden era?
Back then, buying a @CoinList ICO felt like winning a lottery ticket.
People were lining up just for a chance to get into projects that could do 50x or 100x.
Now we are getting listed below ICO price on day one 🥲
2
2
37
Swift Mod retweeted
Jun 4
🥲 Even @Cardano own founder seems tired of the project.
Charles Hoskinson appeared visibly exhausted during a recent livestream and admitted that Cardano is facing several major challenges, including governance issues, fundraising problems, and weak ecosystem activity.
Multiple treasury proposals have reportedly been rejected, which led to the cancellation of Cardano Summit 2026.
Charles also predicted that more DeFi protocols and projects could fail in the second half of 2026, especially as on-chain activity remains near record lows and builders continue cutting costs.
During the livestream, he also mentioned “taking a break,” raising speculation that Cardano’s founder may be considering stepping back temporarily.
For a project that once promised to build a better blockchain future, this is not exactly the kind of update holders wanted to hear.
⚠️ For informational purposes only. Not financial advice.
cardano:native

2
2
388
Swift Mod retweeted
Jun 4
time to activate the internal liquidity department?? 🐧
Jun 4
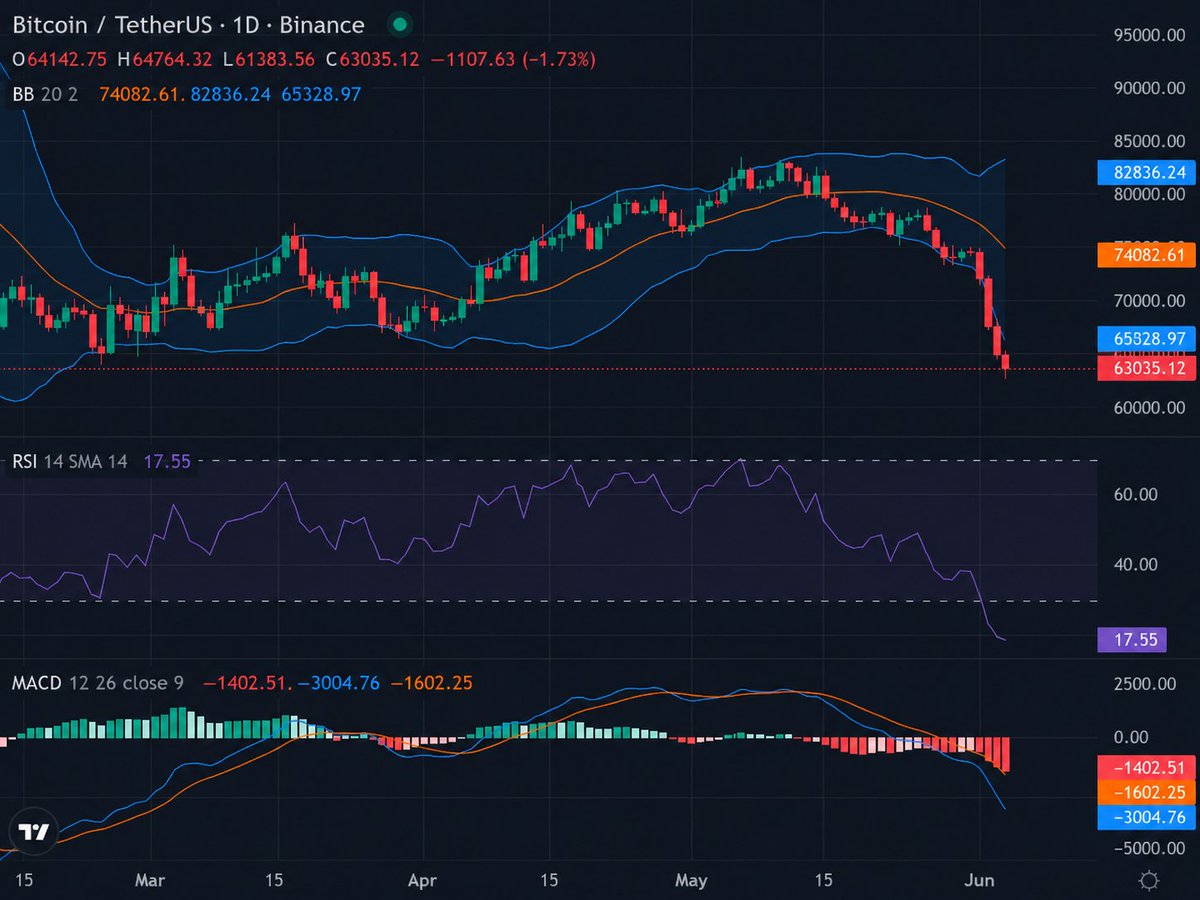
📊 Short-Term Market View - $BTC
- Current price: ~$62,979
- 24h: -5.42%
- Market cap: ~$1.26T
- 24h volume: ~$61B
$BTC is clearly in a strong selloff phase.
Price has dropped from the ~$77K–$79K zone in mid-May to below $63K, losing more than 18% from the recent high.
📐 Short-term technical signals: bearish
🔴 RSI: ~21.8
BTC is now deeply oversold. Selling pressure is extreme, but this also increases the chance of a technical bounce.
🔴 MACD: negative and widening around -1,875
Bearish momentum is still dominant. No clear reversal signal yet.
🔴 Bollinger Bands
Price is trading below the lower band near ~$69.4K, showing high volatility and an oversold move.
🔴 MA50: around ~$77K
BTC is far below the 50-day moving average, meaning the medium-term structure has turned negative.
Key levels to watch:
- Near support: $60,000
This is the major psychological level. If BTC loses it, the next downside zone could be $57K–$58K.
- Near resistance: $66K–$67K
BTC needs to reclaim this area to show early signs of buying pressure returning.
- Strong resistance: $69.4K
This is near the lower Bollinger Band. Above that, the next major level is the MA50 around $77K.
Summary:
The short-term trend remains bearish, and momentum is still weak.
However, RSI is deeply oversold and BTC is trading below the lower Bollinger Band, so a technical bounce over the next 1–3 sessions is possible.
To confirm stronger demand, BTC needs to reclaim $66K–$67K and push RSI back above 30.
If $60K breaks, the next leg lower could open quickly.
My view:
Risk management comes first.
Avoid catching a falling knife while MACD is still expanding to the downside.
Better to wait for confirmation than enter too early.
⚠️ Not financial advice. You are responsible for your own decisions.
2
2
33
Swift Mod retweeted
May 16
$ETH holders catching stray bullets from literal metal tariffs 💀
2
2
49
6,466
Swift Mod retweeted
📊INSIGHT ARTICLE – JUNE 3
Tokenized Private Equity Is Not What You Think It Is 🧵
Buying a token linked to #OpenAI or #SpaceX doesn't mean you own a piece of them. 🚫
Here's what most retail investors are missing 👇
🔒 Private company shares have transfer restrictions built into their legal DNA. Blockchain can speed up settlement — it cannot override a company's right to reject who owns its equity.
📌 When #Robinhood launched OpenAI tokens for EU retail users in July 2025, OpenAI publicly rejected any link to its equity. Those tokens? Derivative contracts against Robinhood Europe not OpenAI shares.
⚖️ The SEC drew the line in Jan 2026: → 🟢 Issuer-sponsored tokens = real ownership potential → 🔴 Third-party synthetic tokens = price exposure only
🏗️ An SPV label doesn't fix this. "Exposure to OpenAI" ≠ "Ownership in OpenAI"
✅ Before buying any private-company token, ask: ☑️ Did the company actually approve this structure? ☑️ Where do your legal rights run against the
company, or just the platform?
☑️ What happens if the platform becomes insolvent?
💡 Tokenization is powerful. But consent gaps, counterparty risk, and documentation failures can leave investors holding a narrative not equity.
💬 If a token tracks a private company's value but the company never approved it should platforms still be allowed to sell it?
📖 Read more: cryptothreads.io/insights/wh…

19
10
26
5,081
Swift Mod retweeted
⏳ FINAL HOURS — CryptoThreads.io Partner Growth Campaign
The campaign officially closes at 11:59 PM UTC, June 4.
⚠️ Registrations submitted after the deadline will not be counted.
🔥 The leaderboard is still live, and the competition is getting intense. Keep pushing, protect your position, and stay focused rankings can change at any moment.
🏆 Final results will be announced after verification is completed.

18
12
25
5,207
Swift Mod retweeted
📊 INSIGHT ARTICLE – JUNE 4
🚨 Trading AI company perps? You might be in the SEC's crosshairs.
⚡ OKX, #Hyperliquid & Injective now offer leveraged synthetic futures on #OpenAI, #Anthropic & #SpaceX - no shares, no equity rights, just price exposure on crypto rails.
🤔 Sounds clean. The legal picture isn't.
⚖️ Under Dodd-Frank, contracts tied to a single issuer's valuation may qualify as security-based swaps putting both platforms AND traders in regulatory gray zone.
📊 Key facts:
🏦 Anthropic hit a $965B valuation & filed a confidential S-1 on June 1
💰 OpenAI closed at $852B post-money in March
🤝 SEC-CFTC signed a new coordination MOU in March 2026
🌐 Geo-blocks ≠ compliance ask Falcon Labs
❌ You hold zero shareholder rights. And if regulators act, your trade gets disrupted before the IPO thesis ever plays out.
🎯 The exchanges collect fees while uncertainty lasts. Traders absorb the shock when it doesn't.
💬 If synthetic AI perps get classified as security-based swaps, which platform do you think faces the biggest regulatory heat and will this kill the pre-IPO trading meta entirely?
🔗 Read more: cryptothreads.io/insights/pr…
#Cryptothreads – Crypto Threads for the Best Crypto Insights, Research & Knowledge Platform in Asia

17
10
19
4,541
Swift Mod retweeted

May 21
📣 CryptoThreads.io Partner Growth Campaign — THE OFFICIAL LAUNCH!
🔥 Referral Challenge is now live!
📝 HOW TO PARTICIPATE
1️⃣ Post a short review, opinion, or key insight from the Q1 2026 Crypto Report on your personal X account
2️⃣ Attach your personal referral link (Link will be emailed after registration - Check spam if needed.)
3️⃣ Mention @cryptothreadsX in your post
4️⃣ Invite your audience to subscribe and read the full report through your referral link
📘 READ THE Q1 2026 CRYPTO REPORT
Read the full report here before writing your review: cryptothreads.io/insights/q1…
📌 SCORING SYSTEM
✅ 1 valid email subscriber = 1 REF point
✅ ACCEPTED EMAIL DOMAINS
Only emails using the following domains will be counted:
• @gmail.com
• @icloud.com
• @me.com
• @yahoo.com
❌ DISQUALIFIED EMAILS
Emails will not be counted if they:
• Contain a dot “.” in the email name
• Contain a plus sign “ ” in the email name
• Use a domain outside the accepted list
• Are duplicated
• Show signs of spam, bot activity, fake accounts, or mass registration
• Are submitted after the campaign ends
📅 CAMPAIGN PERIOD
May 21 – June 4
🏆 REFERRAL REWARDS
🥇 Top 1 — $100 USDT
🥈 Top 2 — $40 USDT
🥉 Top 3 — $30 USDT
🏅 Top 4 — $20 USDT
🏅 Top 5 — $10 USDT
🎁 Random Airdrop Rewards
👉 REGISTER NOW
Register here to receive your REF code and start participating today: forms.gle/B8K9t5hkgf6r2zxL7

May 19

🔥 CryptoThreads.io Partner Growth Campaign is COMING SOON!
Early registration is NOW OPEN - get in before the official launch.
🎁 Big rewards will be revealed soon.
👉 Register here: forms.gle/iNh1XytUZenD9M4p8
Don’t miss the early mover advantage!!!

17
15
44
68,625
Swift Mod retweeted

May 4
Drop your $SOL address
First 1200 are elegible for a gift
1,941
405
1,075
53,935

