
ORION is a search engine for markets to help you find similar price shape macro context setups across 30 years of historical data and see what came next.
Joined April 2023
- Tweets 1,251
- Following 109
- Followers 1,496
- Likes 14,981
317 Photos and videos


Pinned Tweet

May 21
Most market commentary starts with a narrative and then searches for evidence.
ORION starts with the data instead.
The engine scans decades of market history to find periods that most closely resemble current conditions across price structure, volatility, momentum, macro regime, and market behavior, then maps how those analogs actually evolved afterward.
Built for people asking questions like:
• “When have markets looked like this before?”
• “What typically happened next?”
• “Is this move normal, euphoric, or breaking historical precedent?”
• “How different is this cycle really?”
Features include:
• Historical analog search across multiple timeframes
• Forward path projections from matched periods
• Macro-aware similarity scoring
• Time Machine mode to test what the engine would have shown at past moments in real time
• Interactive overlays and regime analysis
The goal is not prediction theater.
It is building a better framework for probabilistic thinking under uncertainty.
Try the live app for free at app.orionengine.xyz !
1
4
26
101,013
This is deserving of its own post.
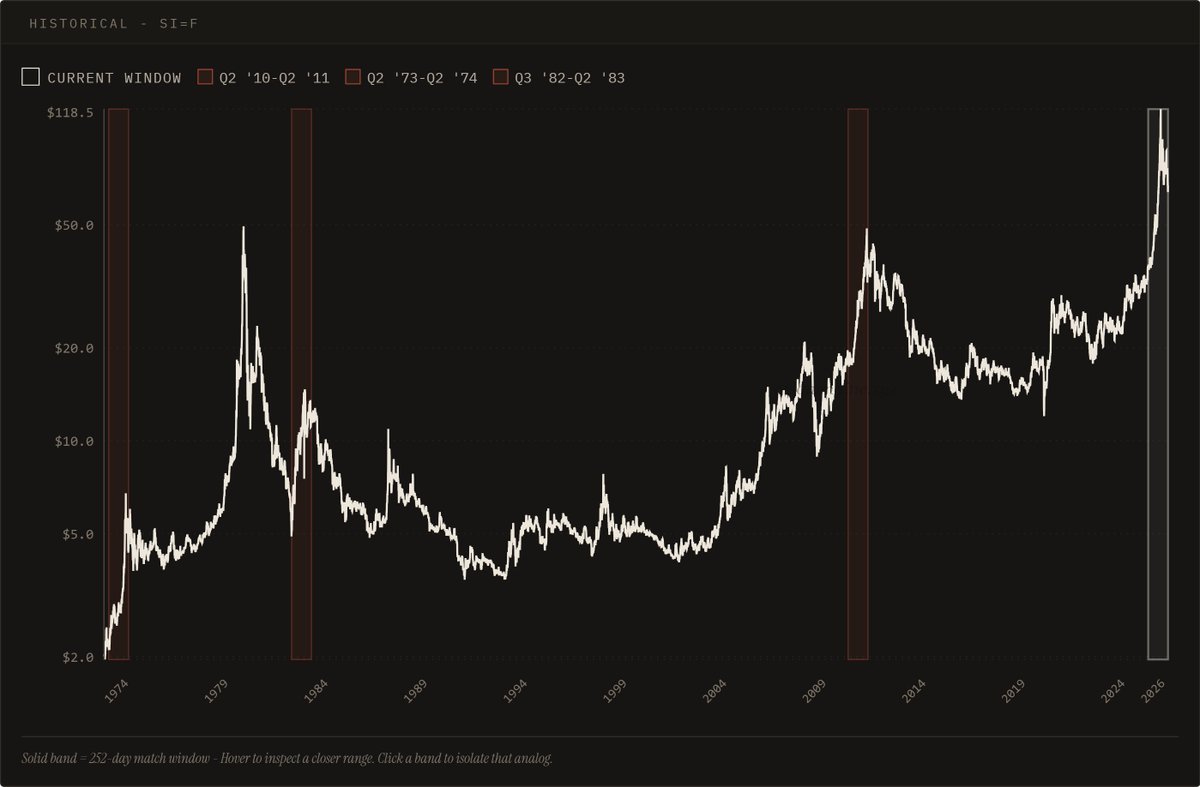
Silver $SLV playing out EXACTLY like its 1973-1974 6-month range analog. Rally into resistance, rejection, and range-bound consolidation into next year if this keeps tracking.
Might be worth accumulating on dips for the long term pico top

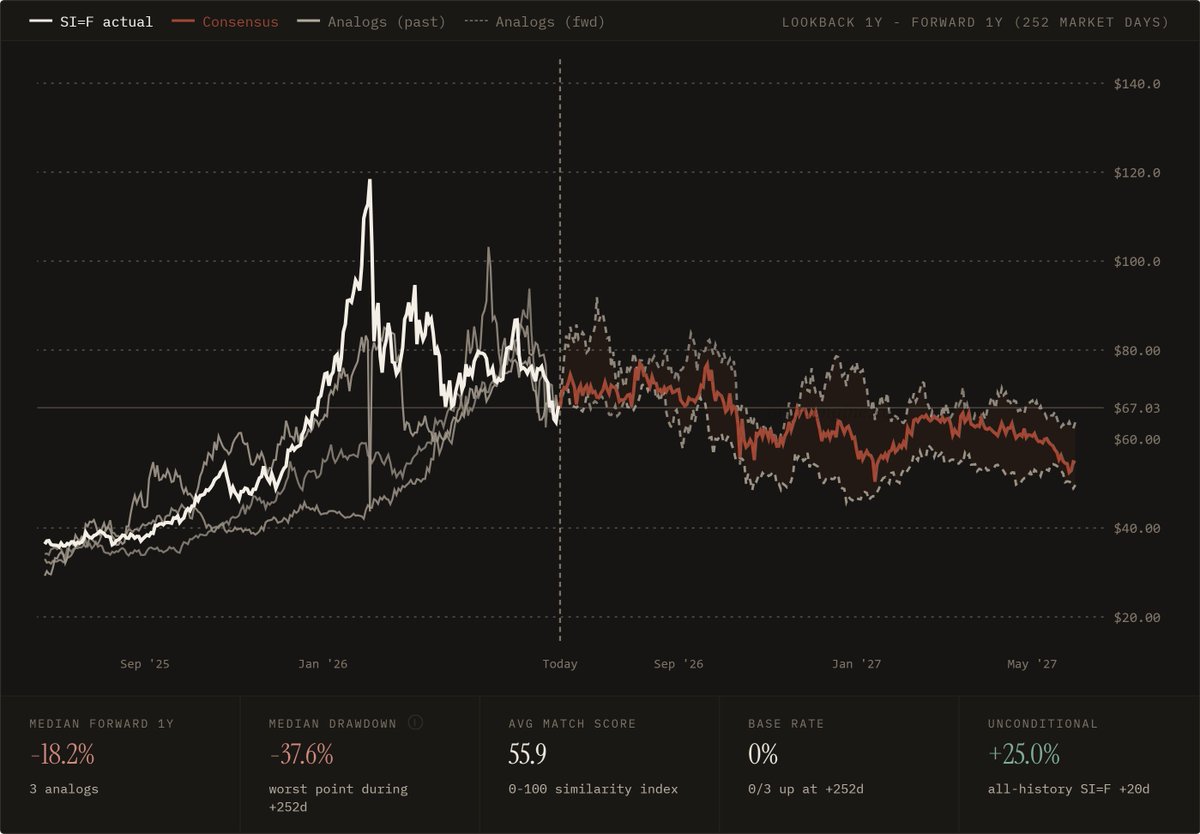
Here's the overlay with the 1973-1974 analog, we are seeing nearly identical price action over the last 6 months, the consolidation is expected to continue well into 2027 if this plays out the same.
4
204
$SLV #SILVER, a short thread. 🧵
Silver continues to closely match every previous blow off top move that ended up consolidating for months/years before its next leg up.
What is interesting is how metals have started moving alongside risk assets since the outbreak of the war, pumping on peace news and dumping on flare ups.
This is telling of late-cycle behaviour, liquidity-driven rallies, and inflationary growth, which leads me to believe in the final stage of this bull market Silver and the rest of metals will have another parabolic run as hyperinflationary fears come back.
May 17
Thanks for spotting that @OVcrypto. #Silver $SLV trading exactly where it was over one month ago when I used the Engine to see that after that blow off top, the metal was likely to go nowhere for a few months.
Here's the updated version. As you can see, all analogs pointing to a sideways chop for the forseable future. If you listened one month ago, it was a good chance to better allocate your capital or sell covered calls to the permabulls calling for a new leg up.

1
3
247
Here's the overlay with the 1973-1974 analog, we are seeing nearly identical price action over the last 6 months, the consolidation is expected to continue well into 2027 if this plays out the same.
1
278
Where do you think Silver and metals are headed next?
Feel free to run the search yourself live on app.orionengine.xyz with different timeframes, view the macro regime backdrop, and statistical outcomes based on historical precedent.
60
$IWM $RUT #Russel2000 after many failed attempts we finally have a clean breakout from previous ATHs into price discovery.
Historically, whenever small caps decisively broke their previous ATH, further upside ensued.
This is a mixed read with 69% score but worth watching.
6
222
Agree with @citrini, top is not in, markets will grind higher, path will be choppy and volatile, can go higher for longer than most expect $SPY.

It’s been a minute since we wrote a macro memo, we were overdue for one.
Here’s the latest in what we’re thinking:
citriniresearch.com/p/macro-…
2
295
Added $HYPE #Hyperliquid ticker to the Orion Engine app. Enjoy!
4
333
Historical view: similar de-leveraging halfway through the move and up-only since.
1
3
336
Macro indicators comparison: similar rising inflation and yields, elevated fed fund rates, and stable to strong dollar regime.
1
238
Jun 13
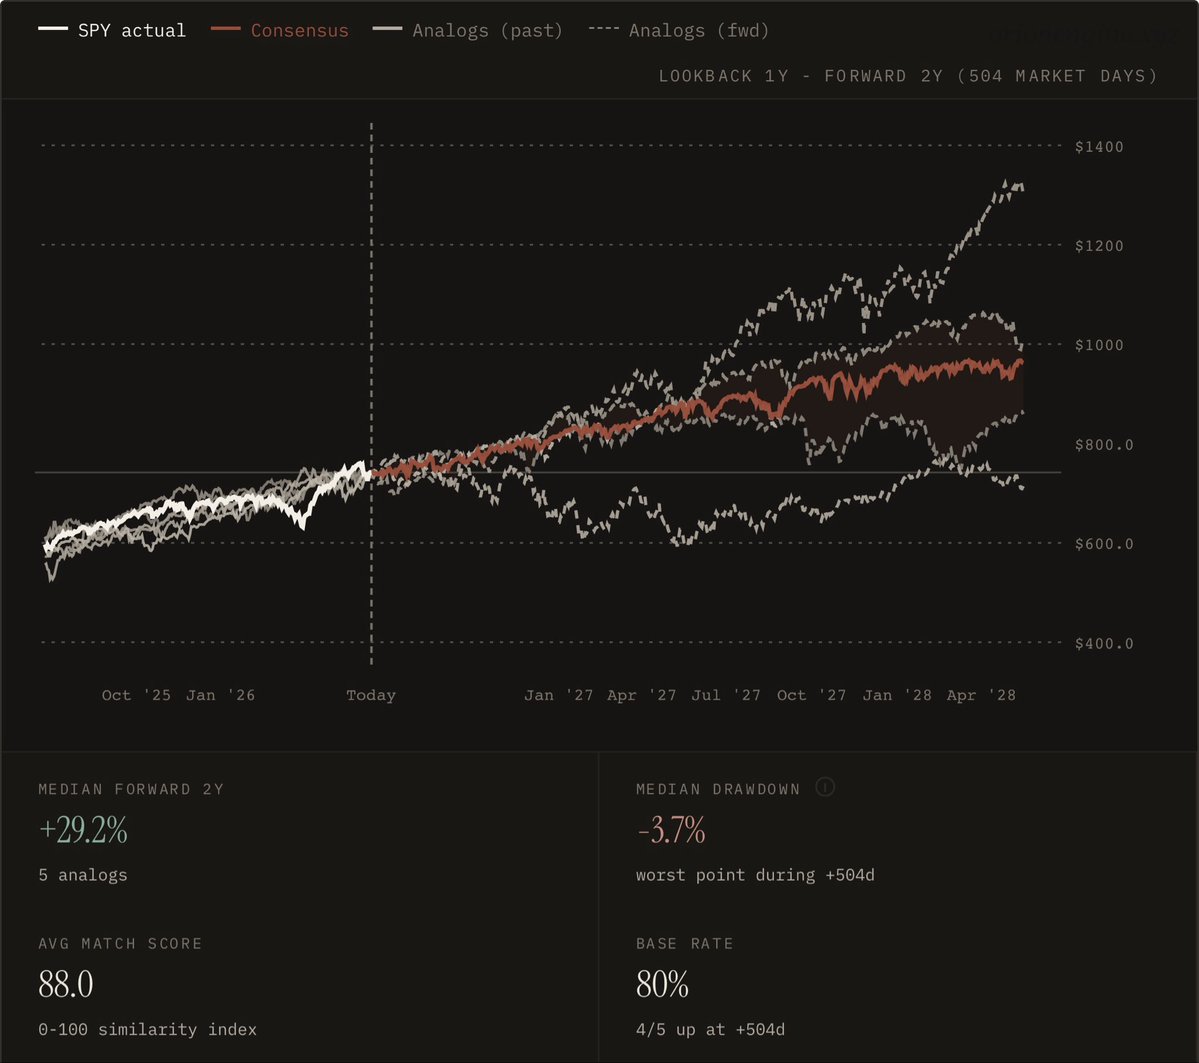
On a higher time frame, it seems clear that $SPY is going to hit 1000 next year
It is guaranteed to be a volatile path, but comparing the bull market with previous analog structured gives a tight picture of the path forward
The eagerness from bears to call tops only adds fuel!
8
422
Jun 13
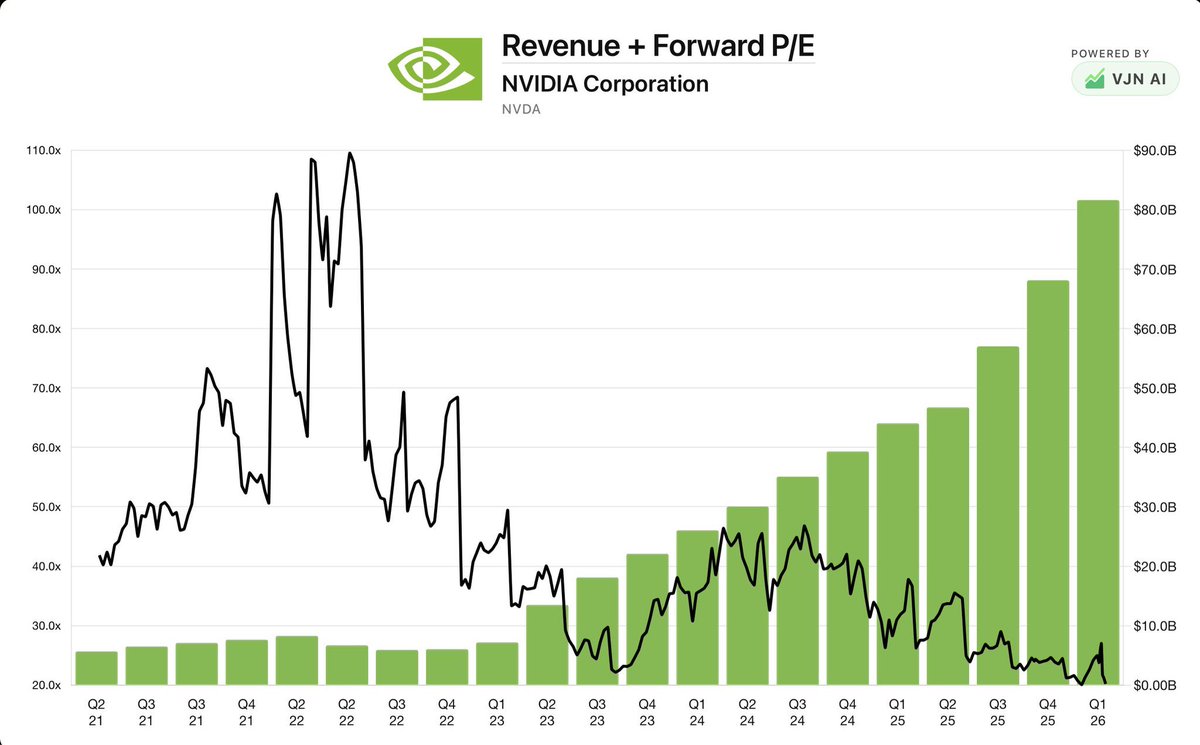
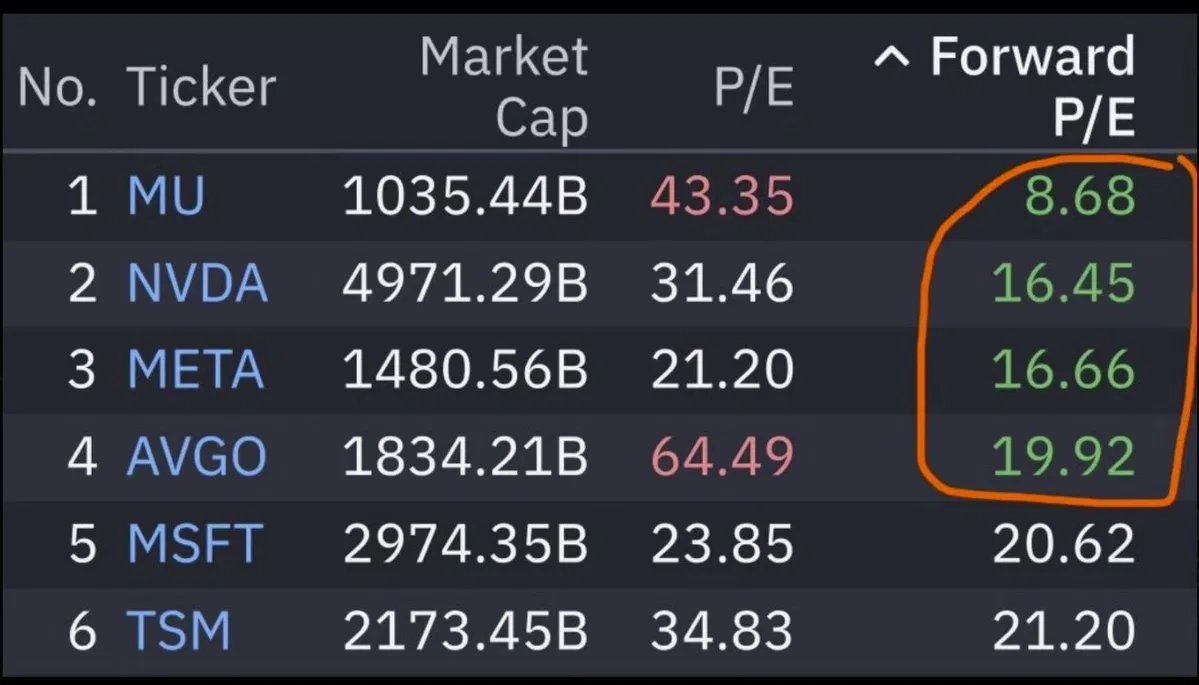
By your logic $NVDA was overvalued in 2022 at the depths of the bear market at $11 a share but now at $200 it’s a steal?
So much noise out there these days

6
760
Jun 13
Gold only down and sideways since March as I expected
Everyone was quick to say this blow off top was different and Gold was going to $10,000/oz
While that may be possible in the future, it was wise to sell or just not buy in to this market at the time
Cut through the noise
Mar 18
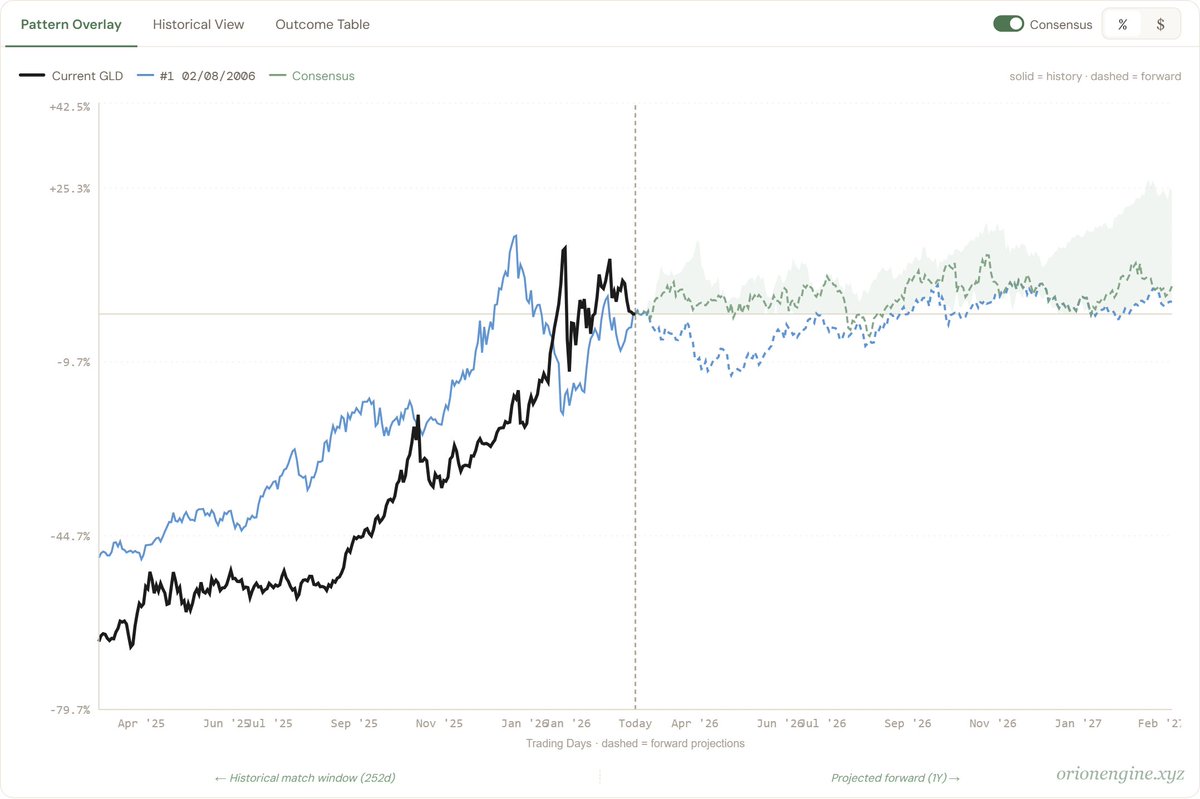
Where could we be in the #GLD cycle? Looking back at Gold's last year of parabolic uptrend, what usually follows is a year of consolidation right below the ATH.
If we isolate to the highest score analog found by the model (2006 - post dotcom crash), we can see how the price action was pretty flat over the coming months.
This could be positive for risk assets as these consolidation periods usually lead to upside for equities and crypto. Keeping an eye on Gold

12
1,068
Jun 11
I’ve seen so many posts like this over the past few days that I’m starting to believe they are being intentionally put out there to pent up short interest and negative sentiment so that the IPO blows all the haters out of the water and keeps everyone sidelined as stocks rip


2
6
415
Jun 11
Chop fest for the month of June is playing out as expected three weeks ago. The mix of seasonality resemblance to similar recoveries from the lows was giving a tight read for the coming weeks.
The SpaceX IPO liquidity drain and rotation to smaller cap/laggards also at play.

5
462
Jun 11
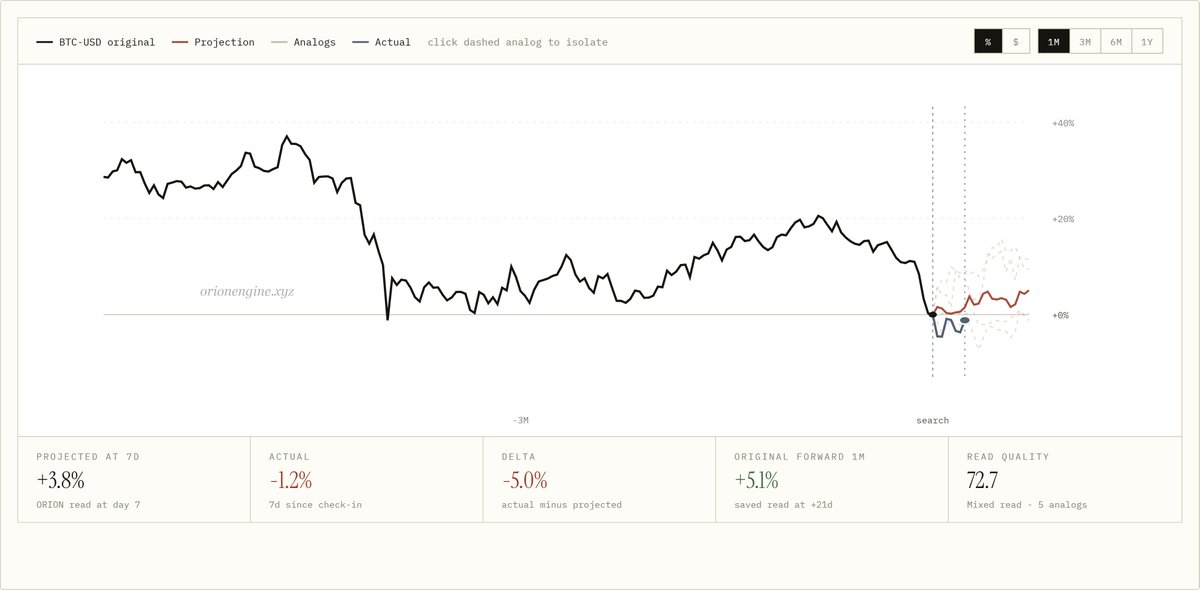
This is not your classic $BTC bear market.
Looking at macro indicators, the current range does not resemble a typical Bitcoin macro bear-market setup.
In the previous highlighted analogs, Gold/Copper was generally rising, DXY was strengthening, and the 2s10s curve was flattening, all pointing to a more defensive, tightening-sensitive backdrop for risk assets.
Today’s setup is different.
Gold/Copper is rolling over, DXY is chopping rather than trending higher, and the curve is steepening instead of flattening. 10Y yields are still firm, so rate pressure has not disappeared, but the broader macro mix looks more transitional than outright risk-off.
So there is clearly another factor at play.
My read is that capital has been chasing the AI narrative while Bitcoin has been treated as old news. But if that is the case, the setup becomes interesting: all it takes is a narrative flip for capital to start rotating back into the laggard, and for $BTC to start acting like the liquidity sponge it was designed to be.

1
22
1,295
Jun 11
In terms of price action it really does resemble previous bear market structures, the closest match being 2014-2015. The length of the bottom was much longer then, but the retest of the lows happended much quicker this time.
Other close analogs are the '22-'23 and '18-19' bears.
1
7
320
Jun 11
Started tracking again on my watchlist on the day of the sweep of the $60k (previous low), and the expectation from previous ranges was a slow relief rally, this is taking longer to play out than expected as Bitcoin chops around these levels.
Next few weeks should be decisive.
2
6
269