
Decision‑support analytics for crypto. Non‑custodial, non‑executing, independent. Each $2.99 report turns market noise into a clear trading journal you control.
Joined October 2024
- Tweets 2,774
- Following 138
- Followers 177
- Likes 856
789 Photos and videos


Pinned Tweet

Feb 11
Most crypto “signals” don’t make you a better trader – they just replace your thinking with someone else’s conviction.
TradeGenius shows you what the market is actually doing so you stay in control of every decision, every entry, every exit.
1
6
916
Sixteen weeks. One message.
Prepare before you trade.
Know your structural levels before the market moves.
Make your decision before the pressure arrives.
TradeGenius makes that possible in 60 seconds.
Any coin. Demand zones, supply levels, trend direction,
Fibonacci levels, Fear & Greed, invalidation level.
One page. Plain English.
Not a signal. Not a call. Not a subscription.
$2.99 per report.
Use code FIRSTFREE — first report free, no credit card required.
tradegenius.bot
#Crypto #CryptoTrading #Bitcoin #Altcoins #TechnicalAnalysis #TradingTools #MarketStructure #RiskManagement #Fibonacci #CryptoEducation #Investing #TradingPsychology #TradeSmarter #TradeGenius
13
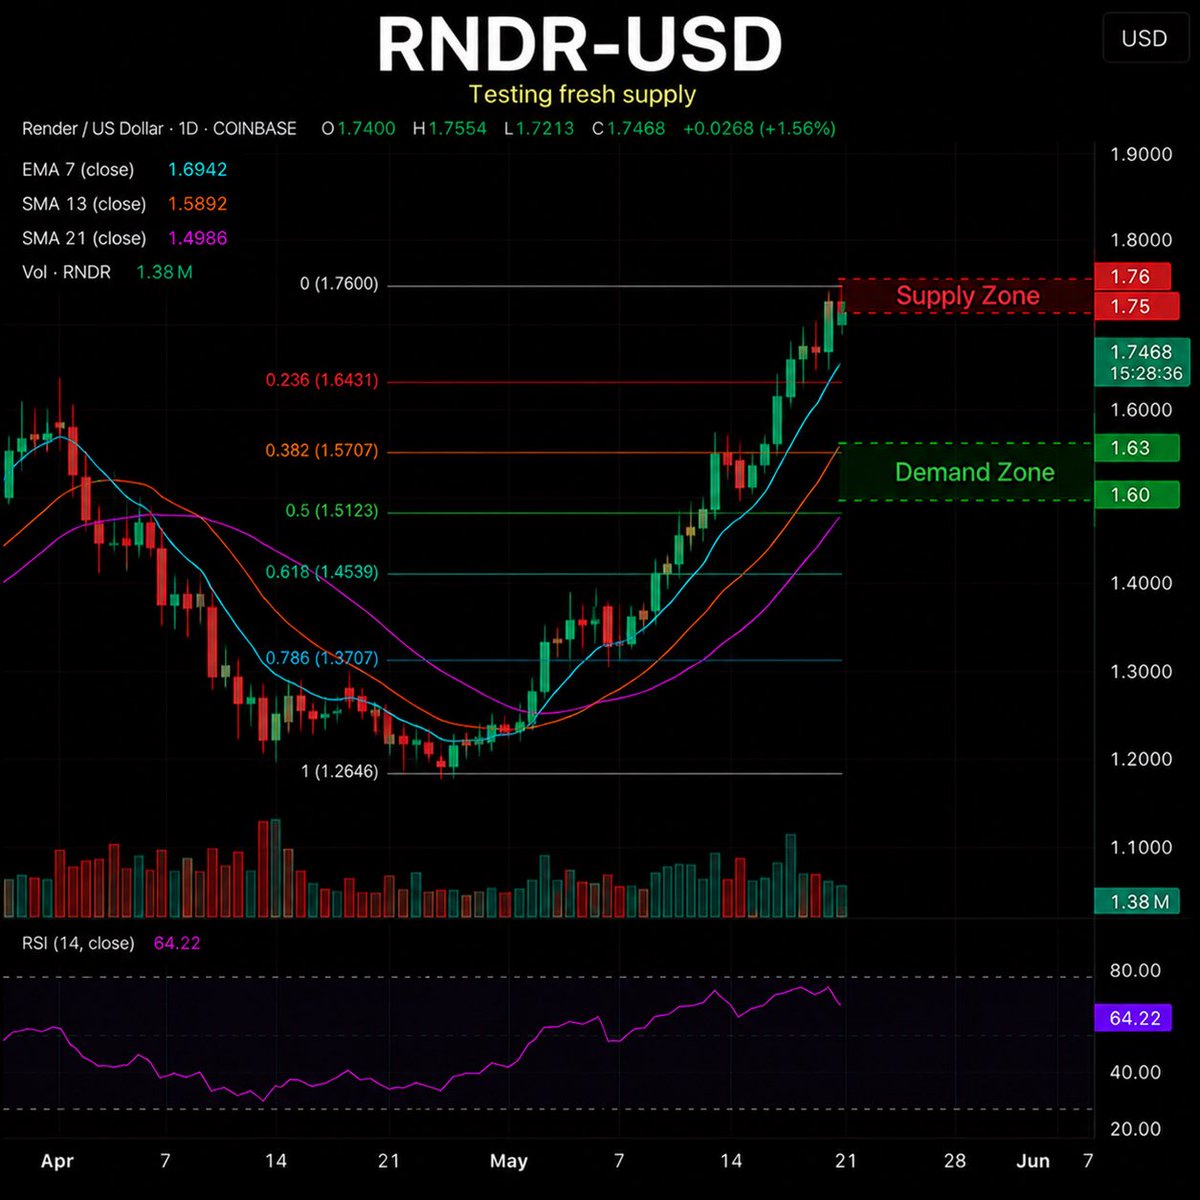
$RNDR is trading at a 26-day high with momentum still pushing upward.
Price is pressing directly into a fresh supply zone while RSI continues to climb toward overbought territory. The level that matters is being tested now.
If momentum begins to fade here, does the recent recovery still have enough strength to hold structure?
The full structure breakdown is in the report.
This is market context, not financial advice.
→ Free first report: tradegenius.bot
Code: FIRSTFREE
#RNDR #Render #Crypto #AIcrypto #TechnicalAnalysis
1
21
Jun 13
$ETH | Market Structure Snapshot
Price: $1,665
No call. No signal. Just the structure before the session opens.
Context:
• Trend: UP
• Momentum: EXPANDING
• Volatility: FLAT TO MODERATE
Key structural areas:
• Demand zone: $1,644 – $1,651
• Supply zone: $1,666 – $1,680
• Fibonacci 0.618: $1,643.88
• Invalidation below: $1,610
Scenarios:
If demand holds → continuation toward $1,666 then $1,680
If demand fails → liquidity likely toward $1,621
Price remains above the 7 EMA, 13 SMA and 21 SMA while MACD maintains a bullish histogram. RSI sits near neutral at 48, suggesting room for expansion in either direction.
This is context, not advice.
Code FIRSTFREE — first report free, no credit card.
→ tradegenius.bot
#Ethereum #ETH #MarketStructure #TechnicalAnalysis
2
18
Jun 12
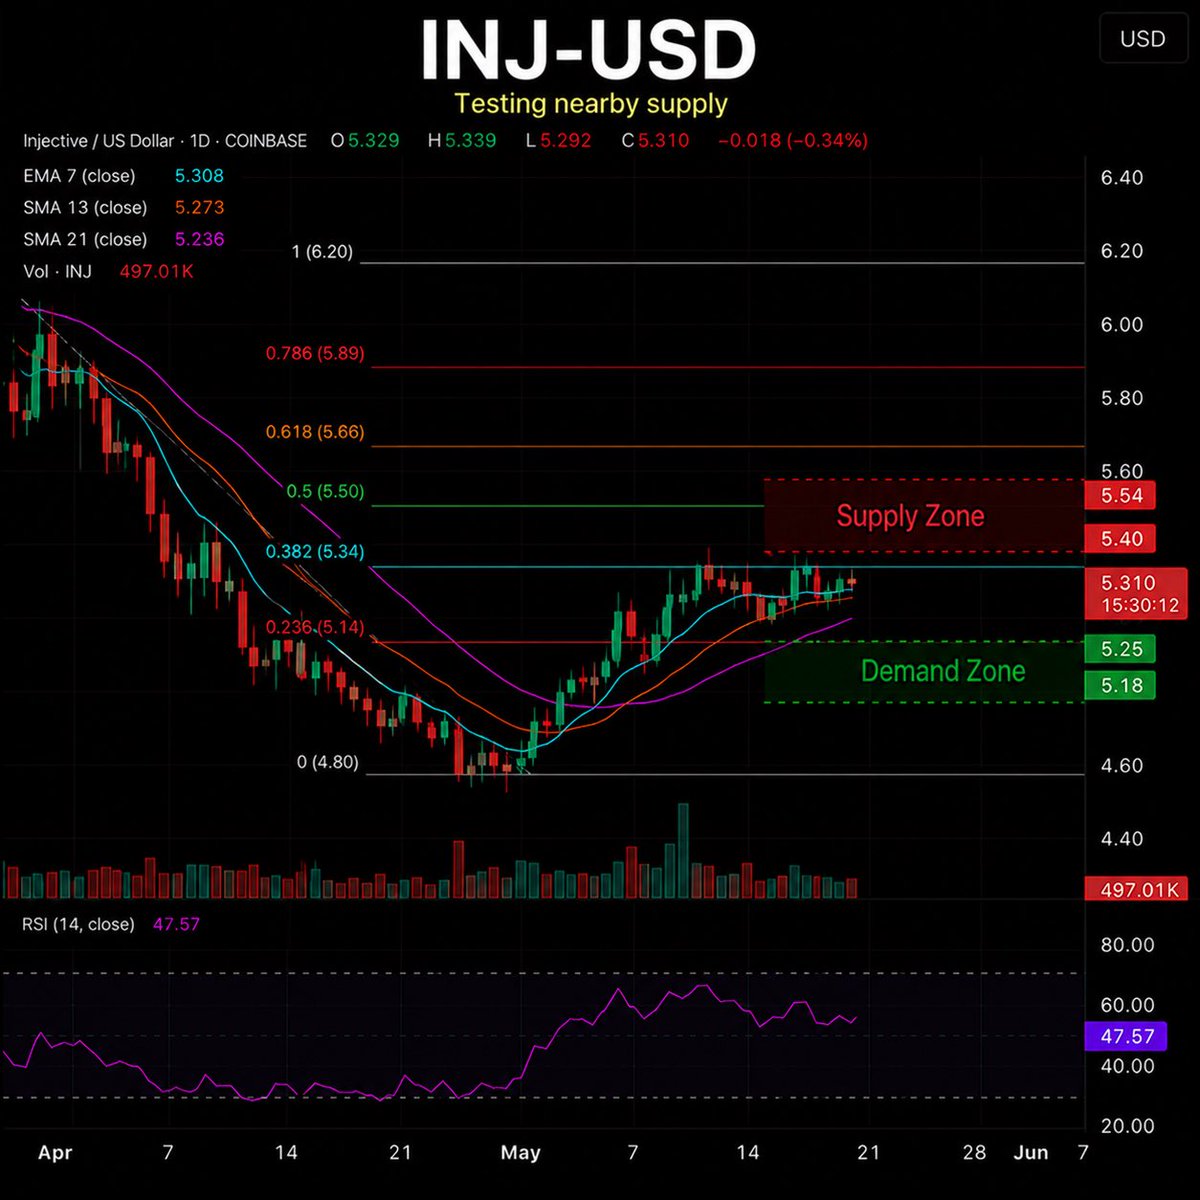
$INJ is trading between key Fibonacci levels with RSI neutral and momentum attempting to stabilize.
Price is pressing against a nearby supply zone while MACD remains positive. The level that matters is being tested now.
If that zone continues to cap price, does the recent recovery still have room to develop?
The full structure breakdown is in the report.
This is market context, not financial advice.
→ Free first report: tradegenius.bot
Code: FIRSTFREE
#INJ #Injective #Crypto #Altcoins #TechnicalAnalysis
2
53
Jun 12
$INJ is trading between key Fibonacci levels with RSI neutral and momentum attempting to stabilize.
Price is pressing against a nearby supply zone while MACD remains positive. The level that matters is being tested now.
If that zone continues to cap price, does the recent recovery still have room to develop?
The full structure breakdown is in the report.
This is market context, not financial advice.
→ Free first report: tradegenius.bot
Code: FIRSTFREE
#INJ #Injective #Crypto #Altcoins #TechnicalAnalysis
2
54
Jun 12
Bull markets create traders.
Bear markets expose them.
The edge that survives both isn't a better entry.
It's a process that works in any regime.
Know your levels. Know where you're wrong.
Decide before the pressure arrives.
Code FIRSTFREE — first report free, no credit card.
tradegenius.bot
#crypto #bitcoin #BTC #cryptotrading #tradingmindset
2
14
Jun 11
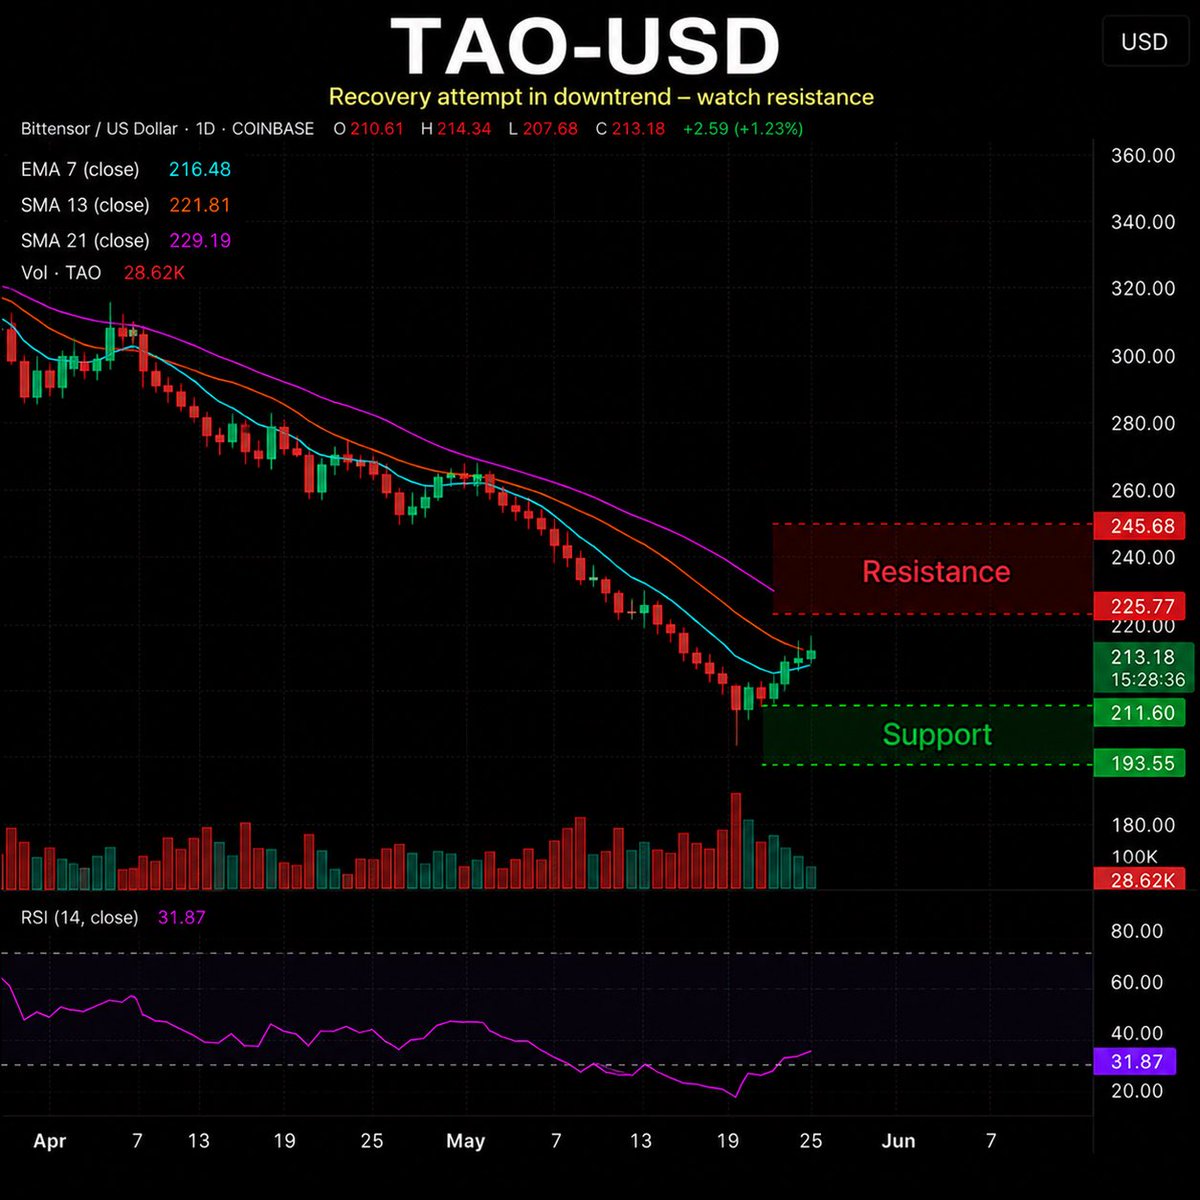
$TAO is trading near the middle of its recent range after rebounding from a key demand zone.
Price has reclaimed short-term averages, but bearish MACD momentum remains in place while resistance sits just overhead near a major Fibonacci level.
If buyers cannot push through the current supply zone, the next reaction could reveal whether this recovery is strengthening or losing momentum.
The full structure breakdown is in the report.
This is market context, not financial advice.
→ Free first report: tradegenius.bot
Code: FIRSTFREE
#crypto #TAO #Bittensor #AIcrypto #technicalanalysis
4
77
Jun 11
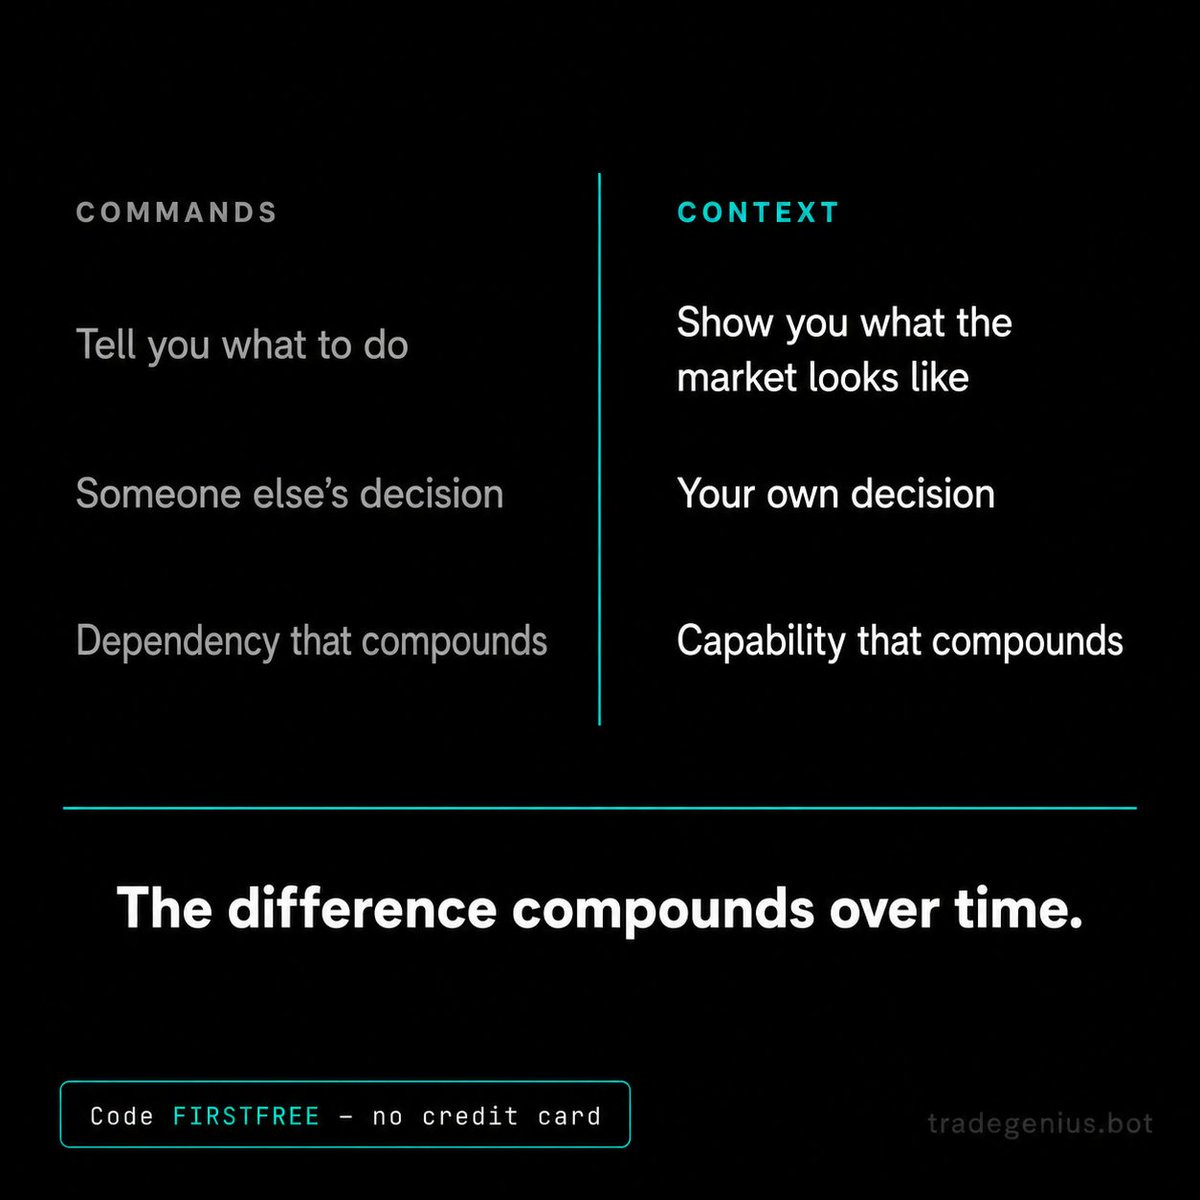
Commands tell you what to do.
Context shows you what the market actually looks like before you act.
Commands make you dependent on someone else’s decision. Context makes you capable of making your own.
Signal groups give you commands. TradeGenius gives you context.
Demand zones. Supply levels. Trend direction. Fibonacci levels. Fear & Greed. Invalidation level.
All from 26 days of closing data, before the session opens.
Then you look at the picture. And you decide.
That’s the difference that compounds over time.
Use code FIRSTFREE — no credit card required. → tradegenius.bot
#TradingPsychology #TradingStrategy #TechnicalAnalysis #IndependentTrading #ContextOverCommands #RiskManagement #DayTrading
1
2
40
Jun 10
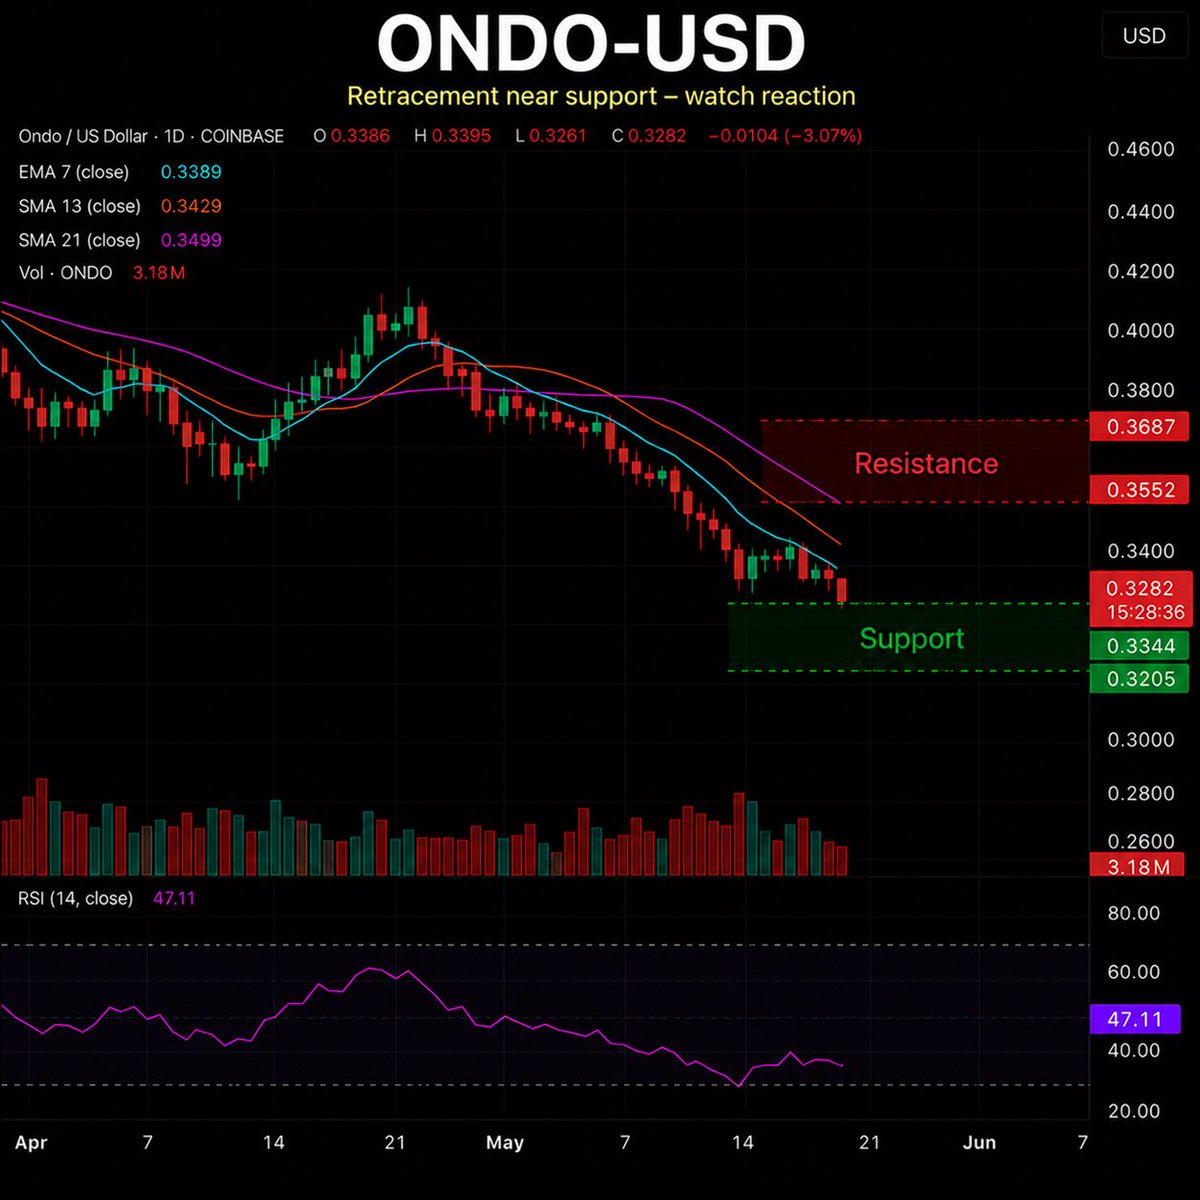
$ONDO is trading near the lower end of its recent range while bearish momentum continues to pressure the structure.
Price is sitting close to a key demand zone near the lower Bollinger Band, with resistance clustered just overhead around the 0.618 Fibonacci level.
If this support area fails to attract buyers, the next reaction could determine whether the structure stabilizes or extends the current retracement.
The full structure breakdown is in the report.
This is market context, not financial advice.
→ Free first report: tradegenius.bot
Code: FIRSTFREE
#crypto #ONDO #RWA #technicalanalysis #altcoins
2
45
Jun 10
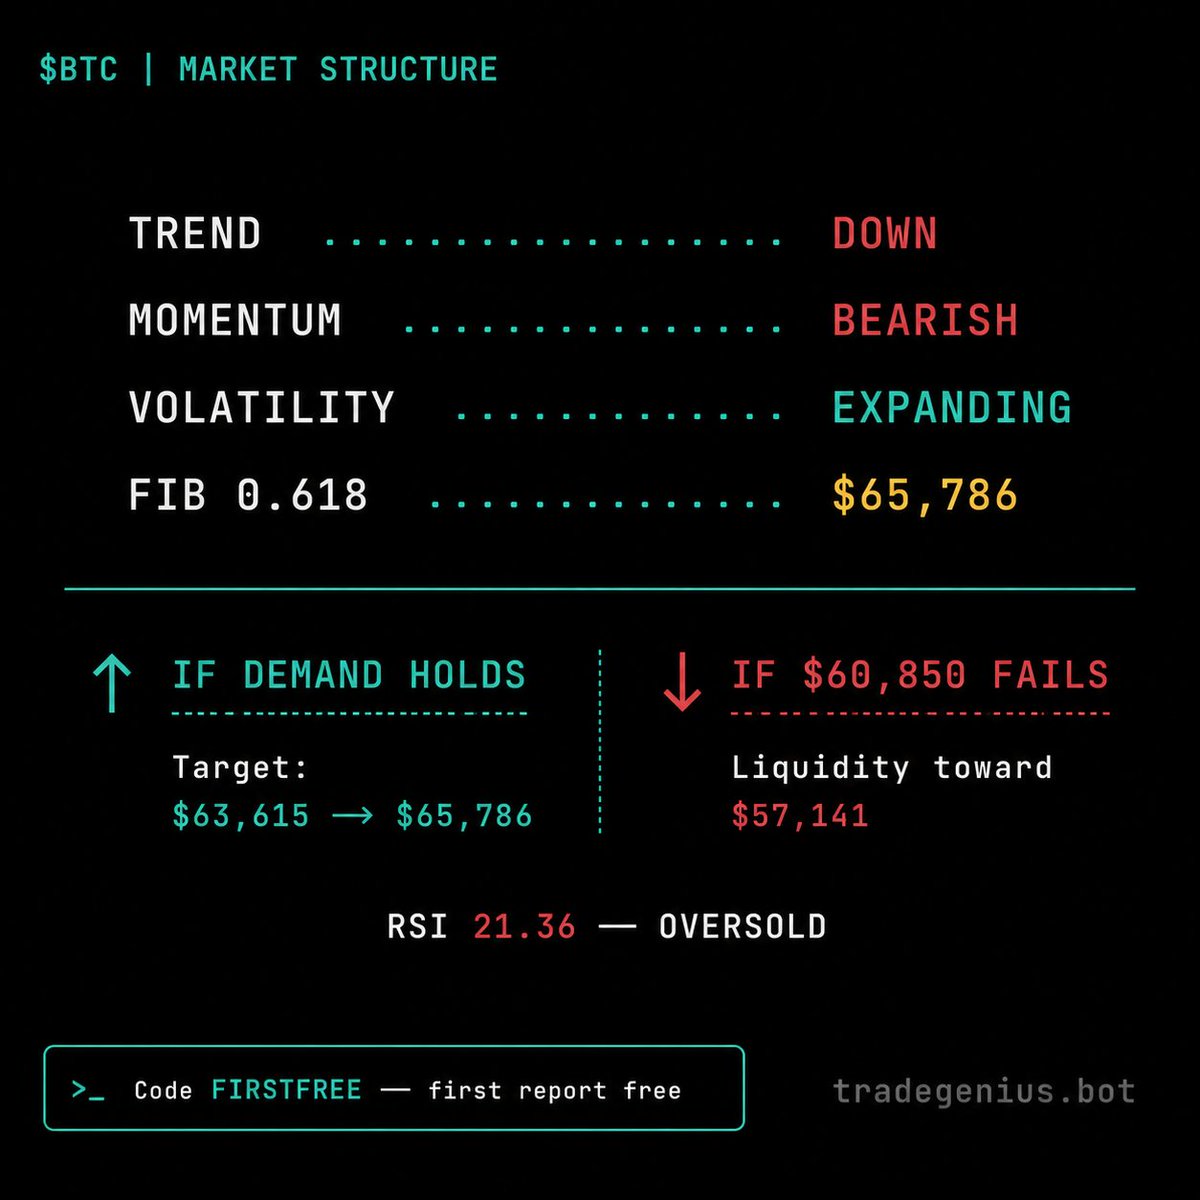
$BTC | Market Structure Snapshot
Price: $61,744
Context:
• Trend: DOWN
• Momentum: FADING (bearish)
• Volatility: EXPANDING
Key structural areas:
• Demand zone: $60,850 – $57,141
• Supply zone: $63,615 – $65,786
• Fibonacci 0.618: $65,786
• Invalidation below: $55,000
Scenarios:
1. If demand holds → relief rally toward $63,615 then $65,786
2. If $60,850 fails → downside liquidity toward $57,141 becomes likely
RSI sits at 21.36 (oversold), but oversold does not automatically mean reversal.
No call. No signal. Just the structure before the session opens.
This is context, not advice.
Code FIRSTFREE — first report free, no credit card.
→ tradegenius.bot
#bitcoin #btc #marketstructure #technicalanalysis
#cryptotrading #tradegenius #tradingview #crypto
1
2
61
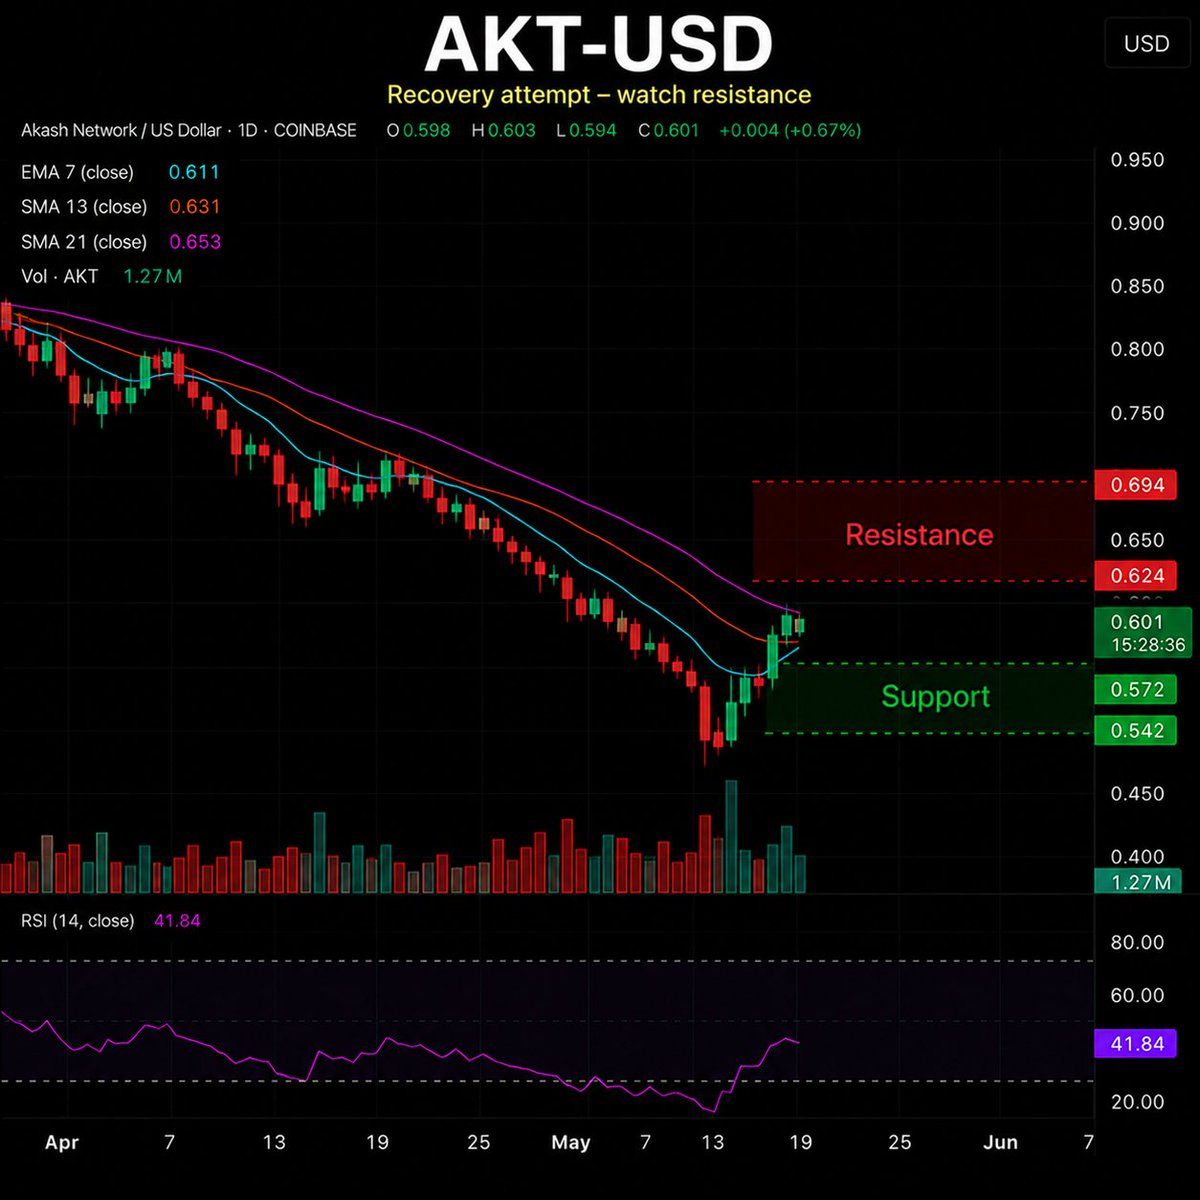
$AKT is attempting to recover from recent lows, but the broader structure remains under pressure.
Price is testing the 0.786 Fibonacci level while remaining below every major moving average, with bearish momentum still active in the background.
If buyers cannot reclaim nearby resistance, the next reaction could reveal whether this bounce is building structure or fading into another lower high.
The full structure breakdown is in the report.
This is market context, not financial advice.
→ Free first report: tradegenius.bot
Code: FIRSTFREE
#crypto #AKT #DePIN #AIcrypto #technicalanalysis
6
198
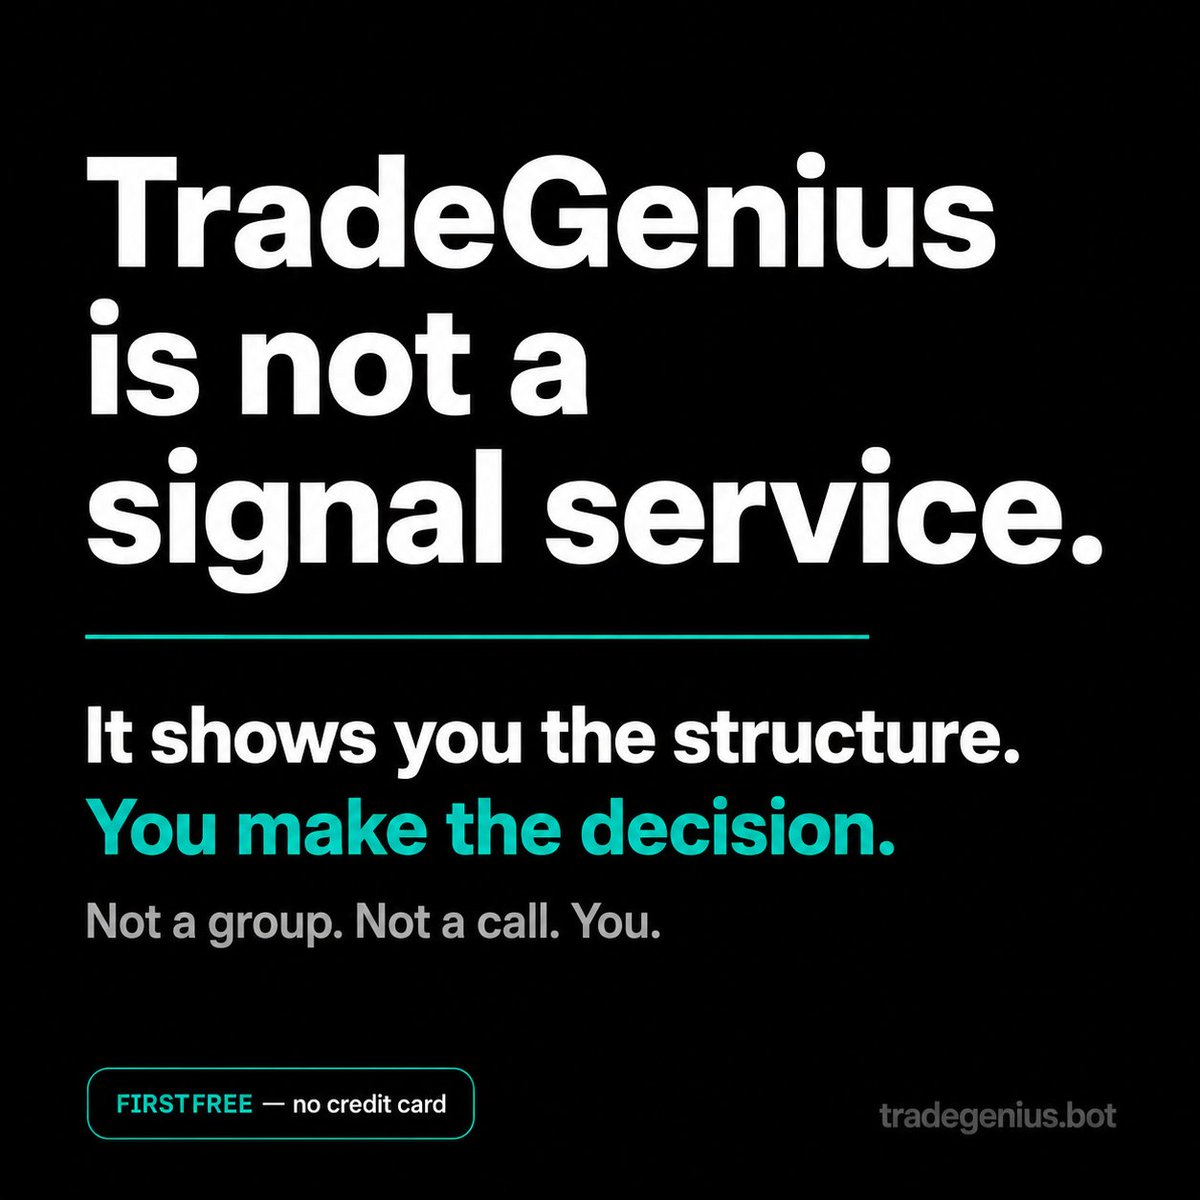
TradeGenius is not a signal service.
No Telegram group. No Discord.
No guru with an unverifiable track record.
No 3am notifications telling you what to do.
Here's what it actually is:
A structural analysis tool that shows you
• Where demand has historically shown up
• Where supply has repeatedly rejected price
• What trend & momentum are structurally saying
• And exactly where you are wrong — before the session opens.
Then you decide.
Not a group. Not an algorithm. You.
That’s independence.
That’s what TradeGenius is built for.
Use code FIRSTFREE — no credit card required.
→ tradegenius.bot
#Trading #IndependentTrading #TradingStrategy #TechnicalAnalysis #RiskManagement #TradeSmart #DayTrading
56
$TAO is attempting to stabilize after a steep decline, but the broader structure remains under pressure.
Price is holding near a key Fibonacci support area while RSI approaches oversold territory, yet momentum remains bearish and resistance is stacked overhead.
If buyers cannot reclaim nearby resistance, the next reaction could reveal whether this recovery has real strength or is simply a pause in the trend.
The full structure breakdown is in the report.
This is market context, not financial advice.
→ Free first report: tradegenius.bot
Code: FIRSTFREE
#crypto #TAO #Bittensor #AIcrypto #technicalanalysis
3
105
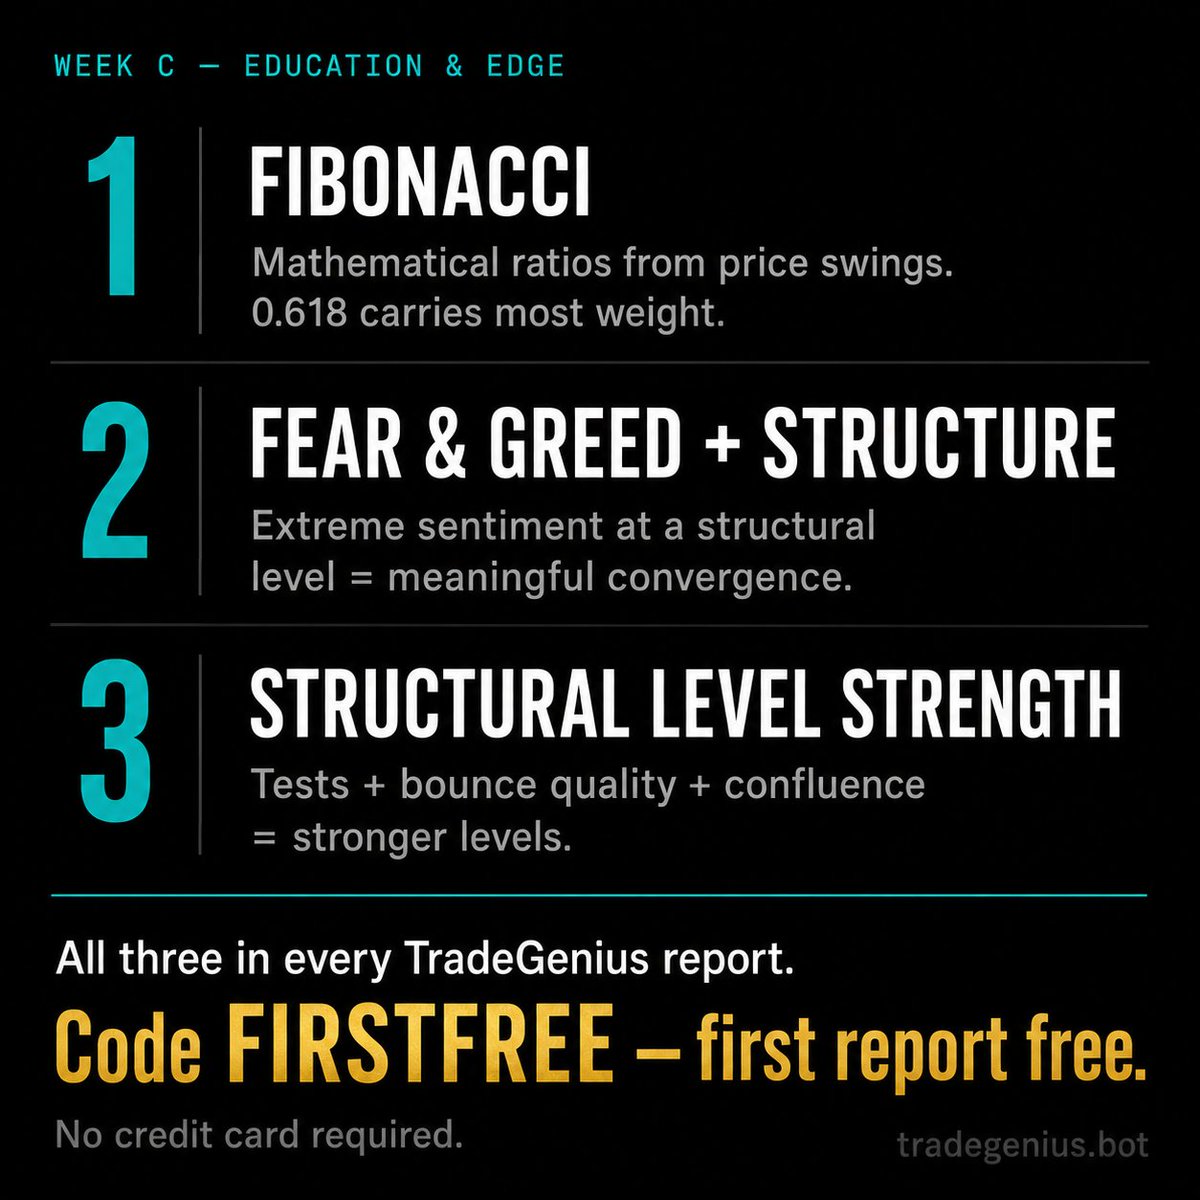
Three education concepts this week:
Fibonacci levels — not magic. Mathematical proportions
derived from actual price swings.
The 0.618 is the level that carries the most structural weight.
Fear & Greed structural convergence —
extreme sentiment at a structural level changes the risk profile.
Neutral sentiment in the middle of a range is a no-trade zone.
Structural level strength — not all demand zones are equal.
Tests, bounce quality, and confluence determine the weight.
All three of these are in every TradeGenius report.
Fibonacci levels. Fear & Greed. Demand zones with confluence context.
One page. Any coin. 60 seconds.
Use code FIRSTFREE — first report free, no credit card required.
→ tradegenius.bot
1
14
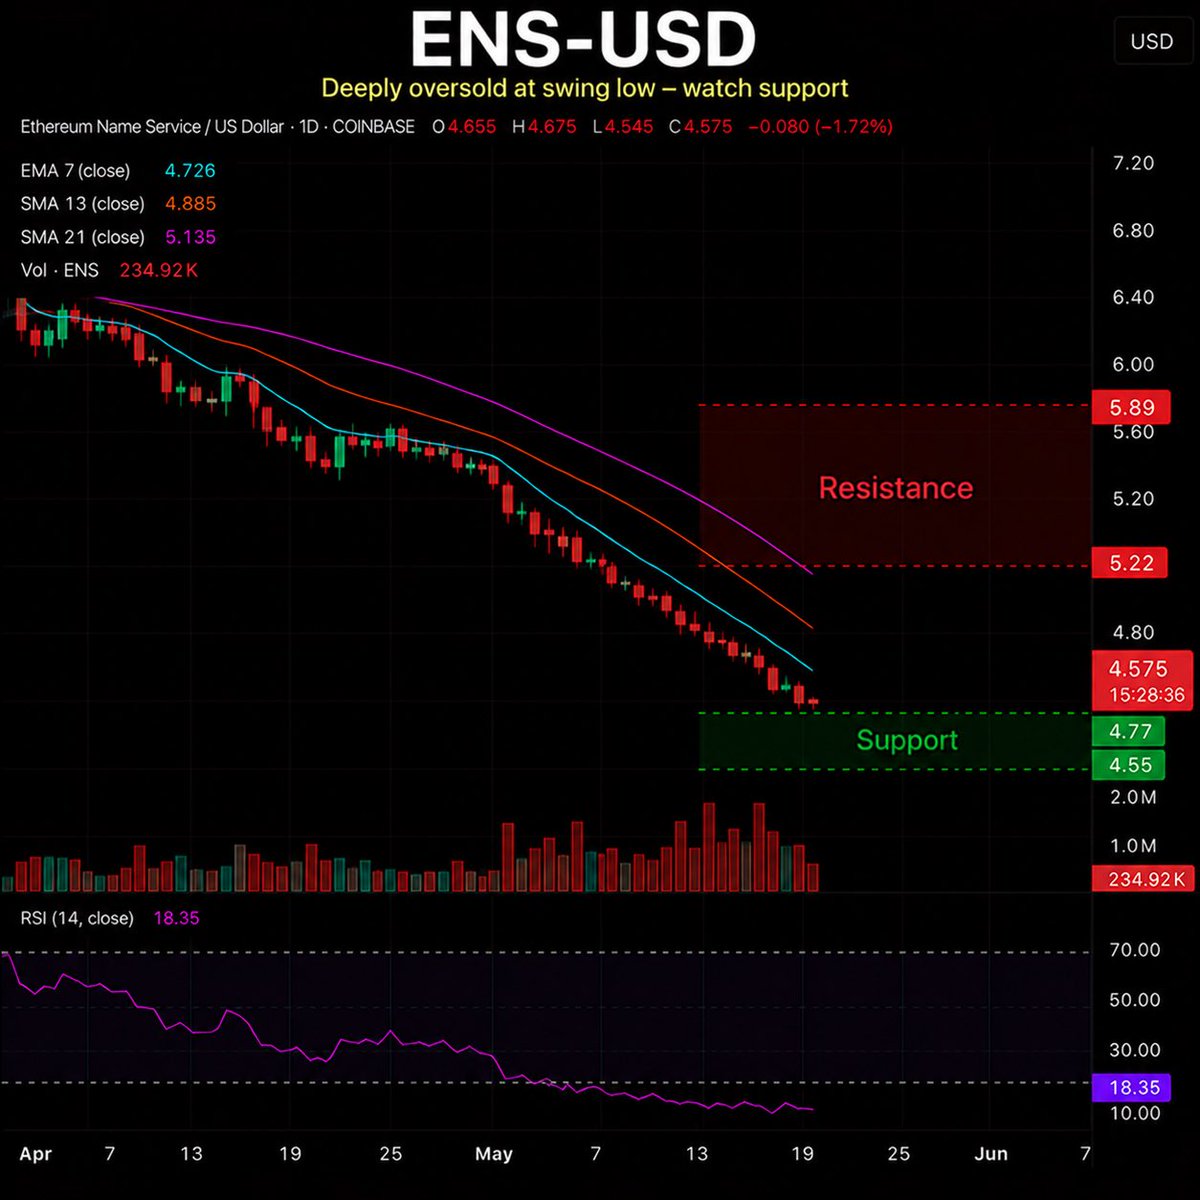
$ENS is trading at a 26-day low with RSI deep in oversold territory.
Price remains below every major moving average while bearish momentum continues to accelerate, leaving one key demand zone under pressure.
If this support level cannot stabilize the structure, the next reaction could reveal whether sellers are exhausted or still firmly in control.
The full structure breakdown is in the report.
This is market context, not financial advice.
→ Free first report: tradegenius.bot
Code: FIRSTFREE
#crypto #ENS #Ethereum #technicalanalysis #altcoins
1
90
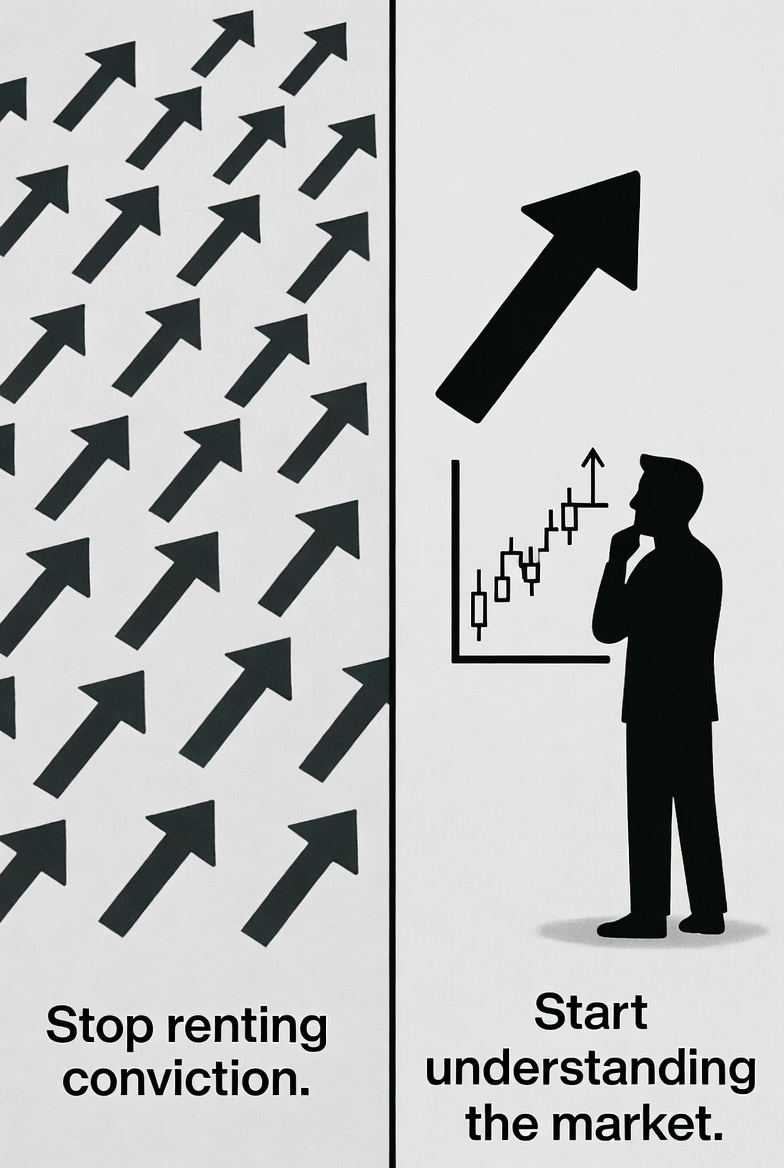
Most traders see the level.
Few see what surrounds it.
Here are the three layers that change the picture.
First report free — use code FIRSTFREE, no credit card.
tradegenius.bot
#cryptotrading #bitcoin #BTC #technicalanalysis #fibonacci
1
34
$ZK is trading at a 26-day low with RSI deep in oversold territory.
Price remains below every major moving average while bearish momentum is still accelerating, creating tension between exhaustion and continuation.
If the current demand zone cannot stabilize price, the next reaction could reveal whether sellers are finally losing control or strengthening their grip.
The full structure breakdown is in the report.
This is market context, not financial advice.
→ Free first report: tradegenius.bot
Code: FIRSTFREE
#crypto #ZK #altcoins #technicalanalysis #trading

1
214
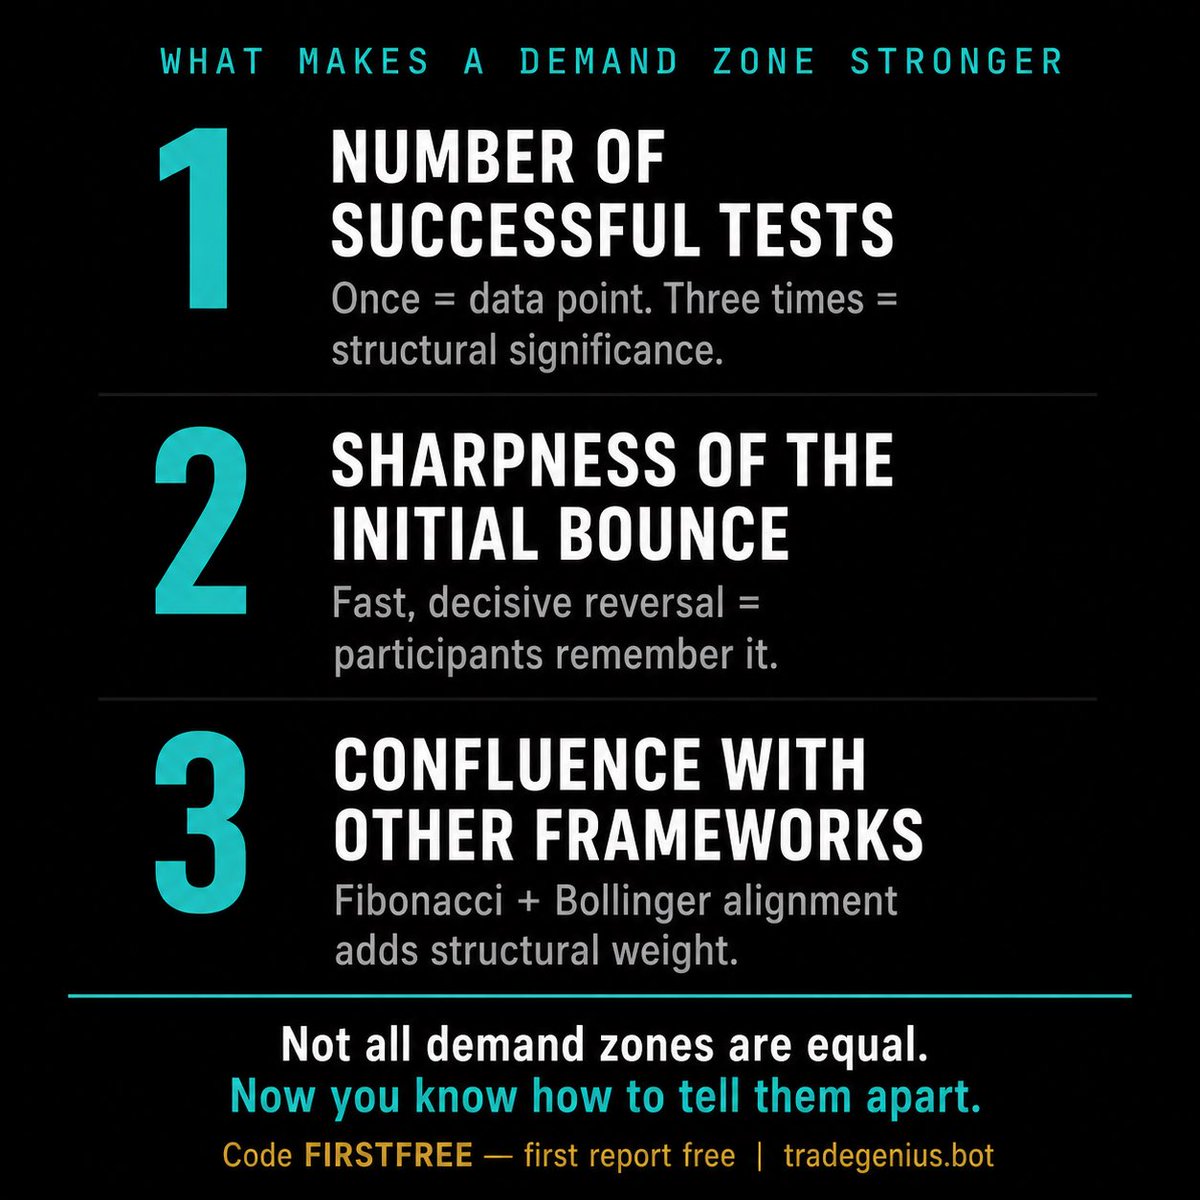
Not every demand zone produces the same reaction.
Here’s what separates the ones that hold from the ones that don’t.
THREE FACTORS THAT STRENGTHEN A STRUCTURAL LEVEL:
1. How many times it has been tested and held.
A level tested once is a data point.
A level tested three times and held is structural significance.
Each successful hold adds weight — more participants have validated it.
2. How sharp the bounce was when it was first established.
A level that produced a fast, decisive reversal
attracted more attention from participants.
They remember it. They’ll act there again.
3. Whether it aligns with a secondary framework. A demand zone that also sits at a Fibonacci 0.618 retracement, or where the Bollinger lower band is positioned,
carries more weight than one standing alone.
That’s confluence, multiple independent frameworks confirming the level.
TradeGenius identifies demand zones from 26 days of closing data and shows the Fibonacci and Bollinger context alongside them.
So you can see which levels are structurally strong before you decide to act on them.
Use code FIRSTFREE — first report free, no credit card required.
→ tradegenius.bot
#DemandZones #StructuralLevels #Fibonacci #BollingerBands #TechnicalAnalysis #Trading #SmartTrading #TradeGenius
1
19
This map is a game-changer for serious crypto traders.
Jurisdictional risk is one of the biggest hidden variables in any position, knowing exactly where Bitcoin is legal (or restricted) instantly sharpens your risk framework before you even look at structure.
Clarity on the regulatory map precise demand/supply zones = decisions that actually compound.
First report free (code: FIRSTFREE) → tradegenius.bot
This is market context, not financial advice.
#Bitcoin #CryptoTrading #TechnicalAnalysis

👀 I got tired of watching Bitcoiners google “is Bitcoin legal in my country” and land on 3-year-old blog posts.
So we built the answer ourselves.
Interactive map. Every country. One click. 🌍⚡
Link in comment 👇 #Bitcoin
1
2
584