
Joined April 2011
- Tweets 21,344
- Following 360
- Followers 4,473
- Likes 15,068
9,342 Photos and videos


Pinned Tweet

Mar 18
🚀 We’re in Beta — and almost ready to open the doors.
Introducing a new kind of signal service:
one where we only win when you do.
- No empty promises 💡
- Real-time audited performance 📊
- 100% aligned incentives ⚖️
Right now, the platform is in closed Beta, being refined with a select group of early users.
New subscriptions opening soon.
If you’re ready for a smarter, fairer, performance-driven approach — stay tuned.
👉 Your access might be next.
#Trading #FinTech #Investing #BetaLaunch #SmartMoney #Signals #forex #equities #crypto

5
4
2,463
Jun 8
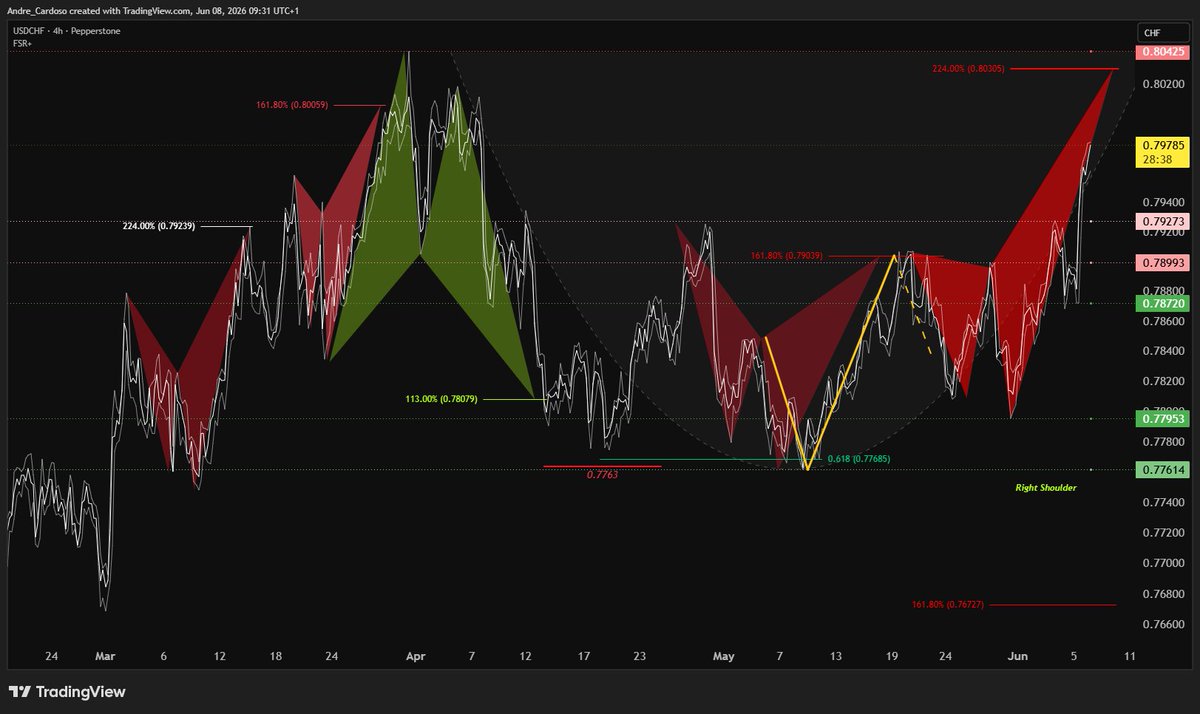
$USDCHF #ForexTradingSignals Bearish shark pattern projected to complete at 0.8030, suggesting a retest of the previous major fractal resistance forged at 0.8042. #USDCHF #FOREX
1
1
4
433
Jun 8
$XAGUSD Completed the bullish butterfly pattern at $66,51. This pattern suggests a bounce towards the .382% Fibonacci retracement level projected at $74. #commodities #xagusd #silver
1
1
5
1,016
Jun 7
$KC1 #coffee broken neckline at $275 suggests a move towards $197. Double Top. #commodities #futures
2
1
310
Jun 7
#Bitcoin has retraced back toward a previously established support zone, revisiting an area around $59,930.
The Bearish 3 Drives pattern remains active within the current market structure, continuing to define the broader downside framework.
The $59,930 area represents a notable technical level as previous support, while the Bearish 3 Drives pattern continues to project lower reference levels within the existing structure.
Within the context of the Bearish 3 Drives pattern, the default target remains the retest of point A at $49,600. bitcoin:native
1
1
377
May 30
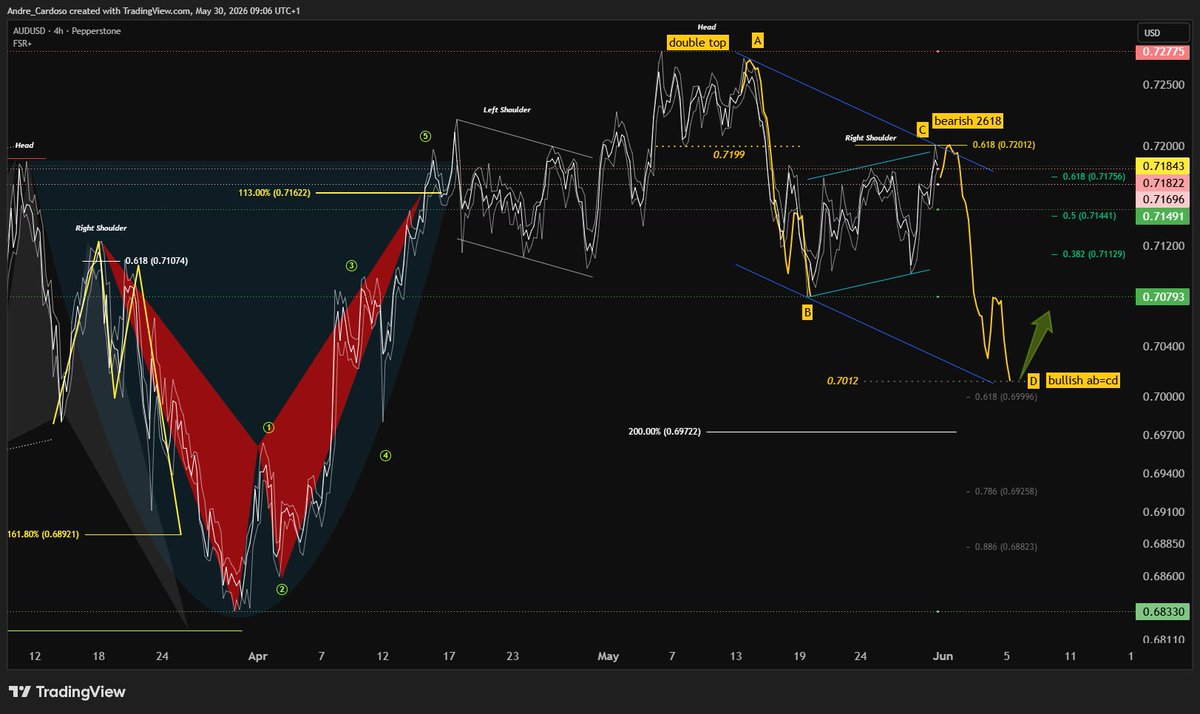
$AUDNDZ ended the week by completing a Bearish 2618 pattern at 0.7201 after reaching the 61.8% Fibonacci retracement level. The Bearish 2618 pattern is often associated with significant declines following completion, placing focus on a potential retest of the previous lows and fractal support formed at 0.7079. Bullish AB=CD pattern projected below support at 0.7012. #Forex #AUDNZD
2
1
4
607
Jun 1
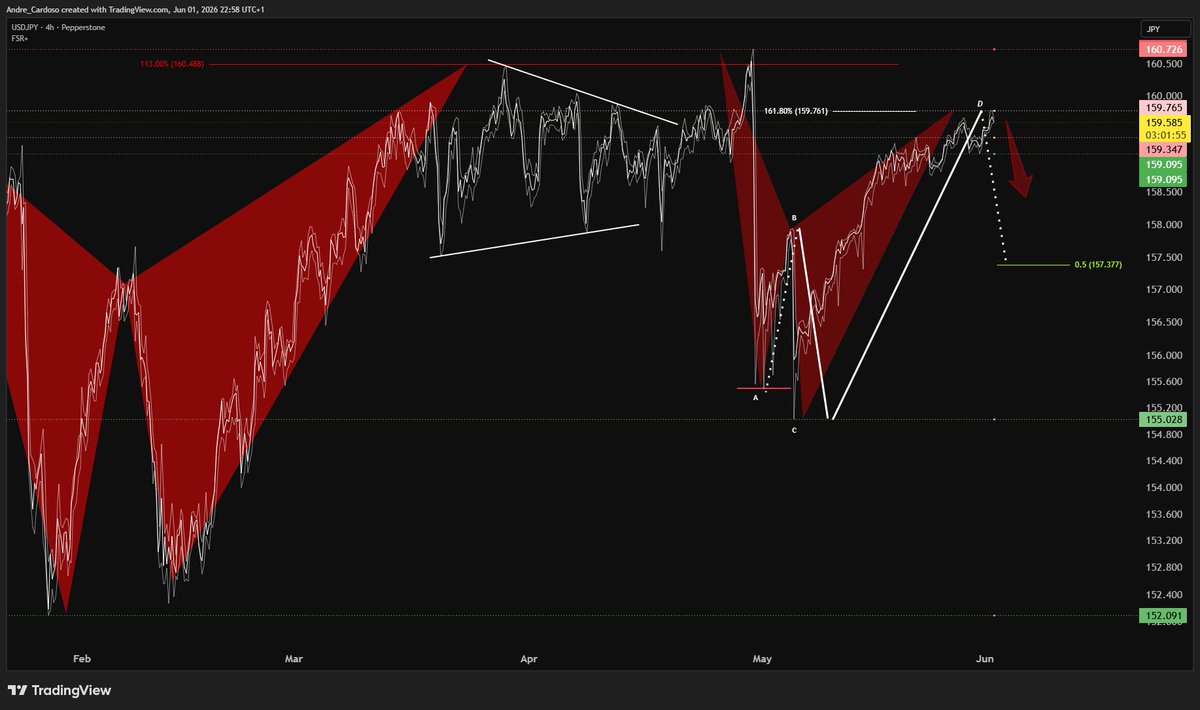
$USDJPY
The Ninja has reached a key harmonic resistance zone.
A new fractal resistance has formed at 159.76, coinciding with the completion of a Bearish Shark pattern at the 161.8% Fibonacci extension.
This setup suggests the potential for a corrective pullback from current levels. Historically, the Bearish Shark pattern tends to target a retracement of approximately 50% of the CD leg, placing the 157.37 area into focus as a key reference level, representing a decline of roughly 1.5% from the harmonic completion zone.
#USDJPY #Forex #tradingpatterns
1
1
358
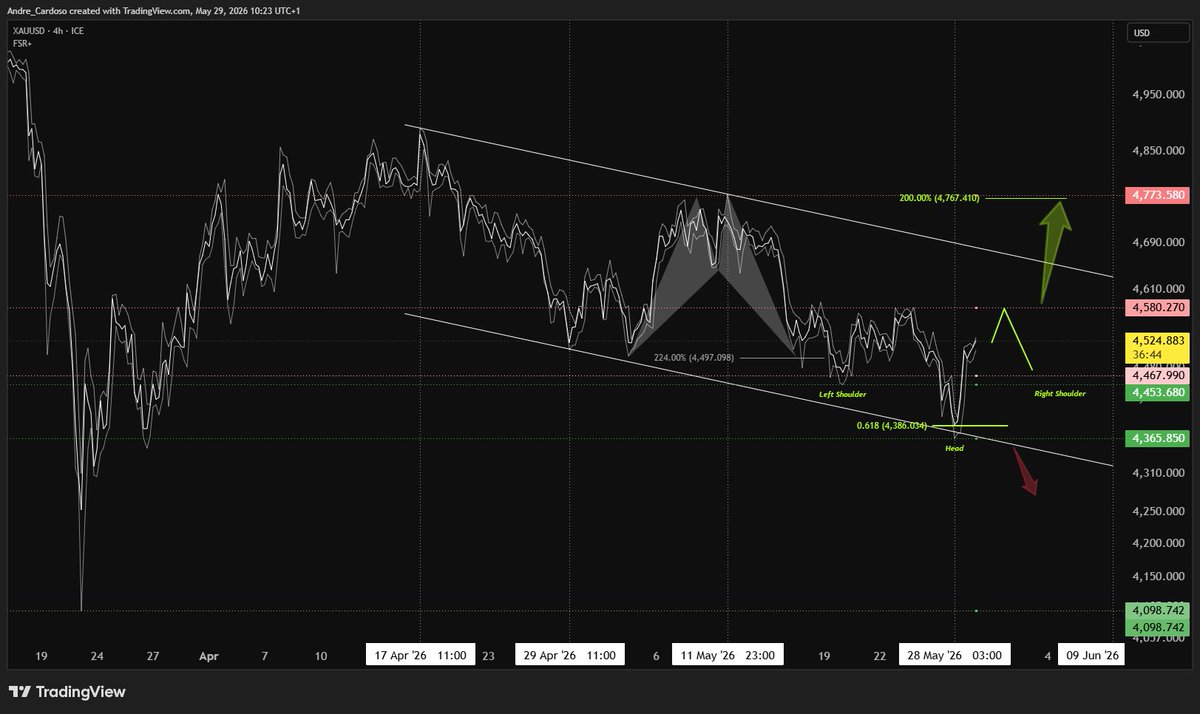
May 29
#Gold is stabilizing after a corrective move, with price action currently holding a key confluence zone between $4,365 and $4,386, where descending channel support meets the 61.8% Fibonacci retracement.
A potential inverted head and shoulders structure is forming, with neckline resistance at $4,580 now acting as the key trigger level.
A confirmed breakout above $4,580 would validate the bullish structure, opening a path toward $4,767 (previosu resistance) #XAUUSD #tradingpatterns
2
1
4
941
May 24
🤣 Melhor forma de acabar a época, forçar a segunda circular a colocar os pés na terra! Parabéns ao S.C.U. Torreense! 😂
282
May 22
The $BUND could potentially form a bearish cypher pattern at $125.61, at the 0.786 Fibonacci retracement level.
It's crucial to be aware of the risk window for the Cypher pattern.
This involves closely monitoring the fractal resistance at $126.11, as a break above this fractal could invalidate the pattern and suggest a continuation of the upward movement.
#Bund #tradingpatterns #harmonicpatterns
309
May 22
Are your trades aligned with the massive harmonic wave sweeping through global markets right now?
🔗 bit.ly/trading-pressure-zone…
Just dropped a comprehensive breakdown of the critical Harmonic Pressure Zones locking in across FX, Crypto, Bonds, and Commodities.
If you are exposed to any of these assets, these exact Fibonacci levels and structural patterns are essential to your strategy:
🪙 Crypto: Is $BTCUSD preparing for a sharp drop to $70,400?
💵 The Dollar & FX Majors: Is the DXY Bearish Bat about to force major reversals on EURUSD, GBPUSD, and AUDUSD?
🔄 FX Crosses: Exact Shark and 5-0 pattern setups developing on NZDUSD, USDCHF, USDCAD, and USDJPY.
📈 Commodities & Bonds: Is Silver (XAGUSD) heading to $82.77, and what does the inverted head & shoulders on Bond Futures (ZN!1) mean for yields?
Stop guessing where the next leg of liquidity is moving. Get the institutional-grade targets, 2618 sequences, and confluence zones before the charts play out.
#Forex #FXTrading #DXY #EURUSD #GBPUSD #AUDUSD #USDJPY #USDCAD #USDCHF #NZDUSD
Harmonic Pressure Zones
A Global Breakdown of Harmonic Setups in FX, Crypto & Commodities
medium.com 2
2
388
May 21
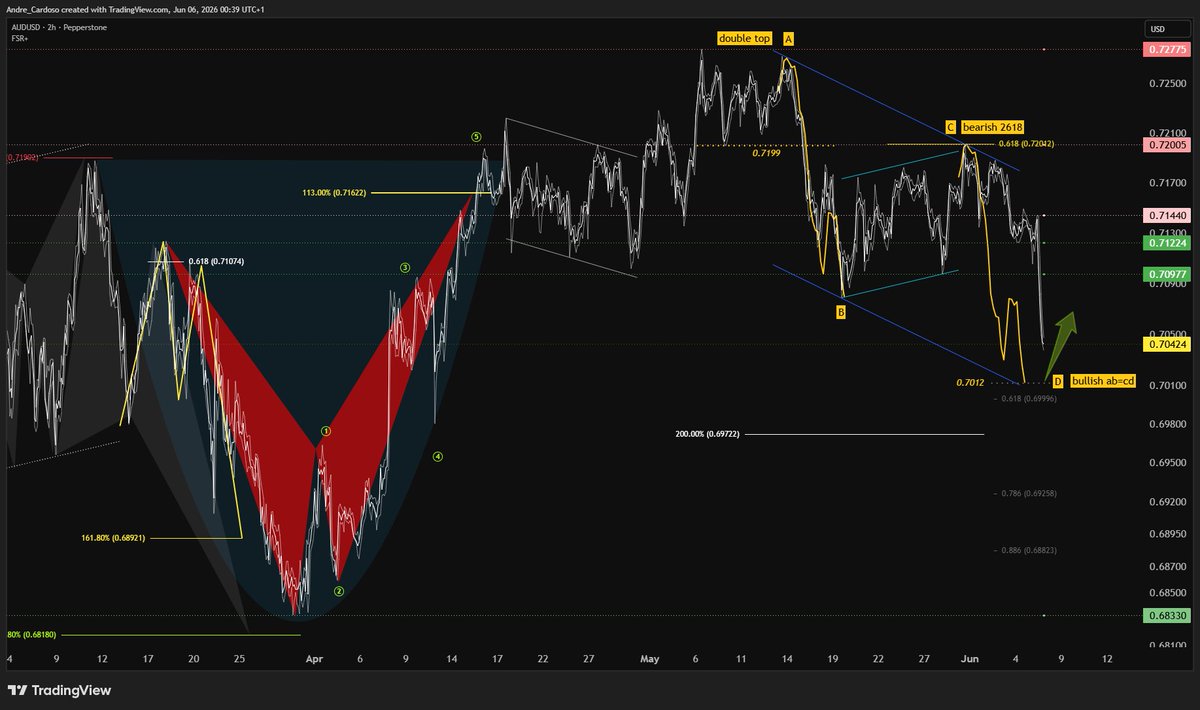
$AUDUSD
The Australian currency pair may form a bearish 2618 pattern, anticipated to complete at 0.7201, coinciding with the 61.8% Fibonacci retracement level.
Essentially, a retest of the neckline and previous support of the double top could present resistance, converging with the 61.8% Fibonacci level, thereby forming the bearish 2618 pattern. (double top followed by the 61.8% retracement)
By default, the bearish 2618 pattern, if fully manifested, anticipates the formation of a bullish AB=CD pattern, which in this instance is projected to 0.7012.
I am also observing the recently formed fractal support at 0.7079, as it could potentially act as the neckline for a head and shoulders pattern formation.
A decline below this fractal, even if the bearish 2618 pattern does not fully materialize, could propel the Aussie down to 0.6772. #AUDUSD #Forex
1
6
443
May 21
$VZ Structure still favors a bearish continuation (AB=CD / harmonic completion toward D $41.70) unless price breaks and holds above resistance zone. #STOCKS #VZ #harmonicpatterns
2
238
May 21
$GFI
The stock continues to hold above the March 19 support at $38.38, potentially favoring a recovery attempt after the recent correction phase.
The broader structure remains corrective within a descending parallel channel from the January highs at $61.64, while a bullish Butterfly harmonic pattern is projected to complete near $35.14.
This region creates a major confluence zone between harmonic support and channel structure.
#GFI #GoldFields #Stocks #TechnicalAnalysis #HarmonicPatterns #GoldStocks #Trading

1
397
May 21
$EBAY continues to show constructive bullish momentum, maintaining a strong upward structure following its recent breakout phase.
The 0 A B C D
However, a bearish Shark harmonic pattern is now developing, with completion projected near the $130 region — the 224% Fibonacci Extension as potential resistance and exhaustion zone.
#EBAY #Stocks #TechnicalAnalysis #HarmonicPatterns #PriceAction #Trading

1
1
203
May 21
$C printed a false breakdown below key support — a price behavior that often precedes resistance breakouts and momentum reversals.
Price action is now stabilizing within what appears to be a potential bullish flag structure, suggesting the corrective phase may be nearing exhaustion.
A confirmed breakout above flag resistance could open the door for the next bullish expansion leg.
#Citigroup #C #Stocks #TechnicalAnalysis #PriceAction #BullFlag #Trading

1
384
May 21
$ADBE is testing long-term support at the lower boundary of the descending parallel channel in place since the November 2021 highs.
Weekly and daily bullish divergences continue to build, while a bullish Alt-Bat pattern completed near $246, aligning with major structural support.
Default harmonic targets point toward the $334 region, implying a potential recovery of roughly 34% from the reversal zone.
#ADBE #Adobe #Stocks #TechnicalAnalysis #HarmonicPatterns #PriceAction #Trading

208
May 21
$AAPL continues to push into major harmonic and Fibonacci territory.
A bearish Butterfly pattern (127% fib ext.) is completing near $302, while the extended bearish Crab pattern (161.8% fib ext.) is projected to complete at $320 price zone.
#AAPL #Stocks #TechnicalAnalysis #HarmonicPatterns #PriceAction #Trading #Apple

1
3
282