
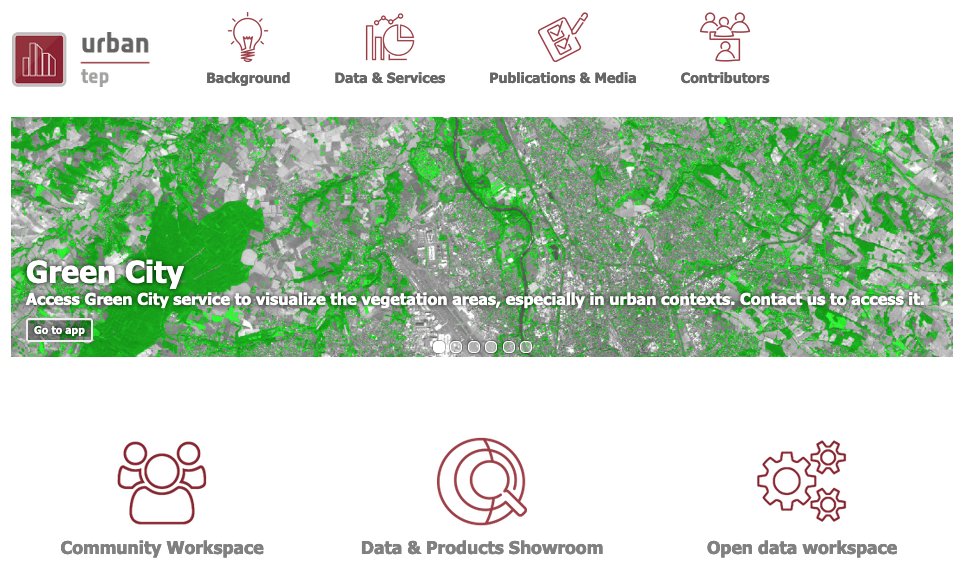
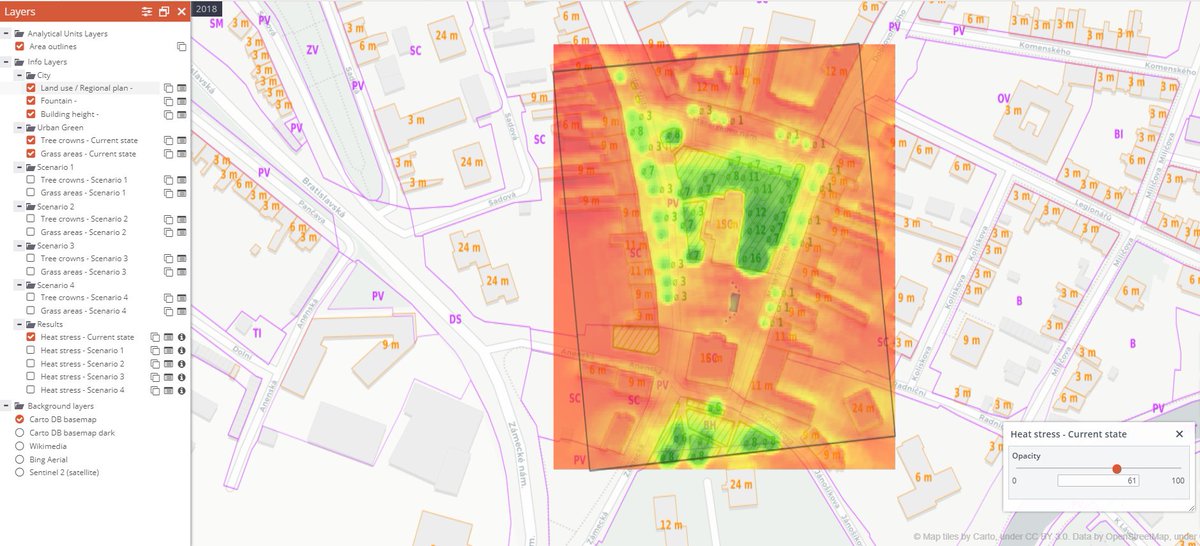
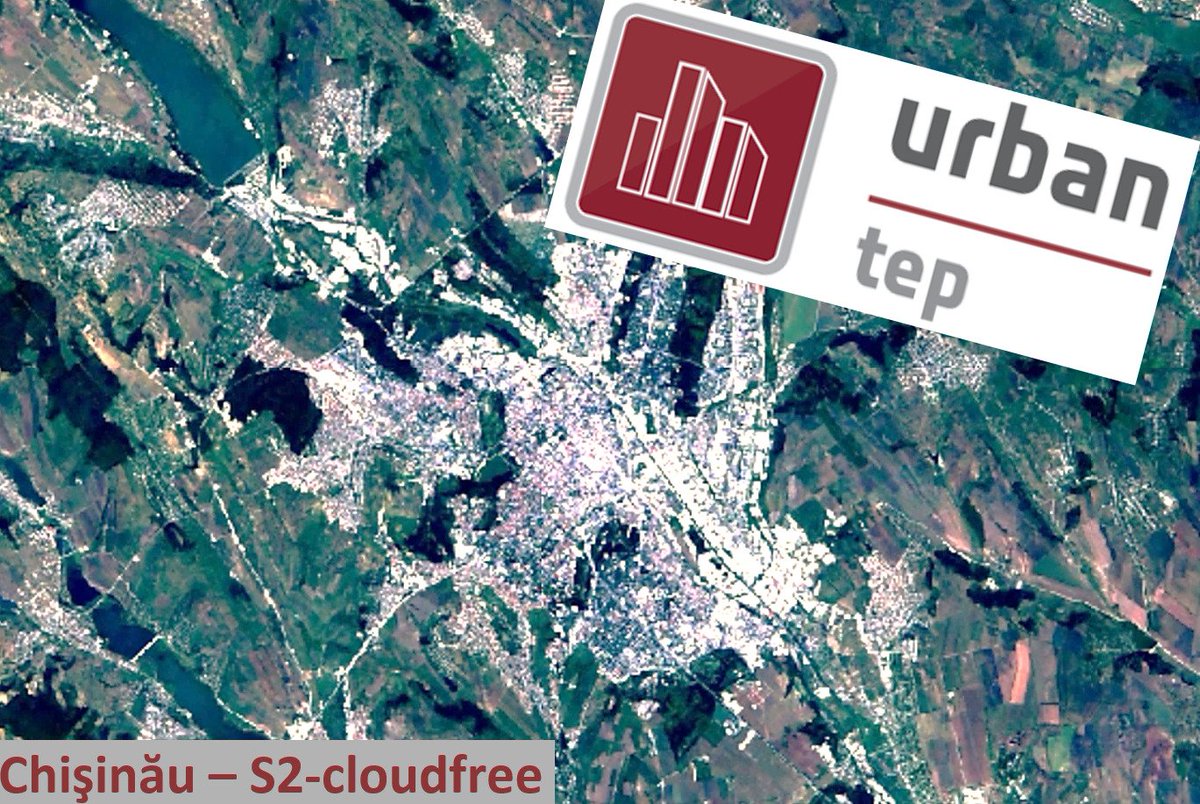
The Urban TEP is a web-based platform allowing users to effectively monitor urban areas by means of EO and auxiliary data.
Joined June 2016
- Tweets 109
- Following 73
- Followers 153
- Likes 116
31 Photos and videos


Already at Episode 6 of @terradue's #AI/#ML showcases, demonstrating enhancements for both the Geohazards Exploitation Platform (@geohazards_tep) and the Urban Thematic Exploitation Platform (U-TEP)

Episode 6 of the AI/ML series is out !
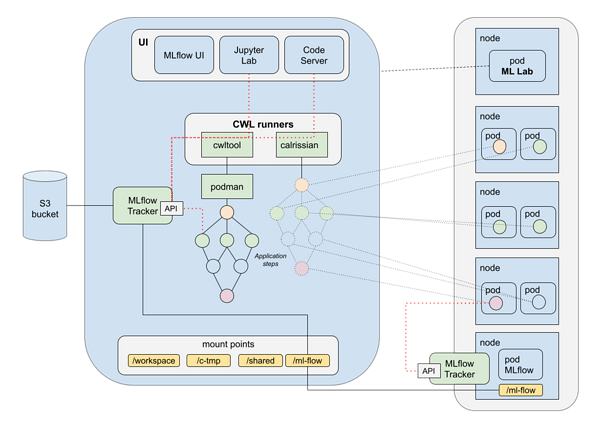
Developing EO Application Packages, using the Common Workflow Language (CWL) as described in the @opengeospatial best practice document.
It involves CWL runner for Kubernetes & MLflow to track experiments.
discuss.terradue.com/t/1188/…
13
UrbanTEP retweeted

21 Jul 2024
We are currently accepting submissions for peer-reviewed sessions: lps25.esa.int
@esa's Living Planet Symposium happens only every 3 years and we are working to make it THE EO conference of 2025 😎
Tell your colleagues!
#LPS25

15
35
3,827

Terradue is providing Technical Assistance to the CopernicusLAC Panama Centre.
This centre will enhance regional decision-making with advanced Earth Observation services, focusing on environmental management, agriculture, and urban planning.
linkedin.com/feed/update/urn…
3
82
AI/ML Enhancement Project - Labeling EO Data (User Scenario 2)
Labeling different features within data is a crucial step in the process for developing supervised Machine Learning (ML) models.
discuss.terradue.com/t/1188/…
1
4
1
103
Insights into the application of #MachineLearning and #DeepLearning techniques for interpreting Earth Observation (EO) data.
Summer school @LIST_Luxembourg
June 10-12, 2024
list.lu/en/event/summer-scho…
3
114
Happy to see #AI/#ML showcases defined for monitoring urban heat patterns, preventing flooding in urban areas, and dealing with challenges posed by informal settlements.
On the blog: AI/ML Enhancement Project - Progress Update
New set of Cloud-based environment and tools now available for AI/ML users to work with EO data & data labels
discuss.terradue.com/t/1188/…
3
2
101
On the blog: UrbanTEP offering expands to include City Data Cubes and ESA sponsorship
discuss.terradue.com/t/1231
1
1
76
UrbanTEP retweeted

22 Nov 2023
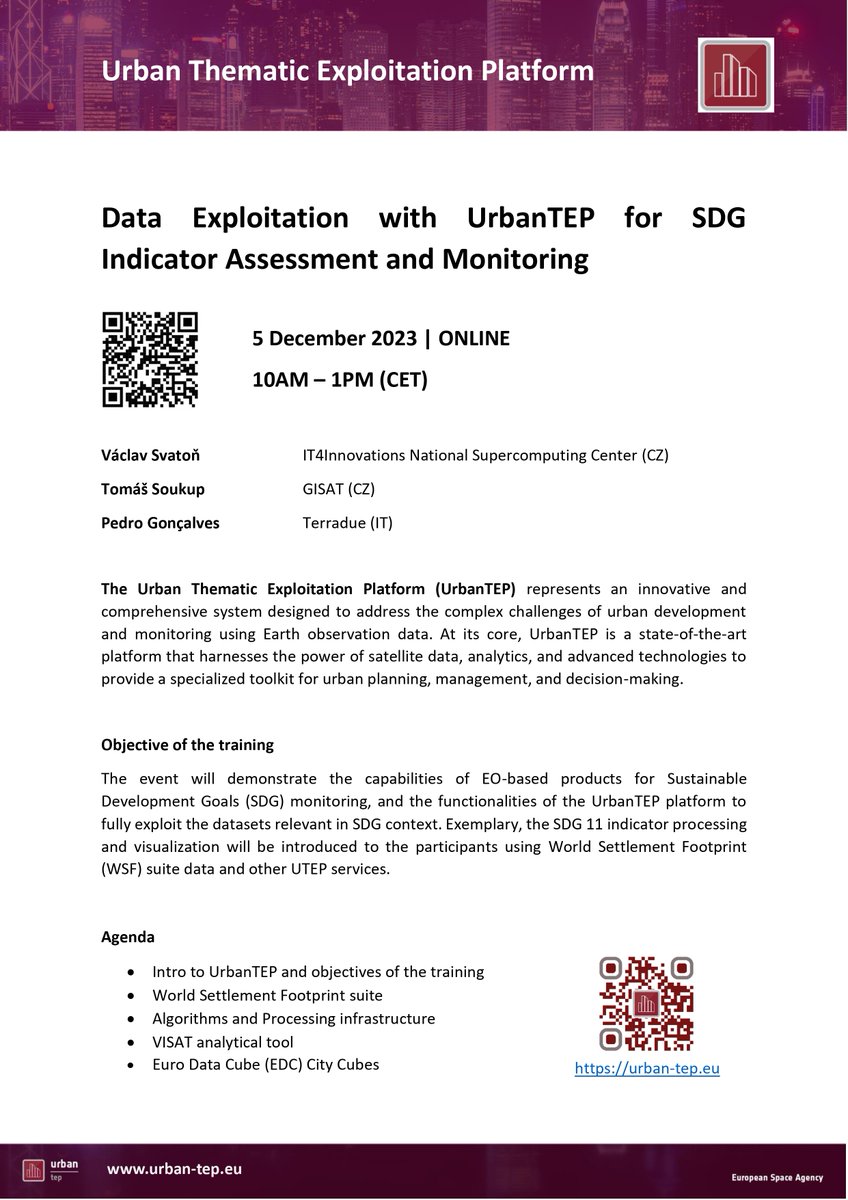
💡 Online course on Data Exploitation with @UrbanTEP for SDG Indicator Assessment & Monitoring! 🌍
📅 December 5, 10 am - 1 pm
Tutors: Václav Svatoň from IT4I, Tomáš Soukup from @Gisat_cz, and Pedro Pereira Gonçalves from @terradue
More ℹ️ & REG🔗events.it4i.cz/event/207/ @esa
3
1
236
On the Blog: free online EO Training event, for SDG Indicator Assessment & Monitoring
Dec. 5th 2023, 10:00 am - 1:00 pm CET
Agenda & registration:
discuss.terradue.com/t/1225
1
112
UrbanTEP retweeted
9 Nov 2023
Large urban areas are often marred by nitrogen dioxide pollution, caused mainly by traffic and industrial burning of fossil fuels.
Data delivered by @CopernicusEU #Sentinel5P have recently enabled scientists to estimate surface-level nitrogen dioxide concentrations in Finland: sentinels.copernicus.eu/fi/w…

ALT Graphics mapping NO2 tropospheric column (molecules/cm2) during weekdays (left) and weekends (right). Colour scale ranges from dark blue (lower values) to dark red (higher values). Urban Helsinki shows a drop in pollutants during weekends. Copyright: ESA, Ialongo et al.
1
7
25
6,789
UrbanTEP retweeted

7 Nov 2023
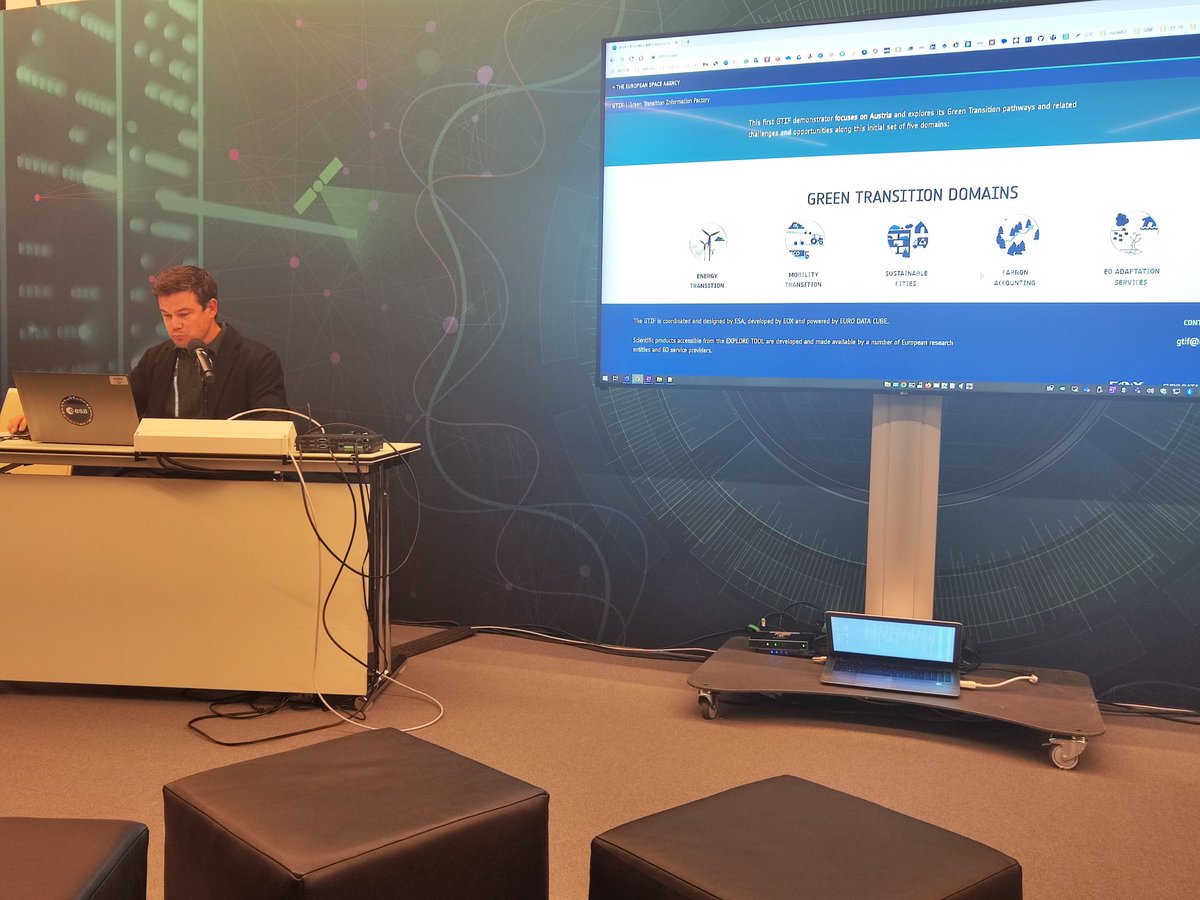
The new interface of #GTIF, the Green Transition Information Factory has been released!
@pdgriffiths81 is showcasing how this tool can be used to accelerate the Green Transition of society and economy at #BiDS23 Demo area
Explore it yourself!
🔗gtif.esa.int

3
3
593
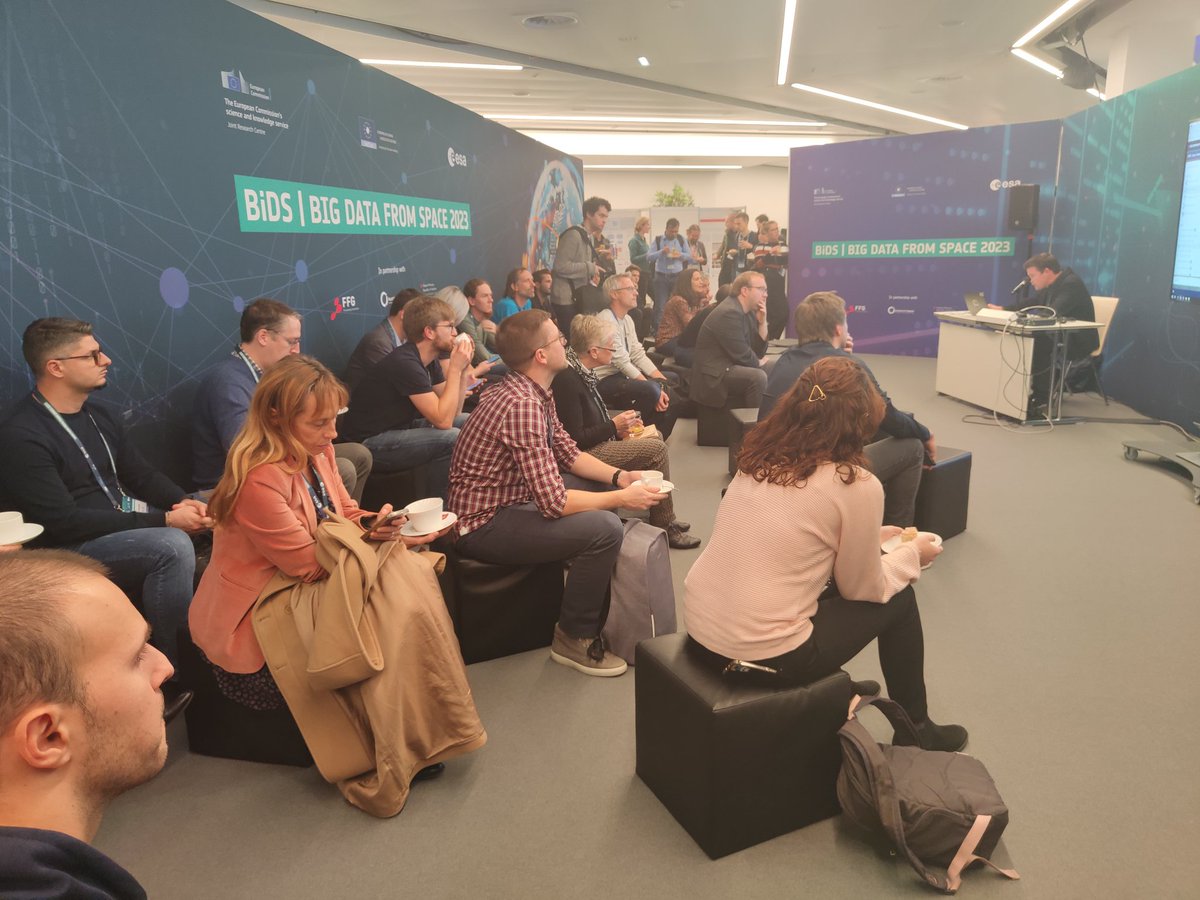
Join us at Booth #10 this week in Vienna, #BiDS23
We'll demo our Cloud services for EO data processing
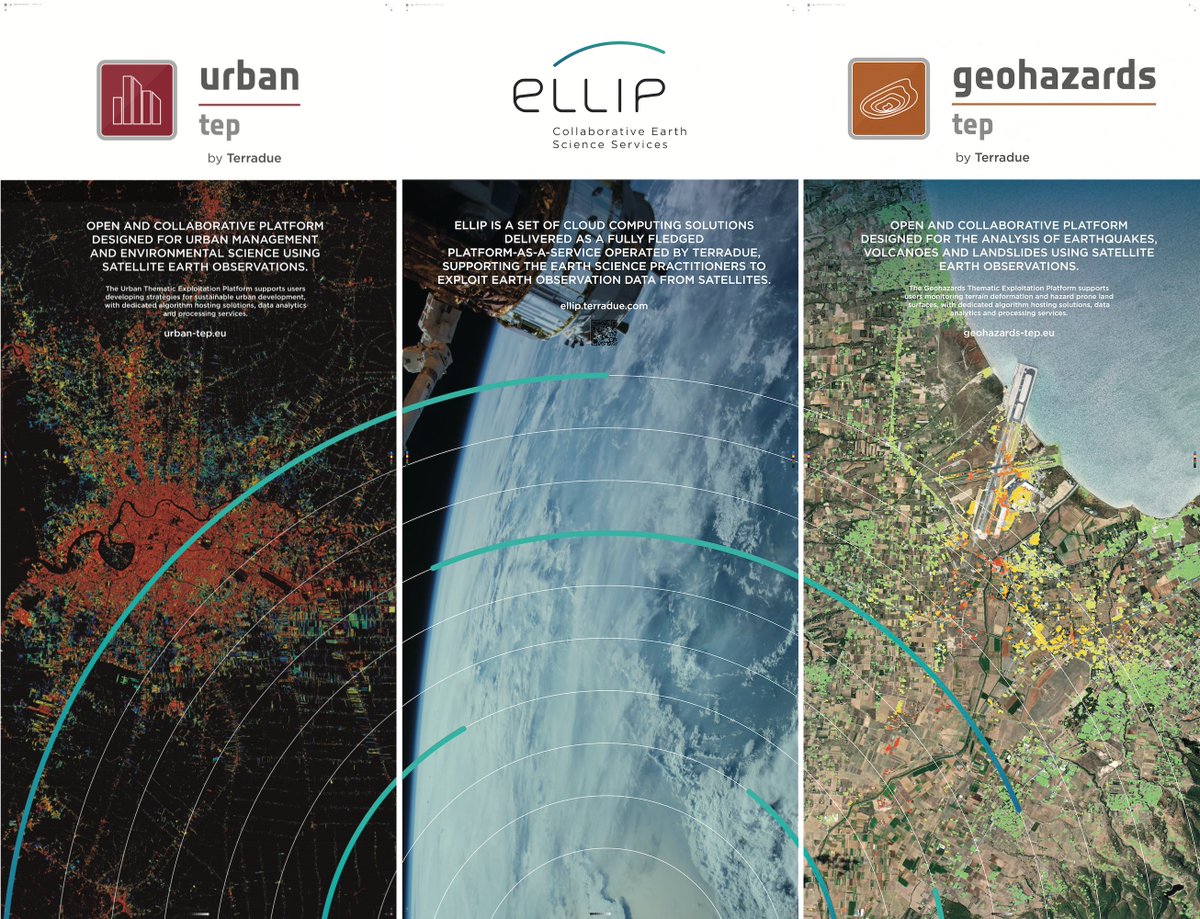
Platform-as-a-Service (PaaS) solution for builders of EO applications ellip.terradue.com
Ellip-powered workspaces urban-tep.eu and geohazards-tep.eu
6
3
675
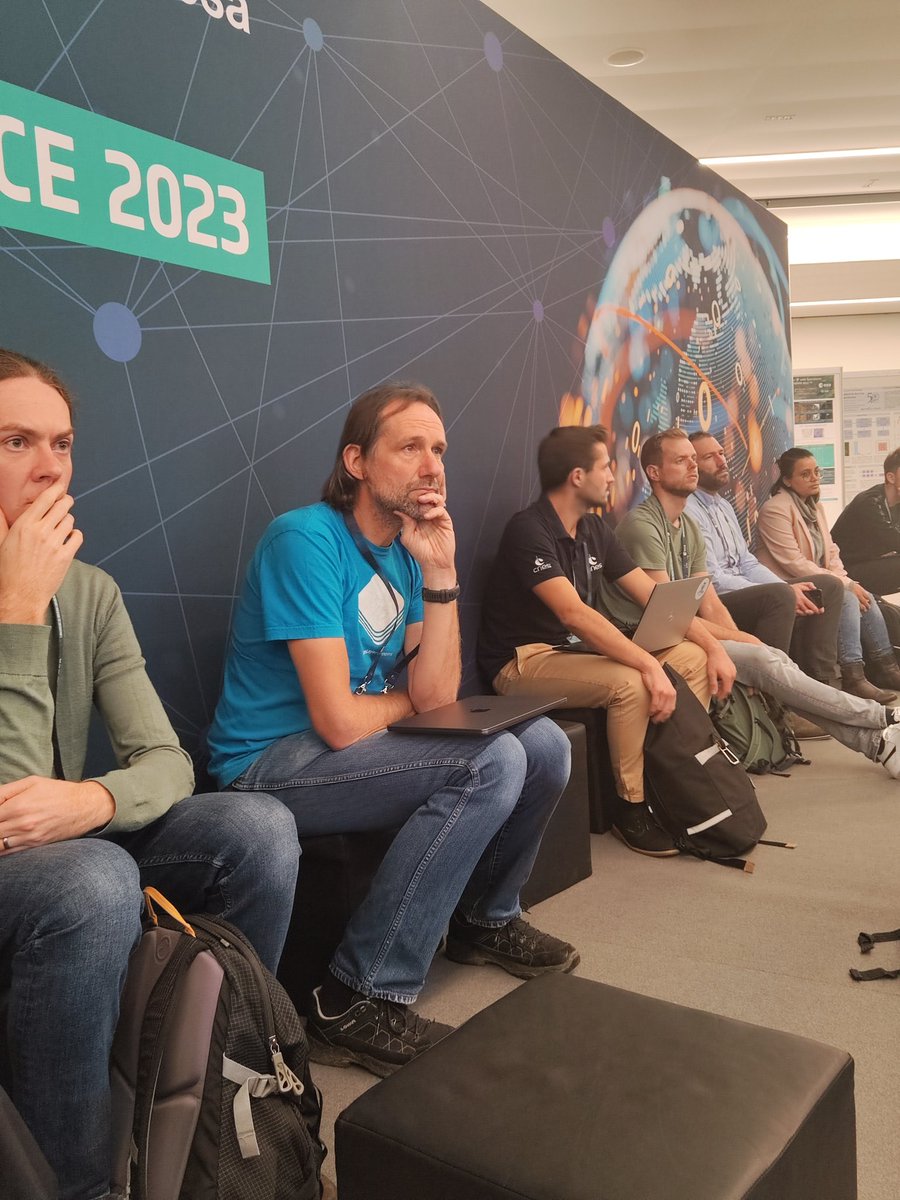
Meet us this week at #BIDS23 in Vienna
We'll demo @ellip_global, @geohazards_tep, @UrbanTEP at our booth.
Also today starting 16:00 we'll host two special events:
☑️ Mastering Earth observation application packaging with @commonwl
☑️ Open & Reproducible workflows in EO

ALT https://www.bigdatafromspace2023.org
5
5
481
UrbanTEP retweeted

14 Sep 2023
Sentinel-1 reveals shifts from Morocco earthquake:
- help emergency response teams on the ground
- support further scientific research
@DisastersChart @geohazards_tep
@ESA_EO
@CopernicusEU @CopernicusEMS
@NERC_COMET
esa.int/Applications/Observi…
5
1
745
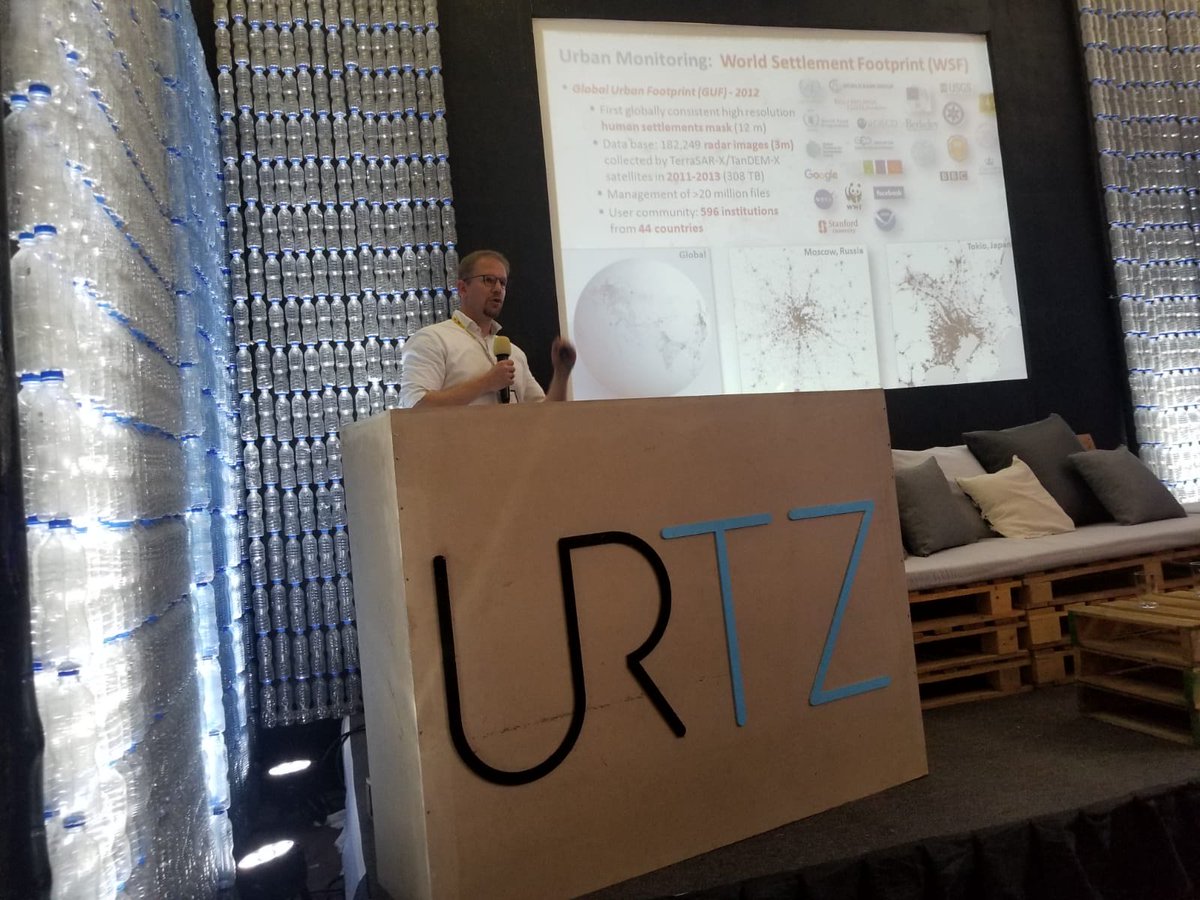
Congratulations to our @DLR_en colleagues for releasing the new version of the World Settlement Footprint (WSF2019) and the WSF Evolution, providing information on global human settlements with unprecedented detail
esa.int/Applications/Observi…
#urban #RemoteSensing
2
3
UrbanTEP retweeted

9 Sep 2021
#EarthObservation is🔑for #FoodSecurity, #disaster risk reduction, #ecosystems monitoring &➕
Join our annual event to learn how #EuroGEO supports the #EUGreenDeal by contributing to well-informed decisions & discuss opportunities for the future
#EGW2021 europa.eu/!rVbgDk

12
16
UrbanTEP retweeted
15 Feb 2021
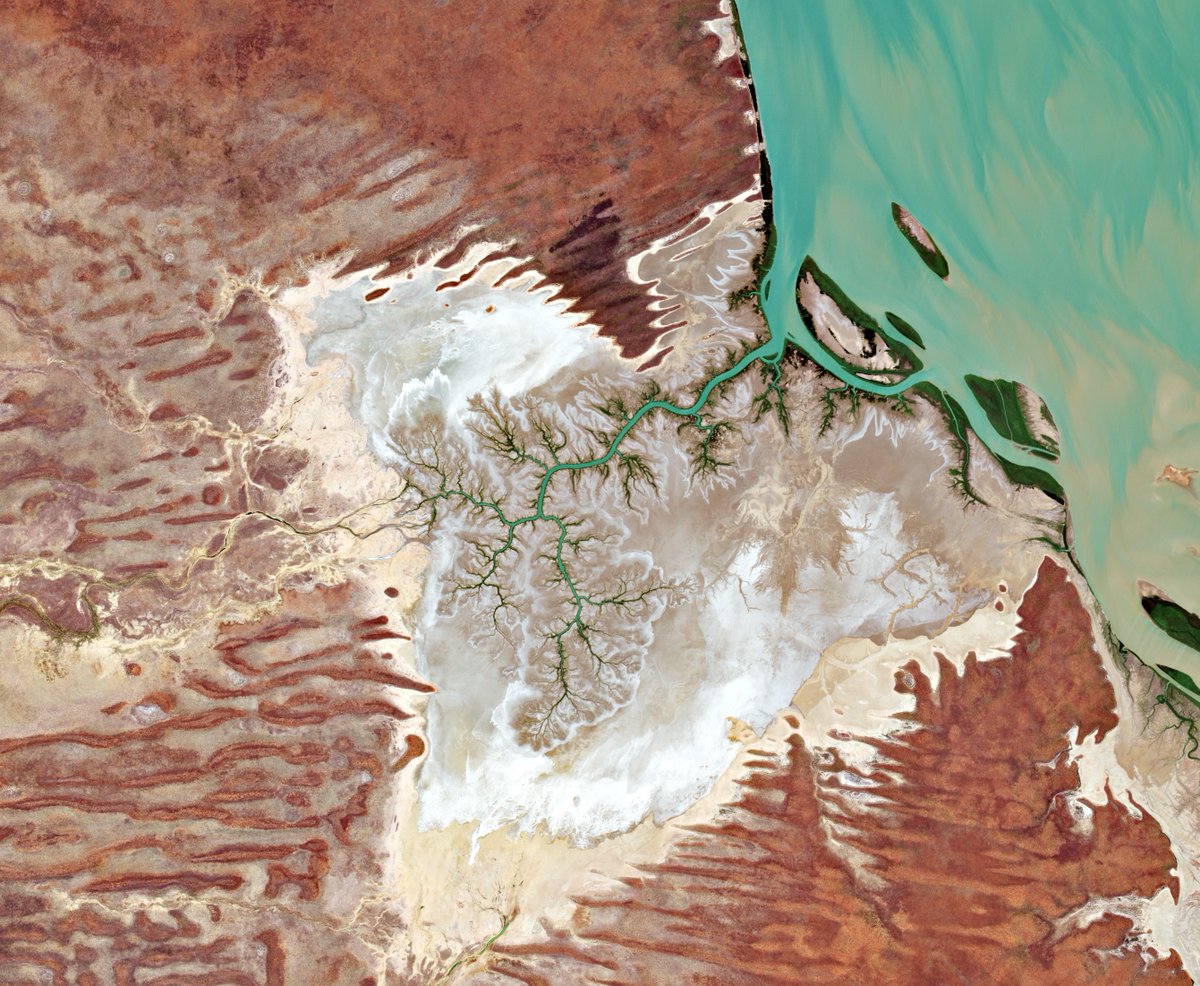
#DYK that #Australia is surrounded by around 11 000 km of mangrove-lined coast?
As more people move closer to coastal zones, the risk to mangroves increases: dumping of waste, fish farming, sea level rise and climate change all contribute to destroying mangrove's ecosystems.
13
53
UrbanTEP retweeted
12 Jan 2021
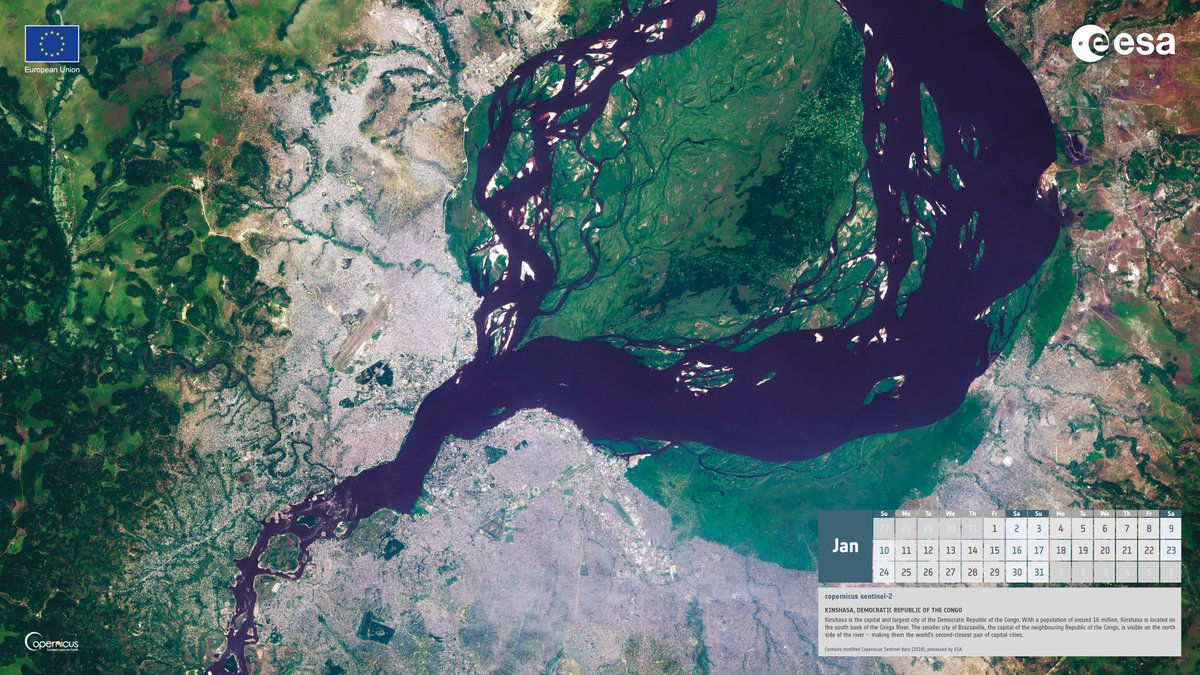
Download the 2021 Copernicus Sentinels calendar🛰️
Each month offers a spectacular view of our home planet captured by one of the Sentinel satellites.
This year the calendar focuses on megacities!
➡️esa.int/Applications/Observi…
13
84

Aquakulturen liefern fast die Hälfte aller Speisefische weltweit. Das Wachstum des Sektors belastet die Ökosysteme, wie hier im Pearl River Delta in China. Eine Methode unseres Earth Observation Center macht das sichtbar. Mithilfe von #Sentinel1 Satellitendaten 🛰️
#GlobalerWandel
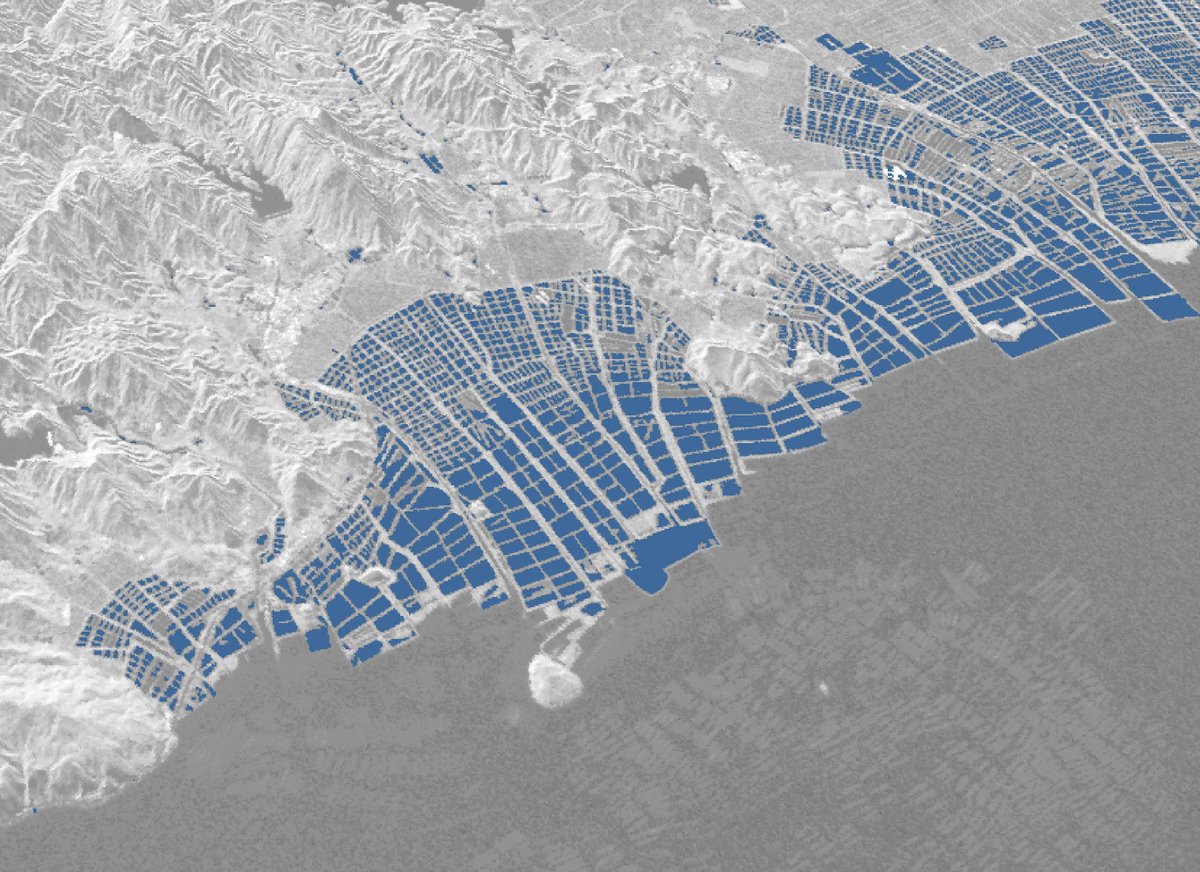
ALT Credit: Sentinel-1 data processed by DLR
1
10
32
UrbanTEP retweeted

📢 We have recently released several new Functional Urban Area #FUA for the following #CLMS products
🟥Urban Atlas 2018
🟩Urban Atlas 2012 – Revised
🟦Urban Atlas Change 2012-2018
🟨Street Tree Layer 2018
More 👉e.copernicus.eu/UrbanAtlas_n…

6
17