
Insight and tools for long-range forecasting: objective seasonal and subseasonal prediction. Tweets by Prescient Weather cofounder Richard James, PhD
Joined January 2018
- Tweets 2,487
- Following 1,048
- Followers 9,748
- Likes 12,604
1,392 Photos and videos


Pinned Tweet

March, April, and perhaps even May monthly records will fall next week in the historic western U.S. heat wave.
Here's a tool to query ERA5 monthly/annual records for a few variables
s2s.worldclimateservice.com/…

7
31
183
63,413
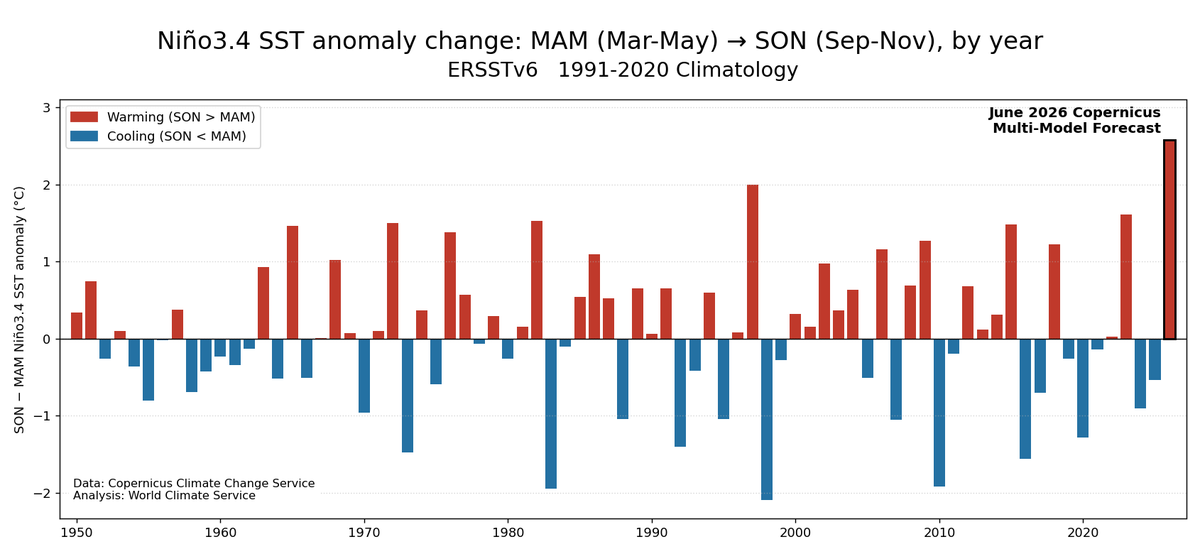
It's hard to overstate how remarkably the @CopernicusECMWF C3S models have escalated their forecasts for El Niño.
For example, the 6-month Niño3.4 warming ending Sep-Nov is expected to far exceed 1997 - and 1997 was previously an outlier by this metric.
3
20
111
24,220
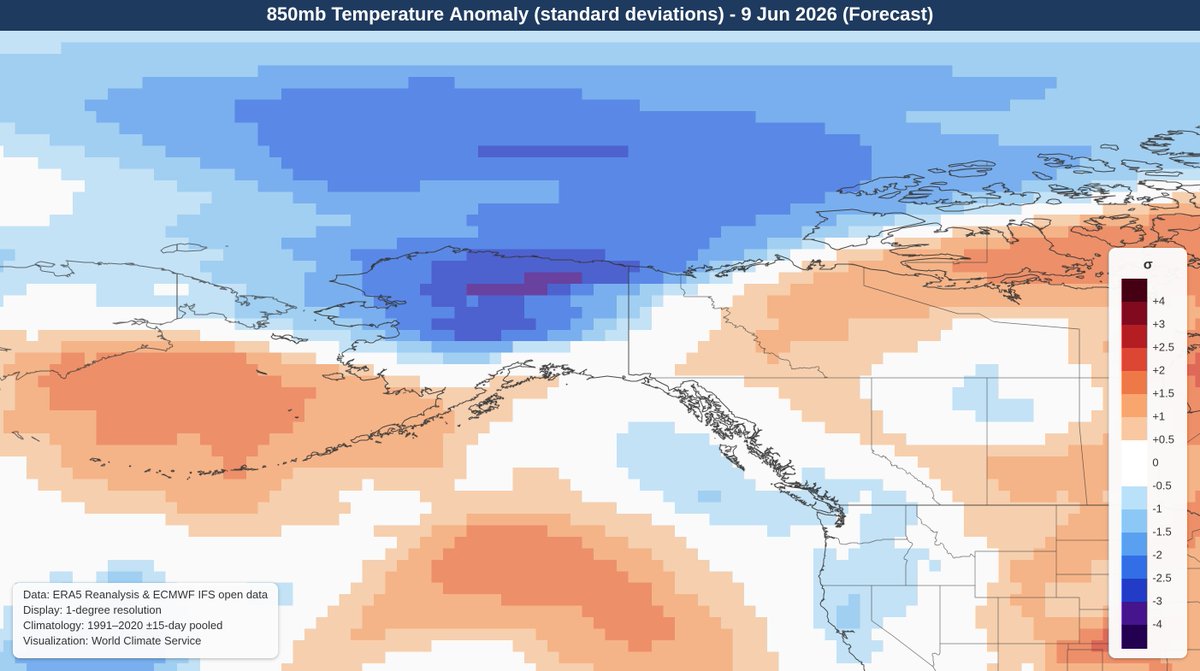
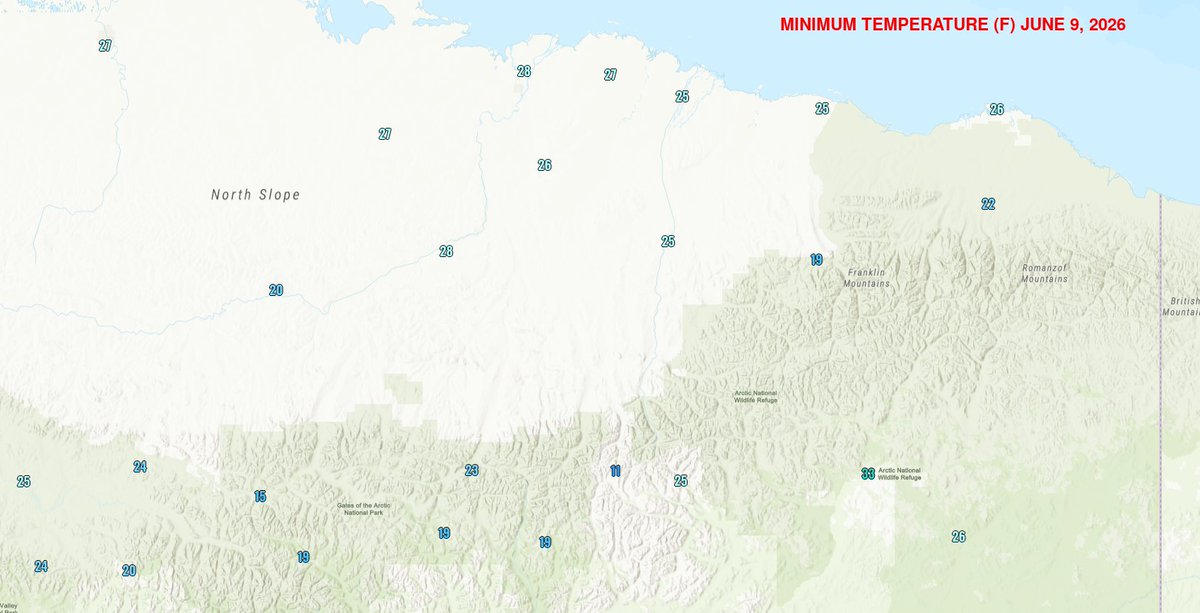
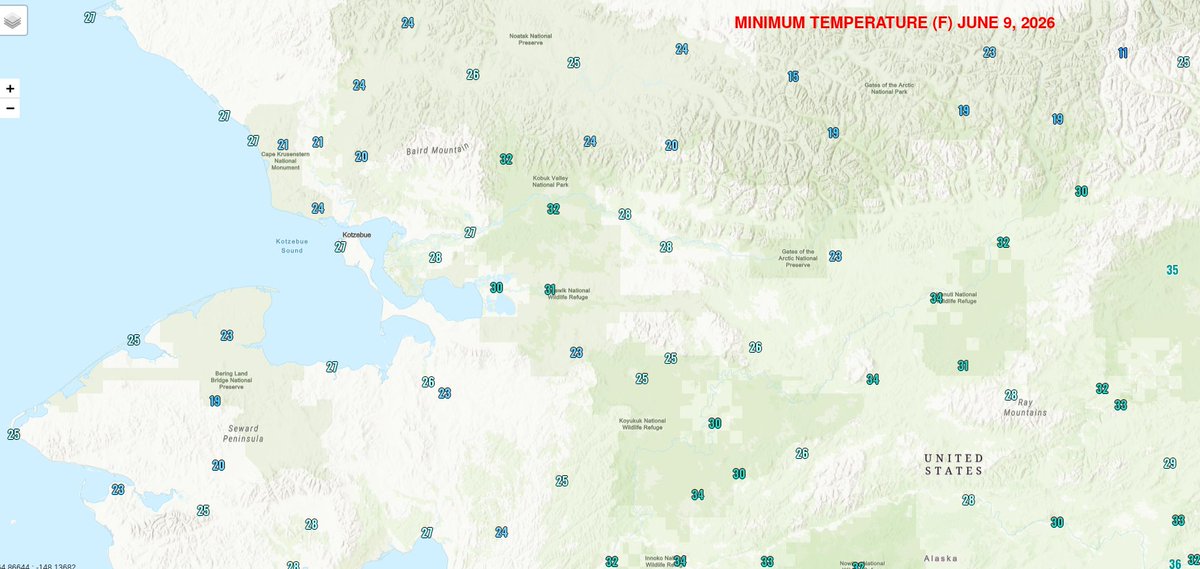
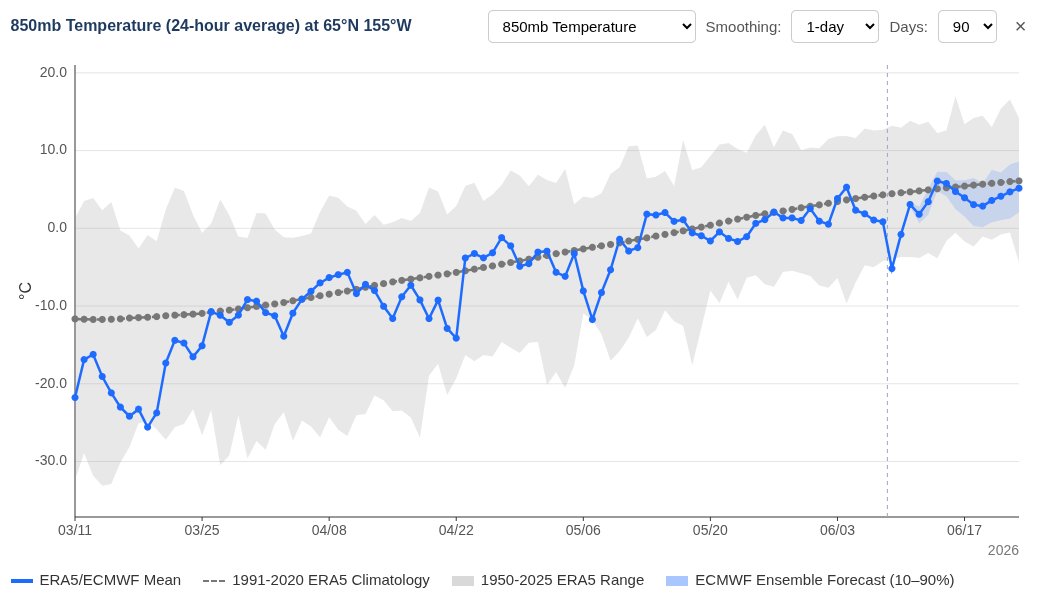
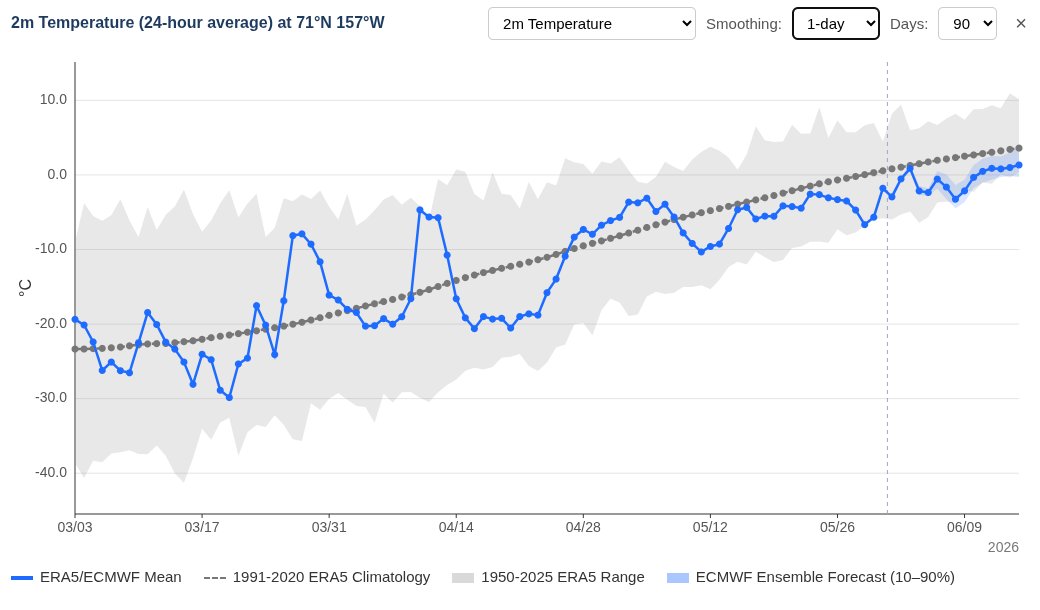
Alaska's chilly spring continues - widespread frost and freeze this morning across the interior and north. Date-record low 850mb temperatures for the North Slope, Brooks Range, and western interior
2
6
25
1,910
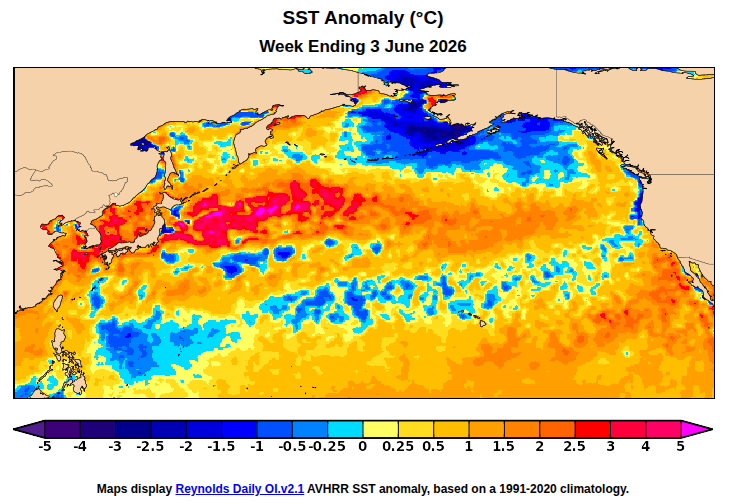
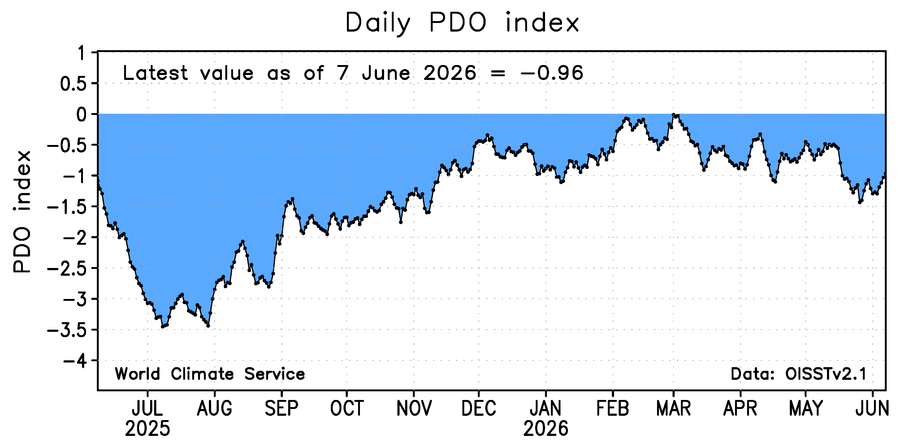
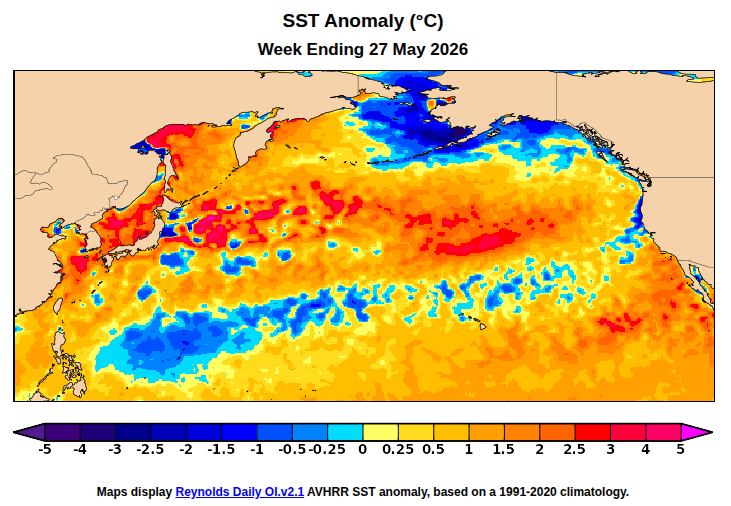
Impressively cool SSTs in the eastern Bering Sea. Negative PDO persisting.
1
2
16
2,544
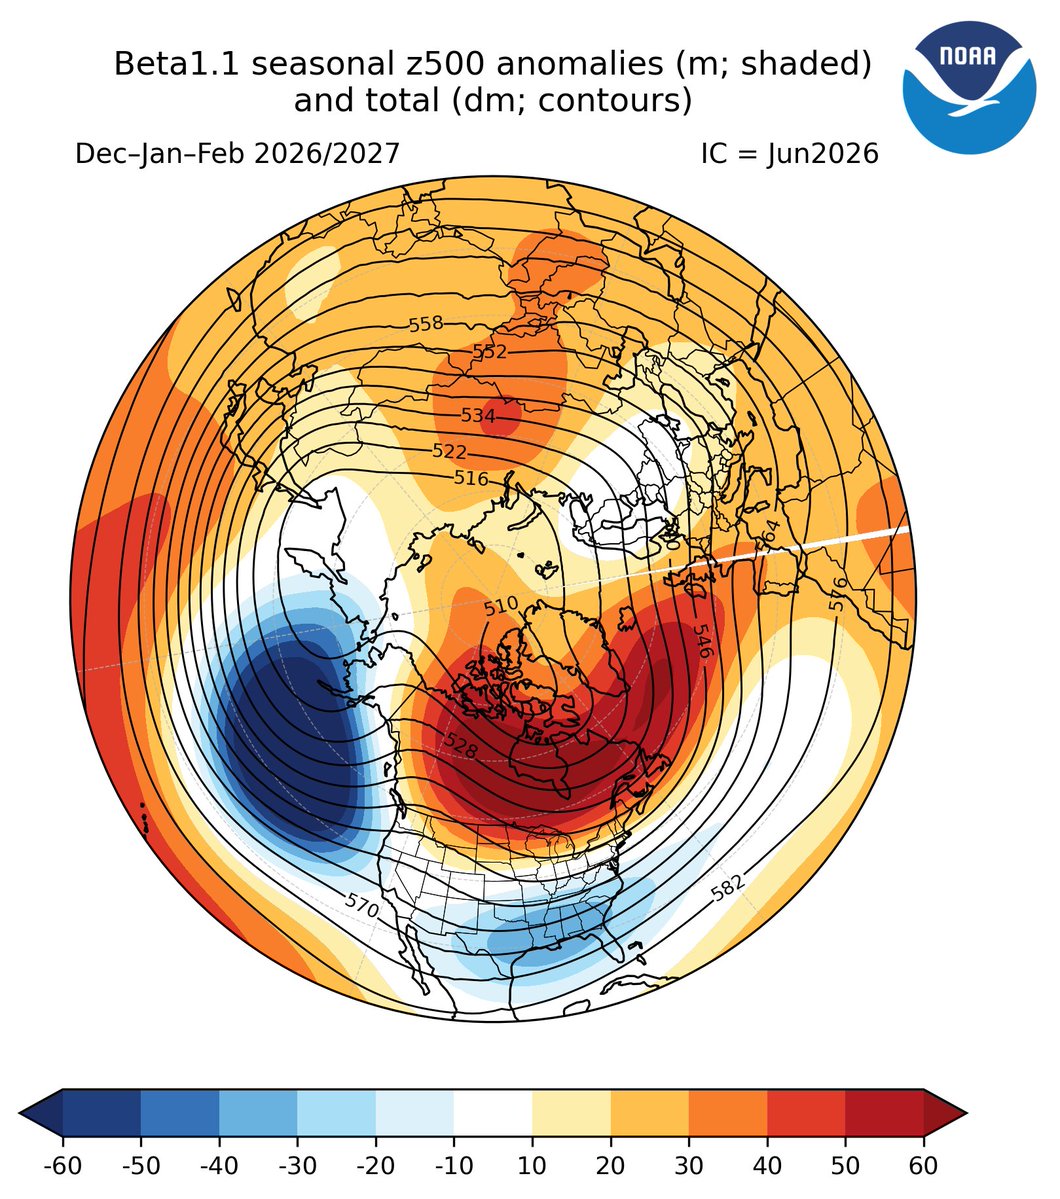
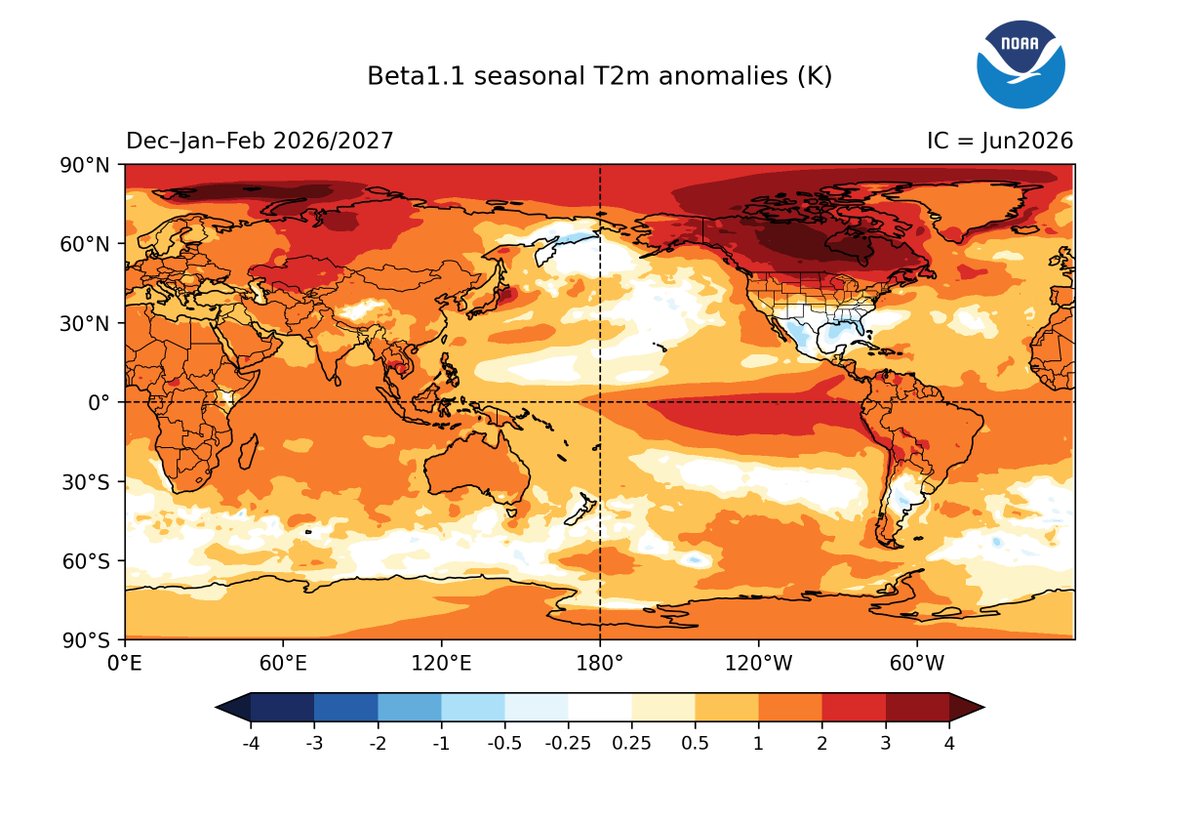
A few figures from NOAA's beta SFS model (CFSv2 replacement), June 1st initialization.
Not quite as dramatic as CFSv2 and ECMWF for El Niño SSTs, but major El Niño impacts for winter regardless

4
20
98
7,721
Climate curiosity: Utqiaġvik (formerly Barrow) Alaska has not yet reached 32°F/0°C this year, the latest since at least 1955.
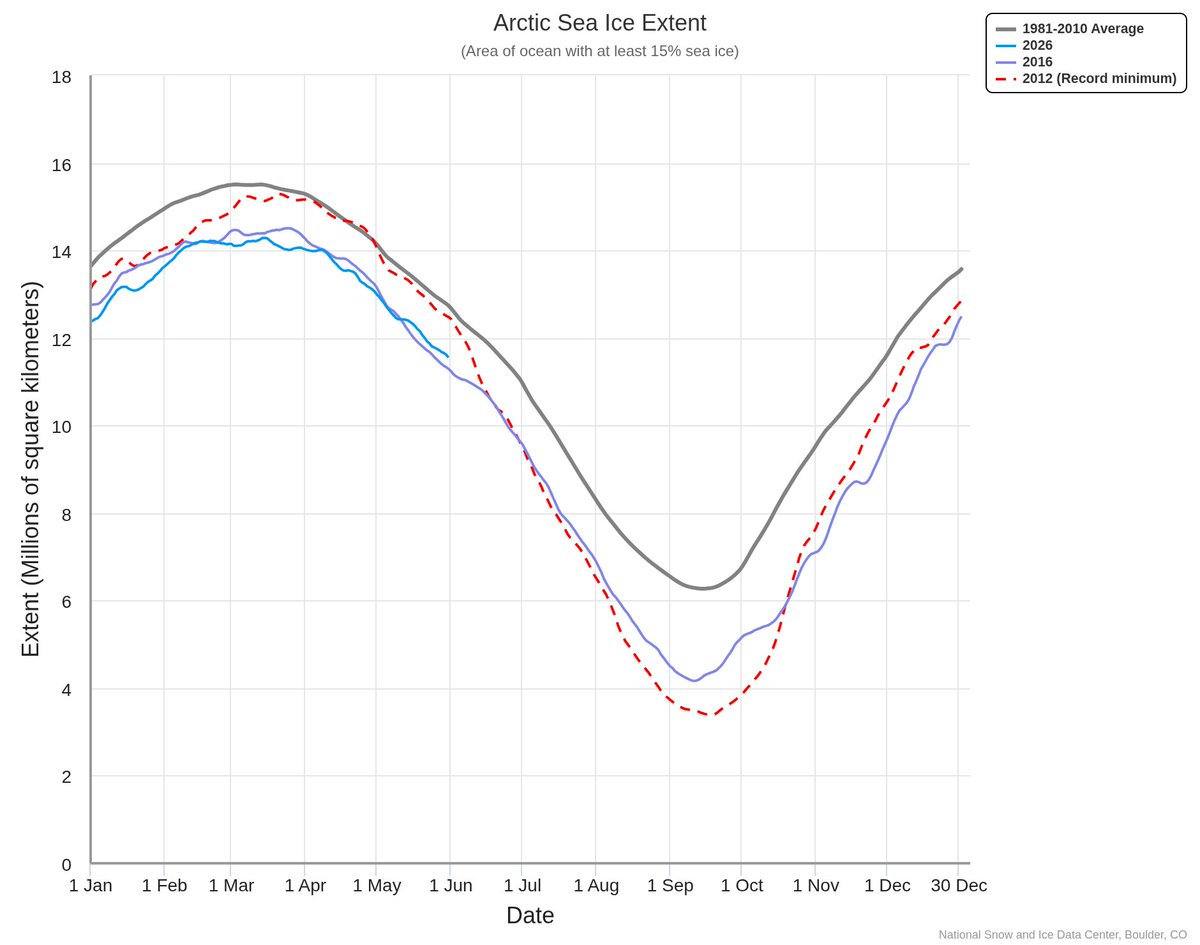
The month of May was notably cooler than normal over Alaska and the Arctic Ocean to the north, yet Arctic-wide sea ice extent remains near a record low.
1
3
19
1,103
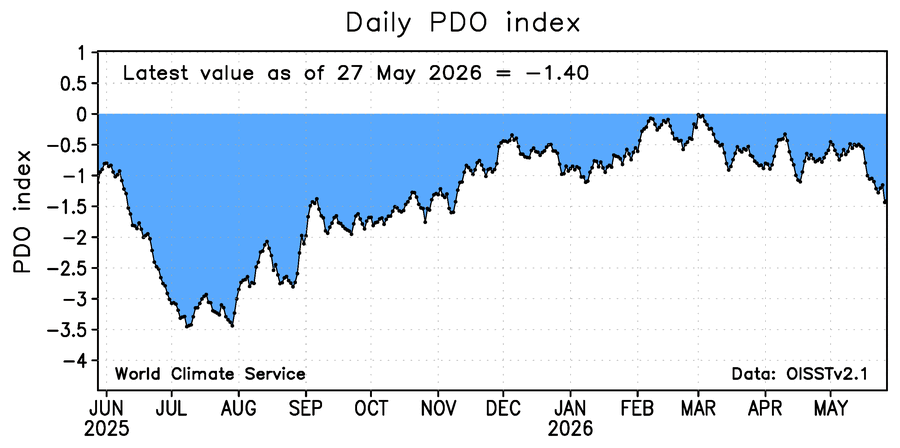
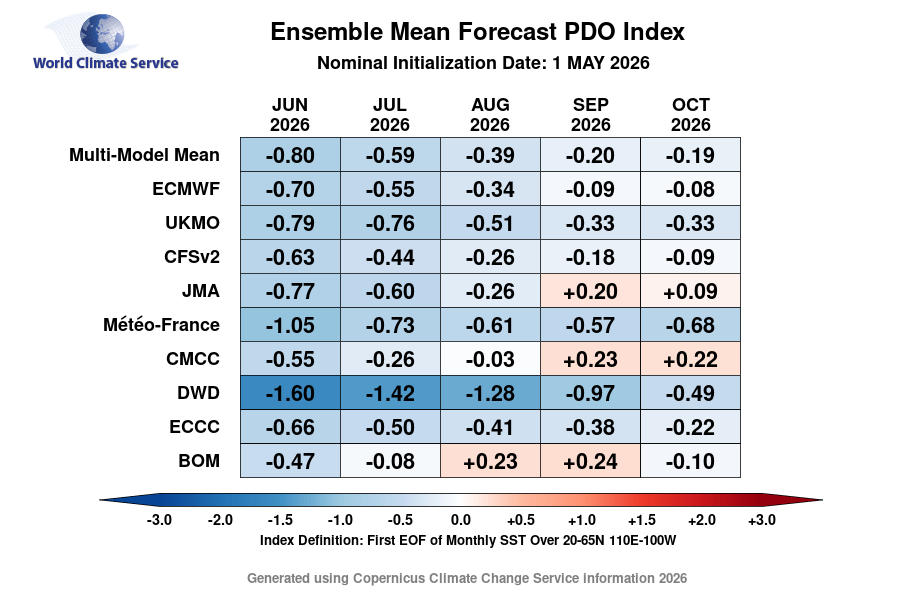
Interesting to see the PDO drifting back into more significantly negative territory.
The seasonal models have been trending in the opposite direction with some hints of a positive phase by autumn - but that seems less likely now.
8
8
56
5,737
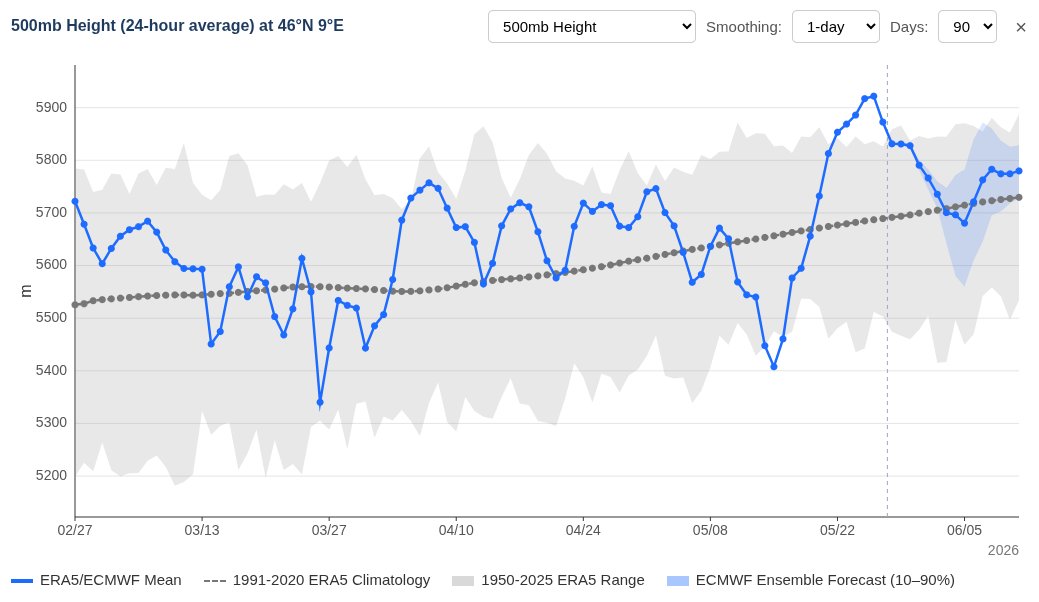
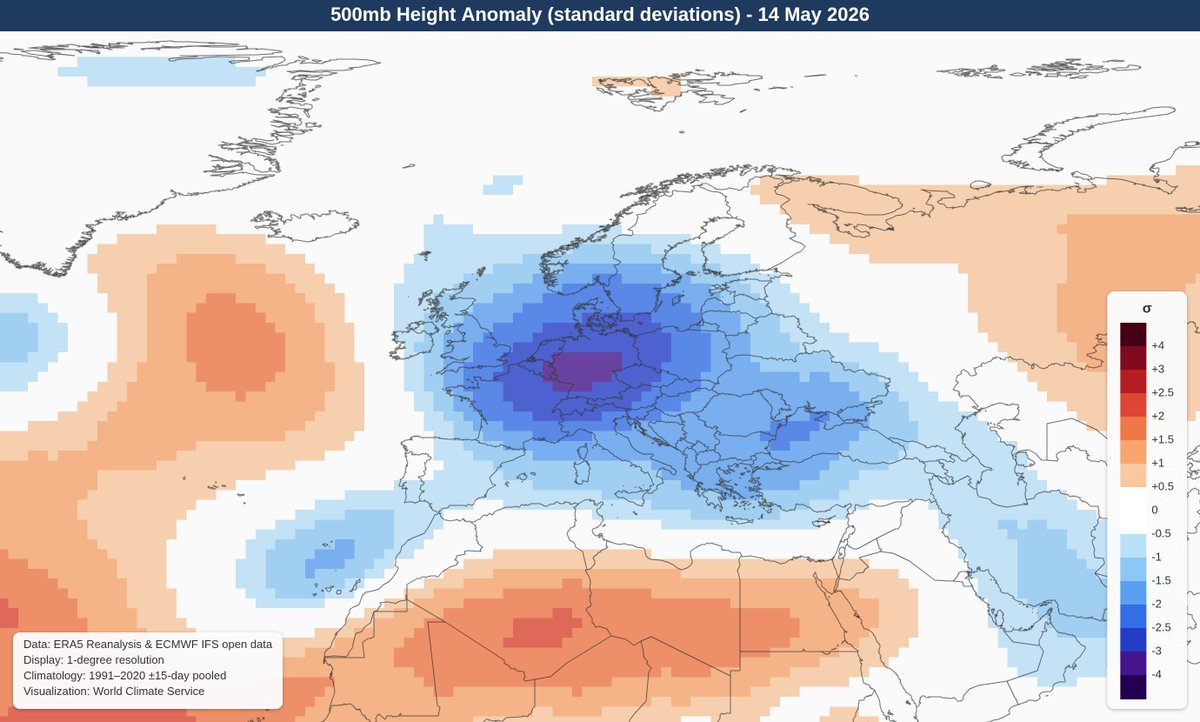
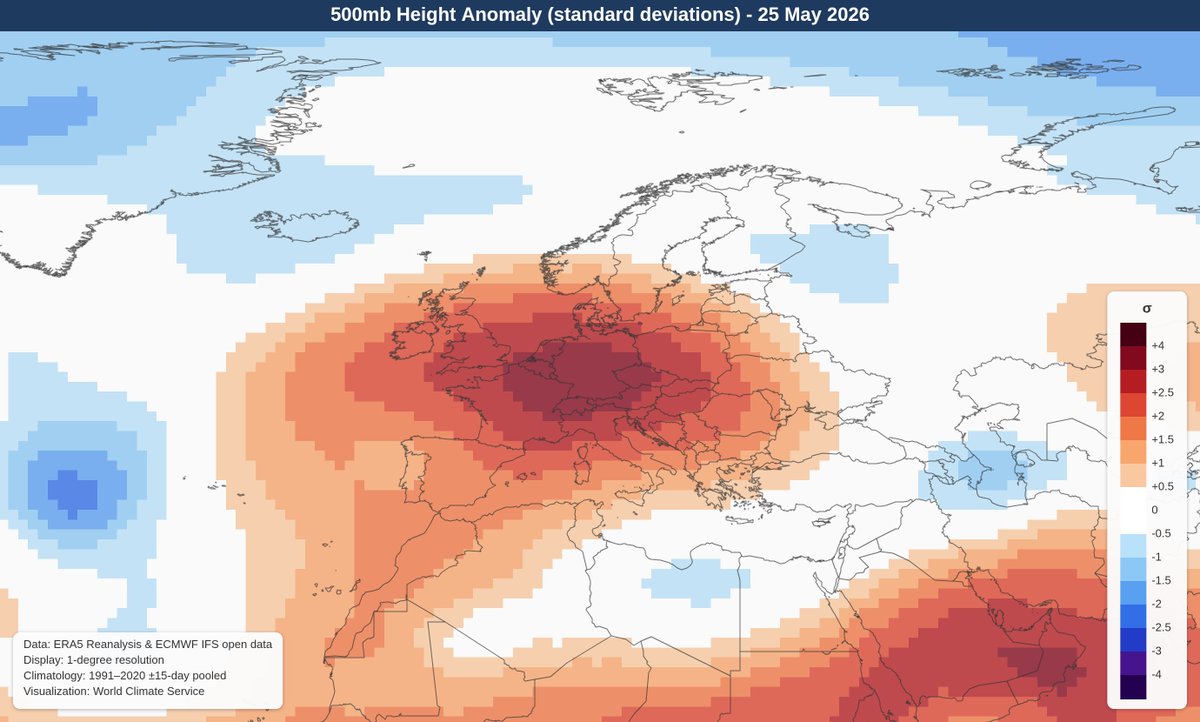
Western/central Europe just saw 500mb heights go from record lows to monthly record highs over a 10-day period.
Remarkable "weather whiplash"
3
10
57
6,059
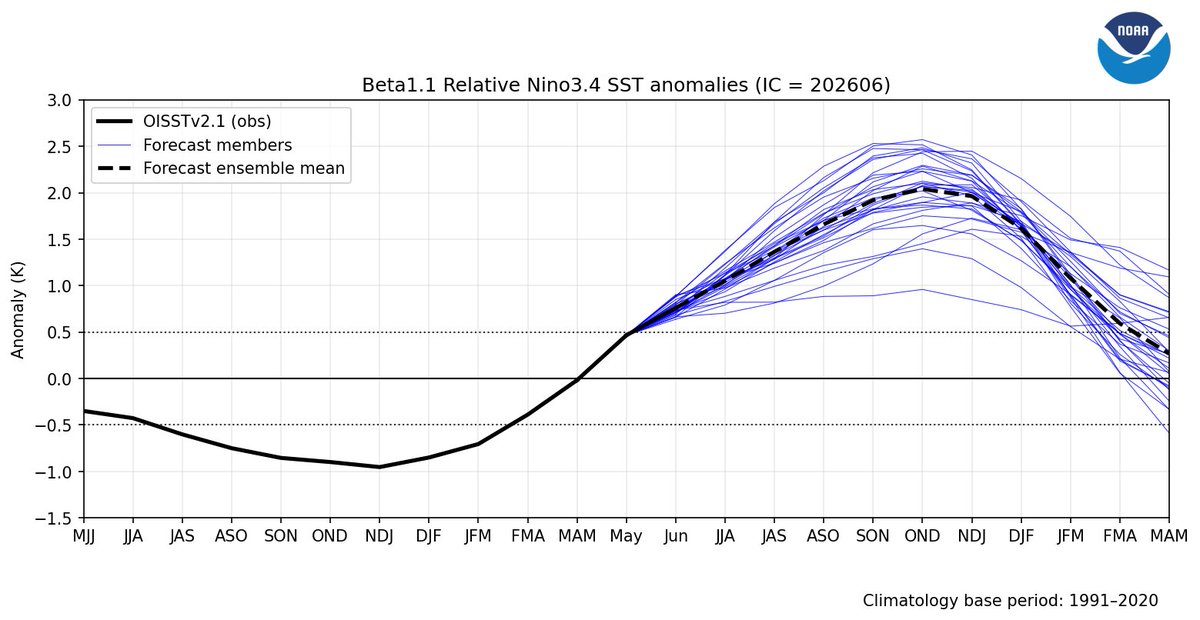
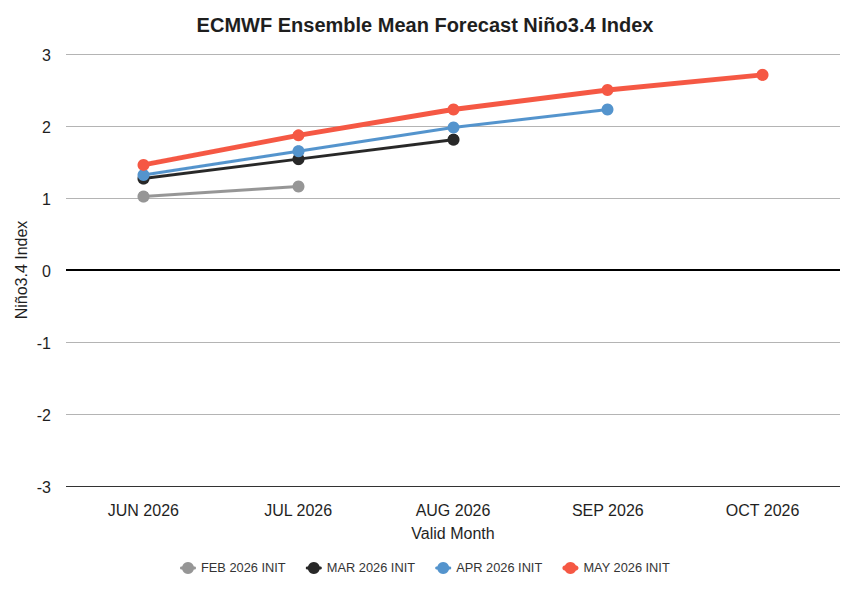
The CFSv2 members used for Copernicus this month were in the middle of the pack for El Niño intensity by October.
Since then, the forecast has continued to amplify, with (10-day lagged) ensemble mean SSTs now locally reaching 4.7°C above the 1991-2020 normal in Oct-Dec.
1
22
76
4,580
World Climate Service retweeted

May 22
Fascinating study from Texas A&M here. There is a link between urbanization and rainfall. Has implications on planning, mitigation, and near-term forecasting.
News article on the paper here: tpr.org/news/2026-05-21/texa…

Analysis of a 23-year record of Texan storms reveals how urban landscapes affect storm rainfall — painting a more complex picture than had been realized
go.nature.com/4wCZLyB
5
39
224
48,783
This spring's North Atlantic SSTs are quite similar to the MCA pattern that correlates with summer troughing to the west of Europe (Gastineau & Frankignoul 2015).
Interestingly *tropical* SST analogs point in the same direction.
Very different from the Copernicus consensus.


8
30
2,365
World Climate Service retweeted

Herramienta fascinante para explorar el clima del pasado: Weather Replay, la nueva app de @CopernicusECMWF, permite reconstruir las condiciones meteorológicas de cualquier lugar del mundo hora a hora desde 1940 hasta hoy.
(Ver hilo)
Portal aqui: weather-replay.climate.coper…
10
453
1,468
76,974
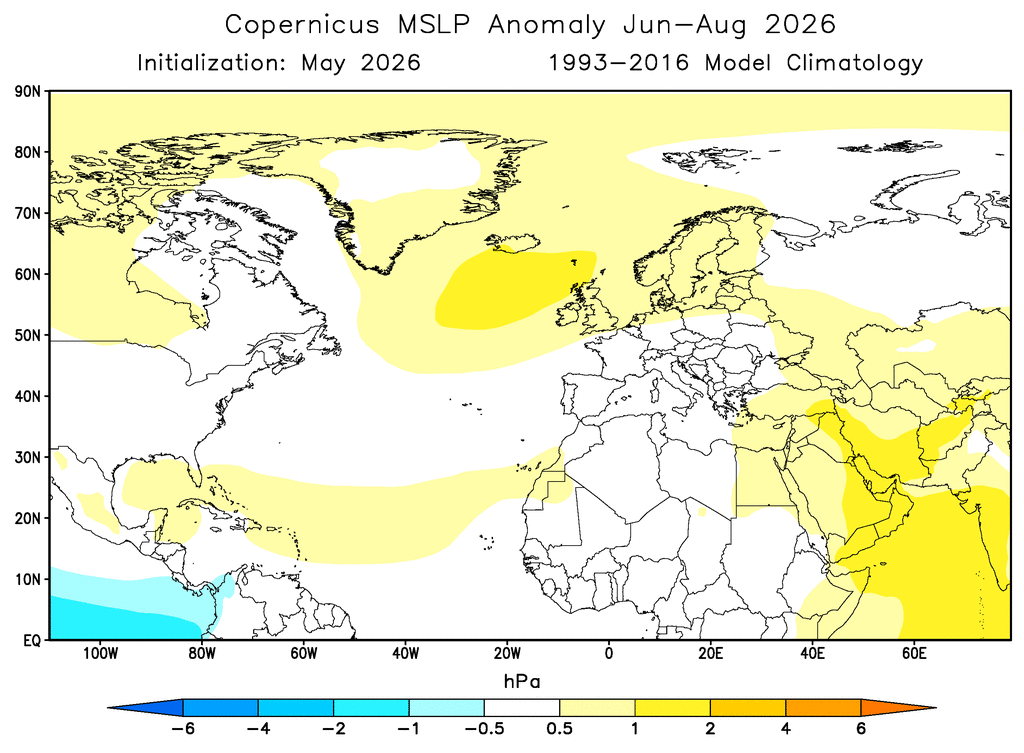
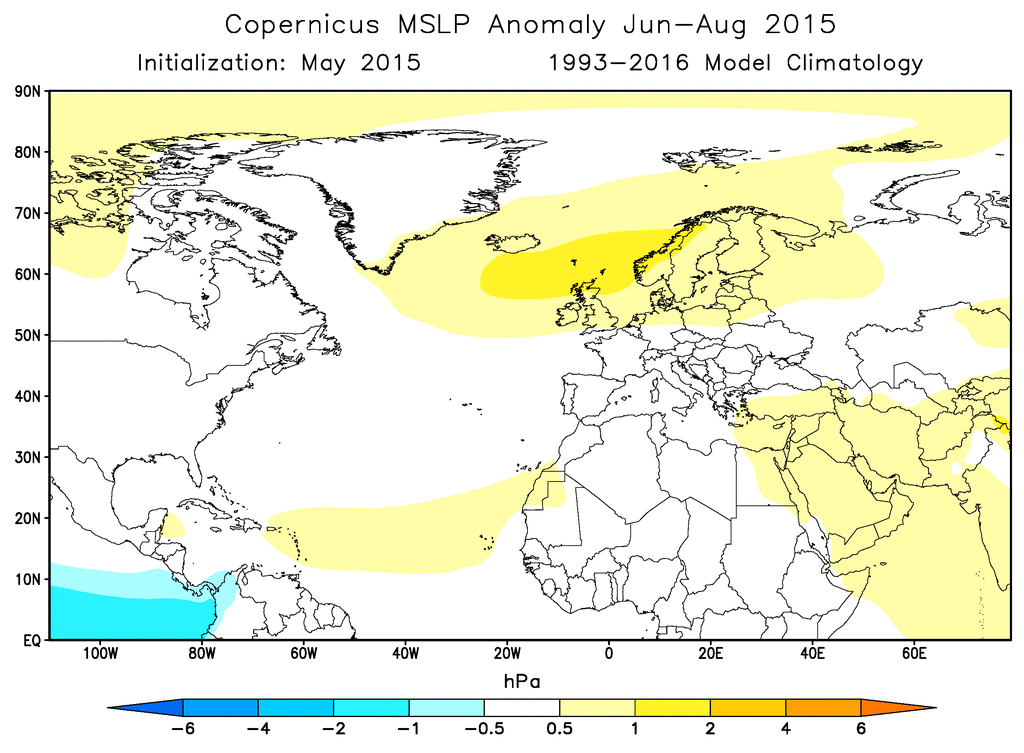
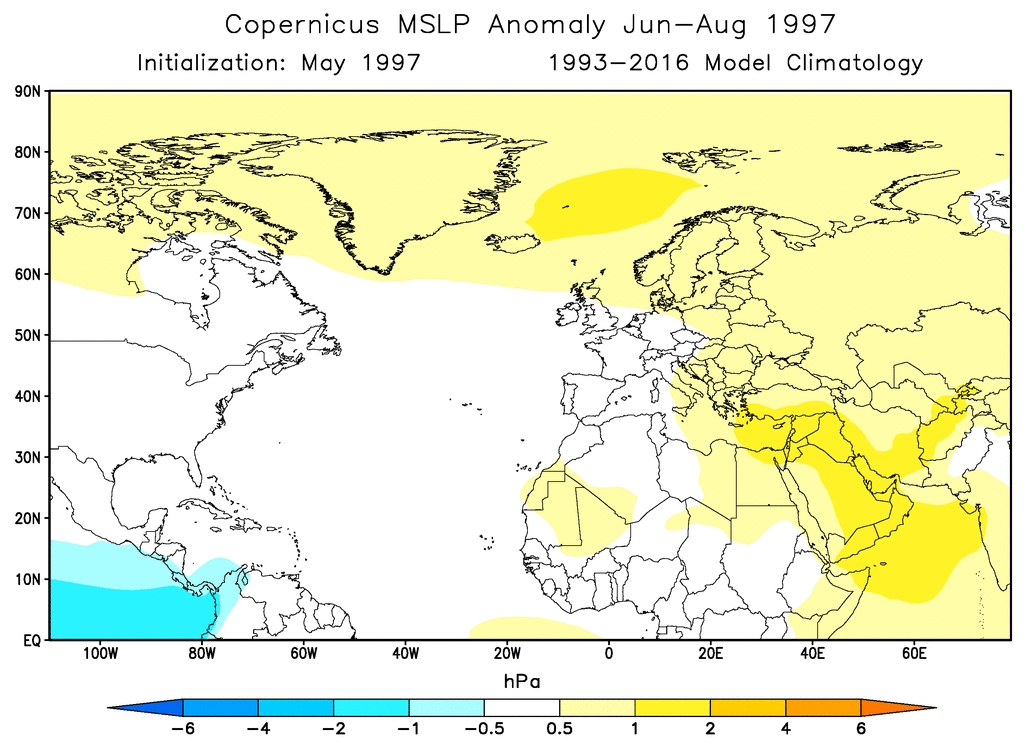
In last week's summer discussion for Europe, we compared the Copernicus forecast to similar hindcasts from 1997 and 2015 (major El Niño summers).
The 1997 forecast was relatively successful; 2015 not at all.
In general, the models can't capture summer N Atlantic ENSO impacts.
2
6
43
3,146
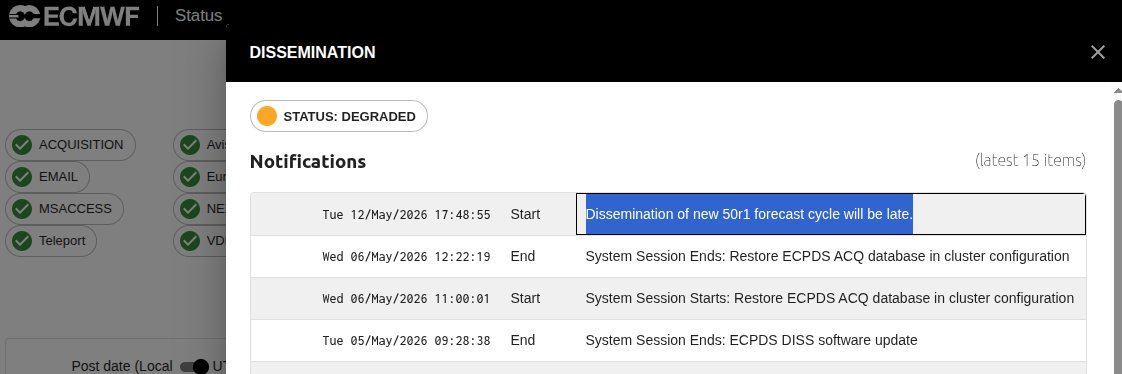
Eagerly waiting for new 50r1 ECMWF model upgrade today - unfortunately running late
2
3
22
2,318
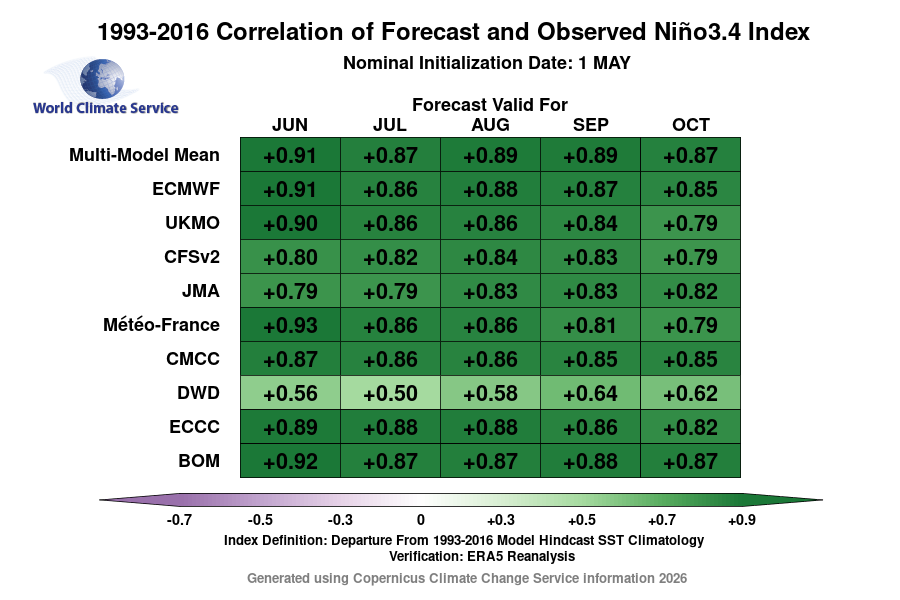
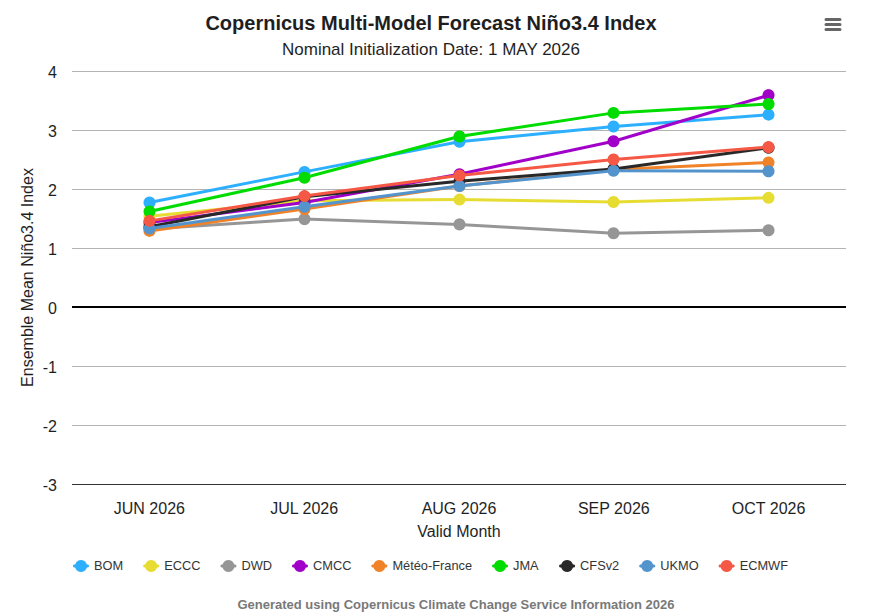
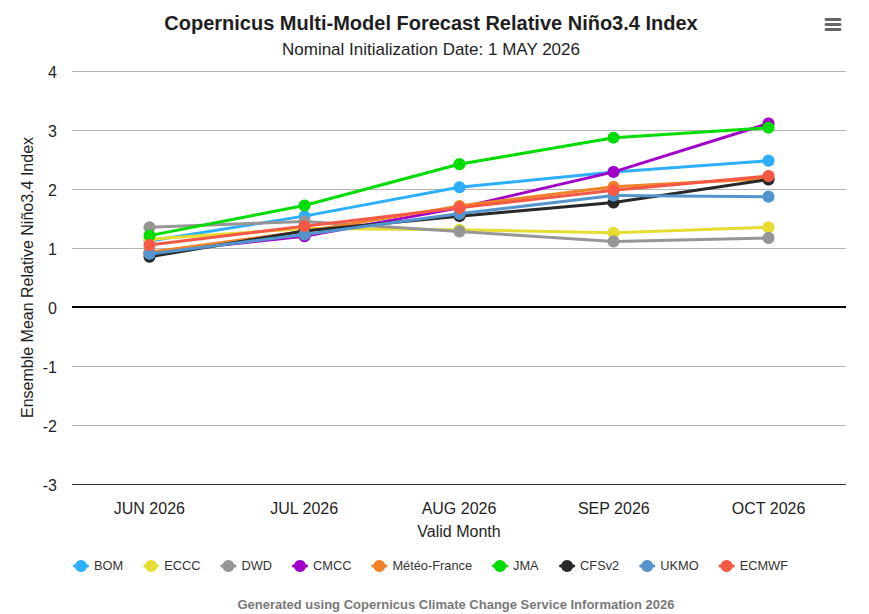
While the amplitude of the latest El Niño forecasts is a worthy headline, the latest C3S models show more variance than last month - both for traditional and relative Niño3.4 SSTs.
All models have warmed, but some much more than others.
(DWD is less credible - poor skill)
1
7
38
4,462
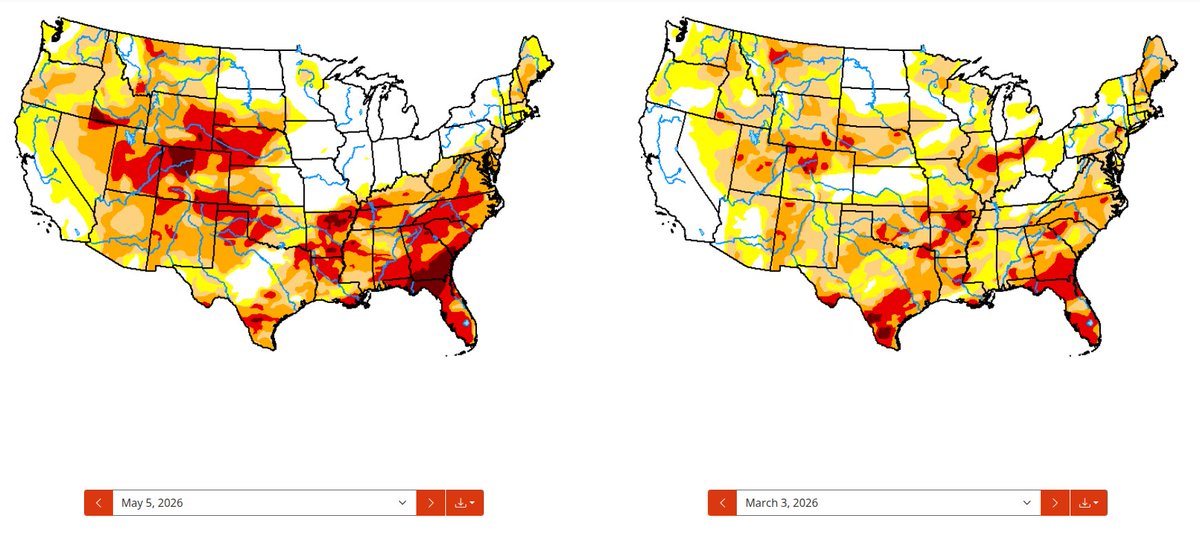
Good news as the U.S. Midwest growing season gets under way: drought/dryness have all but disappeared in the heart of the Corn Belt in the last two months, even as the Plains and Southeast have been very dry.
May 7

While drought in the Plains keeps worsening, the percentage of U.S. corn/soybean production NOT currently experiencing drought has increased significantly in the past two months.
In early March, only about 42% of U.S. corn production was outside a drought/dryness category. That figure has now risen to roughly 66% (top left panel).
#oatt #AgWx #AgWeather #Corn #Plant2026 #Weather
2
14
1,635
The progression of ECMWF seasonal VP200 forecasts shows the strengthening of this summer's atmospheric El Niño signal in recent months
1
28
116
18,813
The Niño3.4 SST signal continues to build. Little doubt now that this will be a record or near-record event.
1
2
18
1,289
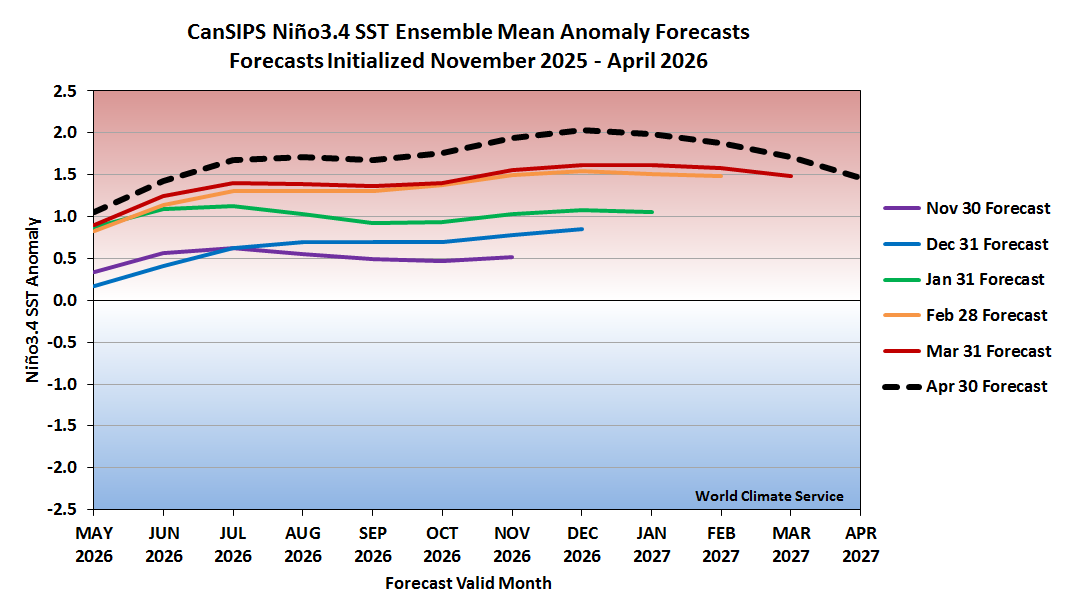
Yet another leg up in today's CanSIPS Niño3.4 forecast update.
The ensemble mean shows 9 months above 1.5°C anomaly. The ERSSTv5 record (1991-2020 baseline) is 8 consecutive months in 1997-98 and 2015-2016.
4
18
80
10,609
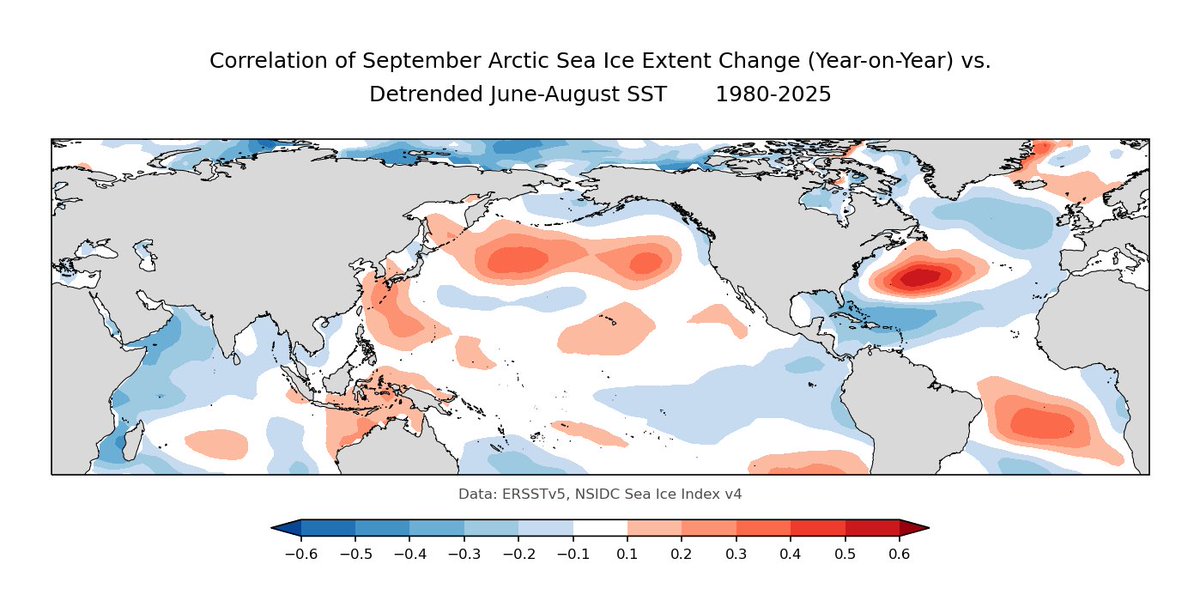
The major El Niño episodes of recent decades have tended to develop in tandem with significant Arctic sea ice loss (2023, 2015, 2002, 1997).
However, there's only a slight overall correlation with summer ENSO. Mid-high latitude SSTs and flow anomalies are more closely related.


2
16
74
7,100