
Joined June 2025
- Tweets 12,348
- Following 1,509
- Followers 5,328
- Likes 146,383
6,736 Photos and videos


Pinned Tweet

May 19
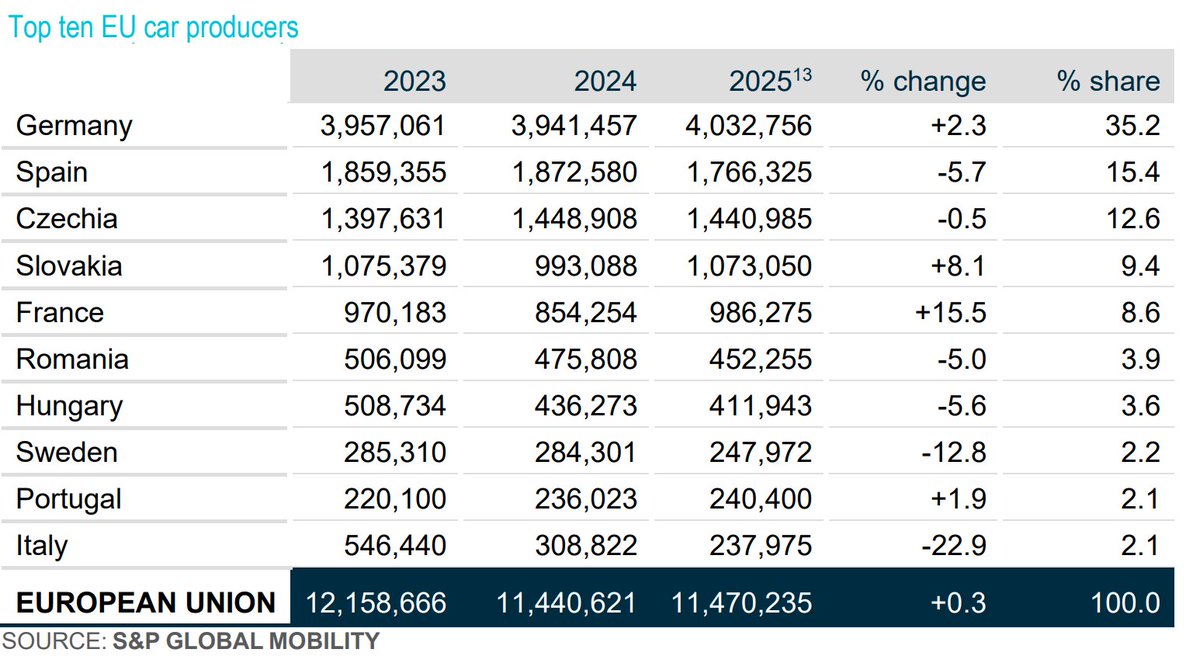
Germany still anchors European car manufacturing
The third chart highlights how concentrated EU auto production still is.
Germany alone represents more than 35% of total EU vehicle production in 2025 with over 4 million vehicles.
Spain and Czechia remain major manufacturing bases, while Slovakia continues to perform far above its population size with more than 1 million vehicles annually.
France rebounded strongly in 2025 with 15.5% growth, while Italy experienced a dramatic contraction of nearly -23%.
This suggests Europe’s auto system is not collapsing uniformly. Some countries are losing competitiveness, while others remain deeply integrated into advanced manufacturing networks.
1
2
10
667
.
Who will benefit from the new equilibrium?
A perspective that even non-economists may find interesting.
The real question is whether the new equilibrium will create broad-based gains or merely offer hope to some countries
The framework suggests that moving from the old globalization equilibrium (B₁) to a new one (B₂) may avoid the costly collapse associated with a trade war. However, it raises several difficult questions.
Will everyone benefit equally?
Not necessarily. The model itself acknowledges that cooperation under geopolitical rivalry may require concessions. Some countries may have to accept lower welfare than under the previous system in order to preserve stability.
Will there be losers?
Probably yes. The transition from B₁ to B₂ does not imply that all countries will gain. Some countries may become preferred partners, while others may find themselves outside new trade, investment, and technology networks.
Who will gain the most?
Countries that can position themselves as reliable intermediaries, neutral hubs, or members of aligned blocs may capture a disproportionate share of investment and trade. Others may receive little more than expectations without meaningful improvements in welfare.
Could the new equilibrium simply offer hope to some countries?
That may be the most important question. The movement from B₁ to B₂ represents a new equilibrium, but not necessarily a fair one. Since welfare gains need not be distributed equally, some countries could remain close to the axes, enjoying only limited benefits, while others move much closer to the efficiency frontier. In other words, a more stable global system does not automatically guarantee broadly shared prosperity.
PERHAPS THE GREATEST CHALLENGE IS NOT REACHING A NEW EQUILIBRIUM, BUT DESIGNING ONE IN WHICH THE GAINS ARE SUFFICIENTLY WIDESPREAD TO KEEP COOPERATION POLITICALLY AND ECONOMICALLY SUSTAINABLE
Source: @IMFNews by Aaditya Mattoo, Michele Ruta, Robert W. Staiger
2
8
115
Technical note:
In the framework, N₁ represents the original noncooperative Nash equilibrium that prevailed after World War II, while B₁ denotes the higher-welfare cooperative equilibrium achieved under the GATT/WTO system.
Rising geopolitical rivalry shifts the noncooperative benchmark from N₁ to a lower level, N₂.
The world can then either move from B₁ to N₂ and eventually to a new cooperative equilibrium B₂, or transition directly from B₁ to B₂ through institutional innovation.
Thus, N₁ and N₂ are noncooperative equilibria, whereas B₁ and B₂ represent welfare-improving cooperative outcomes.
In simple terms, the evolution described by the model is N₁ to B₁ to (geopolitical rivalry) to N₂ to B₂.
2
89
.
AI could become one of the world's largest new sources of electricity demand
The chart highlights how different AI electricity demand could be from traditional data center growth.
Conventional ("general purpose") data center demand rises steadily, reaching around 1,300–1,400 TWh per year by the 2050s.
AI-related electricity demand starts from a very small base, but grows much faster. By 2030, AI electricity demand is projected to be roughly ten times larger than today.
By 2050, AI data centers alone could consume around 3,000 TWh annually, already exceeding the electricity demand of conventional data centers.
By 2060, AI-related demand could approach 5,000 TWh per year, nearly four times larger than general-purpose data center demand.
North America remains the largest contributor throughout the period, while Europe and Greater China also see significant growth. By the 2050s and 2060s, the rest of the world becomes an increasingly important source of AI-related electricity demand.
Source: @wef
3
6
26
848
.
Major destination for Chinese solar panels
Between January and April 2026, the Philippines imported roughly 4.1 GW of solar panels from China, making it China's second-largest export destination after the Netherlands.
Following countries are Brazil, Spain, France, Australia, Thailand, Belgium and Viet Nam
Source: @ember_energy by Dave Jones and Alnie Demoral
1
3
18
419
.
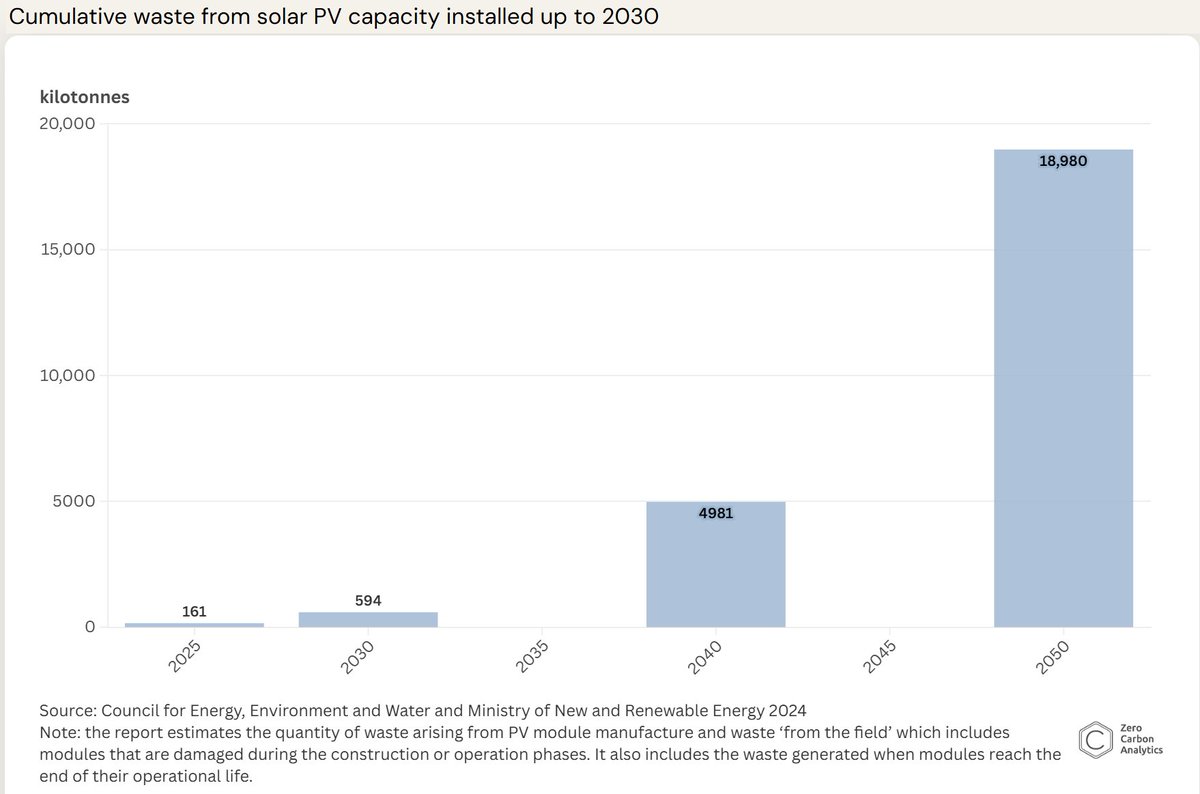
Is INDIA ready for the PV waste boom?
Are PV wastes a problem or a new opportunity?
As millions of solar panels are installed across India, another challenge is slowly emerging: what happens when these panels reach the end of their 25–30 year lifetimes?
According to the Council on Energy, Environment and Water (CEEW), cumulative waste from existing and new solar PV capacity could rise from 161 kilotonnes in 2025 to 594 kilotonnes by 2030, then surge to almost 5 million tonnes by 2040 and nearly 19 million tonnes by 2050. That is roughly a 30-fold increase between 2030 and 2050.
However, these end-of-life panels are not simply waste. Up to 95% of the materials inside PV modules can potentially be recovered, including glass, aluminum, copper, silicon and small amounts of critical minerals.
Recognizing this challenge, India added solar panels to its e-waste regulations in 2022 and introduced an Extended Producer Responsibility (EPR) framework. Manufacturers, producers and recyclers are required to register and participate in the system, while the country aims to achieve an 80% recycling rate for electronic waste by 2028–29.
At the same time, important gaps remain. There is little publicly available information on how much PV waste is actually being recycled, whether targets are being met, or how much material has been recovered.
In other words, India appears to view future PV waste not only as an environmental issue but also as a potential resource. If effective recycling systems are developed, today's solar panels could become tomorrow's "urban mines", supplying valuable materials and supporting a new domestic recycling industry
Source: @CEEWIndia @ZerocarbonA
3
6
30
608
.
from air conditioning to AI and data centers: the return of electricity demand growth
One thing that stands out from this chart is how different technologies have shaped U.S. electricity demand over time. After decades of efficiency improvements slowed growth, AI and data centers are bringing back demand growth levels not seen in generations.
Details
New household appliances drove average annual electricity demand growth to 8.5% in the 1950s, the highest decade in the chart.
Air conditioning sustained strong growth in the 1960s, with electricity demand expanding by 7.4% per year.
Growth gradually slowed to 4.2% in the 1970s, 3.0% in the 1980s, and 2.4% in the 1990s.
Efficiency improvements became increasingly important. The widespread adoption of compact fluorescent lamps (CFLs) helped reduce annual growth to just 0.8% in the 2000s.
The shift to LED lighting pushed growth even lower, averaging only 0.2% in the 2010s.
From 2021 to 2024, electricity demand growth remained modest at 0.9% annually.
Looking ahead to 2025-2030, data centers and AI-related infrastructure are expected to drive average annual demand growth to 5.7%, a level not seen since the era of mass appliance adoption and air conditioning.
Source: Grid Strategies by J@Wilson_Energy, Sophie Meyer, Zach Zimmerman, and @RobGramlichDC
3
12
33
1,079
Jun 13
.
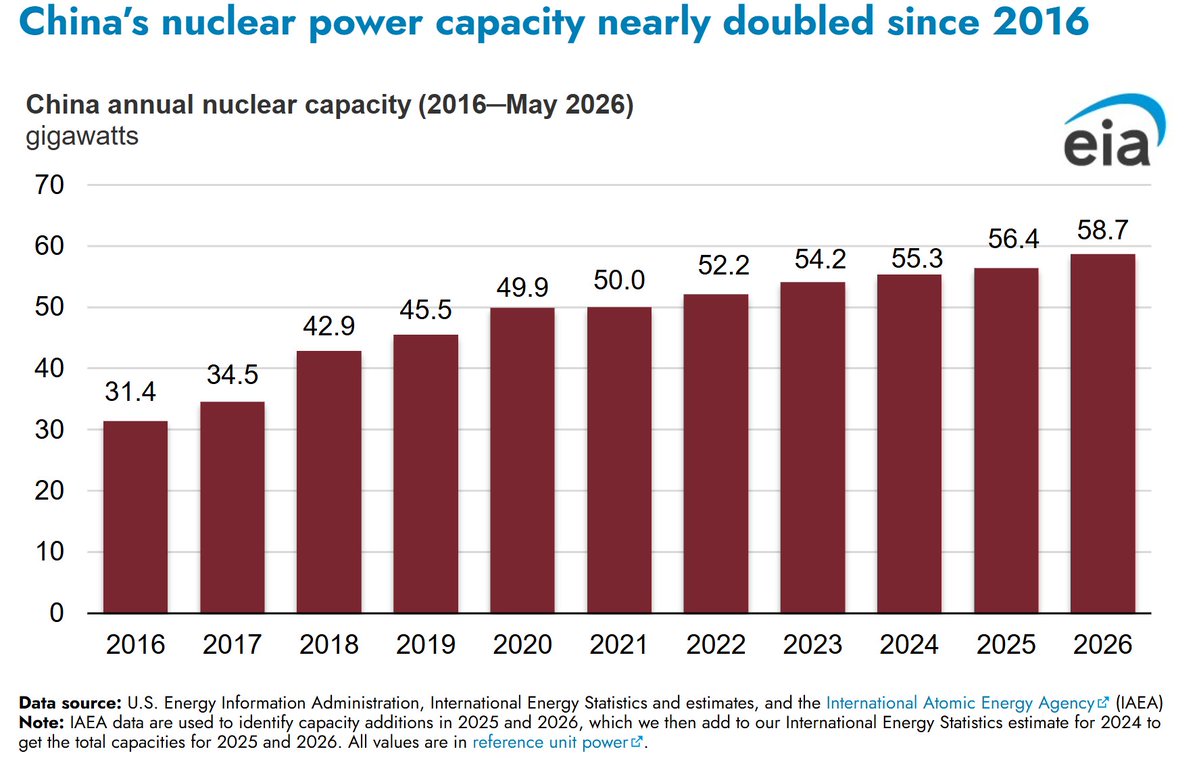
China's nuclear power capacity keeps growing
China's nuclear power capacity has expanded steadily over the past decade, almost doubling since 2016.
China's nuclear capacity increased from 31.4 GW in 2016 to 58.7 GW by May 2026, an increase of nearly 87%.
Capacity rose every year, with the largest jumps occurring between 2017 and 2020, when total capacity climbed from 34.5 GW to 49.9 GW.
Growth slowed after 2020, but expansion continued. Capacity reached 56.4 GW in 2025 and 58.7 GW in 2026.
China added more than 27 GW of nuclear capacity over the past decade, making it one of the fastest-growing nuclear power markets in the world.
Despite rapid growth, China's nuclear capacity remains below its coal and renewable power capacity, suggesting further expansion is likely.
Source: @EIA
2
7
40
857
Jun 13
.
META and GOOGLE are signing major deals for next-generation GEOTHERMAL POWER to supply their DATA CENTERS
The shale gas revolution transformed the U.S. energy landscape through advances in drilling and completion technologies. Something similar may be happening in geothermal. Meta and Google appear to recognize this opportunity and are becoming some of the biggest customers of next-generation geothermal power.
Google Fervo Energy
@Google helped prove EGS technology with Fervo's Project Red pilot and later signed a framework agreement for up to 3 GW of future geothermal capacity. Earlier, Google also secured 115 MW of 24/7 enhanced geothermal power and recently supported another agreement with Ormat and NV Energy for up to 150 MW of new geothermal capacity in Nevada.
Meta XGS Energy
@Meta signed an agreement with XGS Energy to develop 150 MW of advanced geothermal power in New Mexico. XGS uses a closed-loop approach that reduces dependence on naturally occurring water resources and permeable rock formations.
Meta Sage Geosystems
Meta also signed a separate 150 MW agreement with Sage Geosystems. Sage's approach leverages drilling and subsurface expertise developed by the oil and gas industry.
Why this matters: Unlike wind and solar, geothermal can provide electricity around the clock with capacity factors above 90%, making it particularly attractive for AI data centers that require constant power.
Many observers see echoes of the shale revolution:
- Horizontal drilling and stimulation techniques pioneered by oil and gas are now being adapted to geothermal.
- Companies such as Fervo, XGS, and Sage are attempting to unlock heat resources that were previously uneconomic.
- Large tech companies are providing long-term demand and improving access to financing.
The parallels with the shale era are striking. Just as George Mitchell helped commercialize shale gas, entrepreneurs such as @TimMLatimer and the teams behind @fervoenergy , @xgsenergy , and @sagegeosystems are trying to do something similar for geothermal energy.
Sources: @Reuters, Reuters Events, @OrmatInc, @NatLabRockies
2
7
32
835
Jun 13
The list
Companies, technology developers, utilities, and data center operators are driving the commercialization of next-generation geothermal through a growing number of projects, investments, and long-term power agreements.
1
12
166
Jun 13
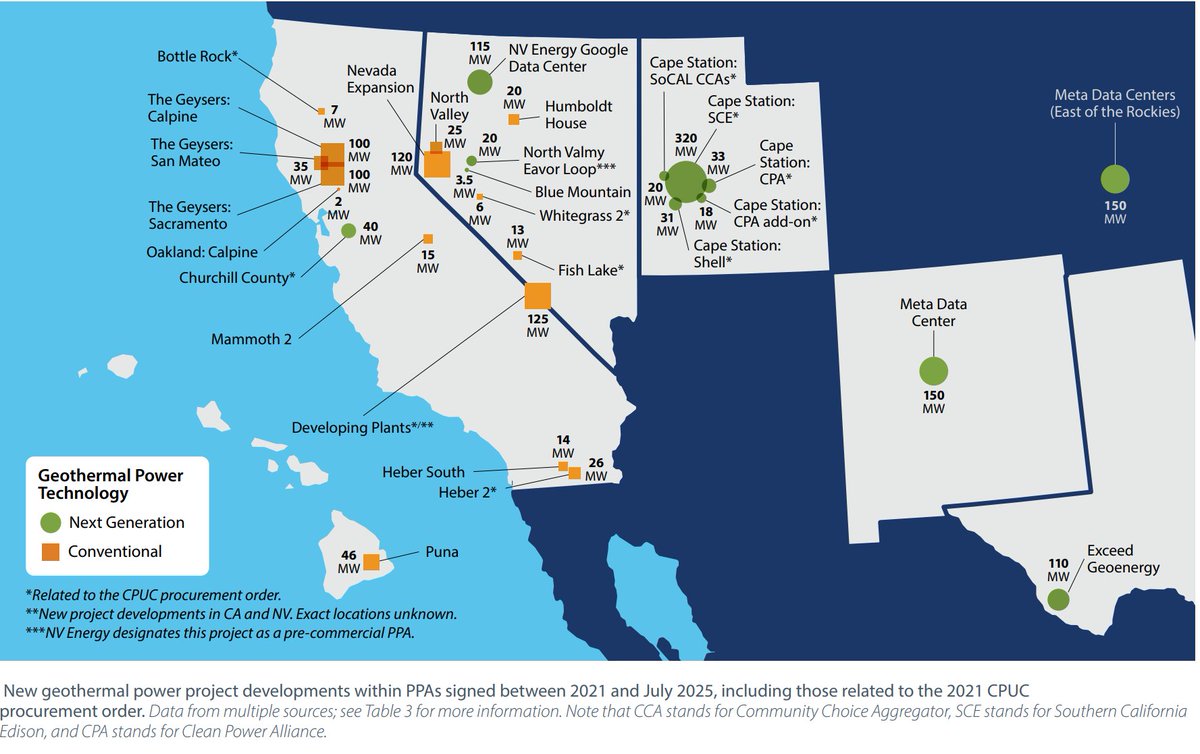
The map of geothermal capacity and some interesting companies
2
8
166
Jun 13
Incredible!
The U.S. seems to have an almost LIMITLESS energy resource.
Will America's second great energy boom be driven by GEOTERMAL?
The post consists of three parts: FIRST, the resource potential; SECOND, the REMARKABLE IMPACT of NEW TECHNOLOGIES; and THIRD, the people and innovations driving these technological advances
The resource is much larger than current production
The map below shows that while conventional geothermal resources are concentrated in the western United States, favorable geology for enhanced geothermal systems extends across much of the country. Existing hydrothermal sites are only a small part of the potential resource base.
California and Nevada dominate current production.
Large parts of the West and some regions in the South and East also show favorable conditions.
The resource itself appears much larger than what is currently being utilized.
Source: @NatLabRockies by Dayo Akindipe, @faithskilee13, Erik Witter, Hannah Pauling, Hyunjun Oh, Slater Podgorny, @Rane_Jayaraj_36, Jenna Harmon, @BeingSaqibJaved, Juliet Simpson, Dora Shlosberg, Emily Holt, Whitney Trainor-Guitton, and Aaron Levine @Geo_Rising by Brian Schmidt and Anine Pedersen, @coschoolofmines, @MinesGeophysics
2
5
31
561
Jun 13
New technologies could unlock geothermal almost anywhere
Traditional geothermal plants require naturally occurring hot water and permeable rock. Next-generation approaches aim to remove these constraints.
The basic idea is simple: hot rock exists almost everywhere, but naturally occurring hot water and permeable reservoirs do not. Traditional geothermal systems only work where both are present. New technologies aim to overcome this limitation.
1. Conventional hydrothermal: This is the approach used today in places like California and Nevada. Natural hot water and fractures already exist underground. Wells bring the hot water to the surface, where it drives turbines to generate electricity.
Today, in places like California and Nevada:
Surface
↓
Well ↓ ↑ Well
========================
Natural hot water
========================
2. Enhanced geothermal systems (EGS): If natural water is absent or fractures are limited, engineered solutions can create a reservoir.
Using techniques adapted from the oil and gas industry, including horizontal drilling and hydraulic fracturing, water is circulated through hot rock. This allows previously inaccessible heat resources to be turned into electricity.
Surface
↓ Water injection
Well ↓
========================
Hot rock
Engineered fractures
========================
Well ↑ Hot water
Using horizontal drilling and hydraulic fracturing techniques borrowed from the oil and gas industry, water is circulated through hot rock, turning previously inaccessible heat into a source of electricity.
3. Closed-loop systems: In closed-loop systems, the fluid never comes into contact with underground rock formations or groundwater. Instead, fluid circulates inside sealed pipes, absorbs heat from surrounding rock, and returns to the surface. These systems require little or no natural reservoir.
The fluid never comes into contact with groundwater or rock formations:
Surface
↓ ↑
│ │
│ │
│________________│
Hot rock
Fluid circulates inside a sealed pipe, absorbs heat from surrounding rock, and returns to the surface. Little or no natural reservoir is required.
4. Superhot geothermal: By drilling deeper, temperatures above 400°C can be reached. At such temperatures, a single well could potentially produce several times more energy than conventional geothermal wells.
By drilling much deeper:
Surface
↓
│
│
│
========================
>400°C superhot rock
========================
↑ Steam
Temperatures above 400°C can be reached, potentially allowing each well to produce several times more energy than conventional geothermal wells.
Why does this matter for the eastern United States?
Unlike California and Nevada, the eastern U.S. has relatively few shallow hydrothermal resources. However, hot rock exists several kilometers underground.
This means:
Today: geothermal electricity is concentrated mainly in California and Nevada.
If EGS succeeds: states such as Texas, Colorado, Utah, and even parts of Pennsylvania, Ohio, and Appalachia could generate geothermal power.
If closed-loop technologies mature: geographic limitations could be reduced even further.
This is why some experts describe geothermal as "underground nuclear energy" — a vast resource capable of providing reliable 24/7 power, unlike wind and solar, but one that remains largely untapped today.
1
2
16
286
Jun 13
The people and technologies behind the progress
America's shale revolution transformed the country's energy position largely thanks to pioneers such as George Mitchell, who combined horizontal drilling and hydraulic fracturing to unlock shale gas.
Geothermal may now be entering a similar phase.
Researchers at @LosAlamosNatLab laid the foundations for EGS decades ago.
@MIT scientists, including Jeff Tester, helped develop the modern vision for advanced geothermal.
@TimMLatimer and @JackNorbeck of @fervoenergy are applying oil and gas drilling techniques to geothermal.
Jean-Claude Veilleux, founder of @Eavor, pioneered closed-loop geothermal systems.
Some observers believe geothermal could experience its own "shale moment," turning the heat beneath America's soil into another strategic energy advantage.
The first great U.S. energy boom came from shale. The second one may come from the heat beneath our feet.
8
153
Jun 13
.
Political violence and demonstrations in Africa
Africa: March–April 2026
Political violence remained concentrated across a broad belt stretching from West Africa to the Horn of Africa.
The highest density of incidents was observed in Nigeria, Burkina Faso, Mali, Niger, Cameroon, Sudan, South Sudan, Ethiopia, and Somalia, indicating that instability continues to be concentrated in the Sahel and East Africa.
Nigeria and the central Sahel remained major hotspots. Clusters of violent events were particularly dense around northern Nigeria and neighboring areas, reflecting continued activity by jihadist groups and local armed actors.
Sudan's conflict spilled beyond its borders. According to ACLED, violence associated with the Sudanese war increasingly affected neighboring regions, contributing to a broader zone of instability in eastern Chad and western Sudan.
The Horn of Africa experienced sustained insecurity. Somalia, Ethiopia, and South Sudan recorded large numbers of violent incidents, highlighting persistent insurgencies and internal conflicts.
Demonstrations were more geographically concentrated and generally occurred in relatively more urbanized or politically open areas. Morocco, Tunisia, South Africa, Kenya, Uganda, and coastal West African countries showed notable protest activity.
Southern Africa experienced comparatively low levels of political violence. Most events in South Africa and neighboring countries were demonstrations rather than armed conflict, indicating a different pattern of political contention.
North Africa remained relatively stable apart from Libya. Protest activity dominated in Morocco and Tunisia, while Libya continued to record localized violence.
Overall, the map illustrates a clear divide between regions dominated by armed conflict and those where political grievances are expressed primarily through demonstrations.
The Sahel–Horn corridor remained Africa's principal conflict zone in early 2026, whereas southern and northwestern parts of the continent were characterized by lower-intensity unrest and protest activity.
Source: @ACLEDINFO by Ladd Serwat, Jalale Getachew Birru, Héni Nsaibia, Peter Bofin.
4
18
272
Jun 13
.
Southeast Asia: electricity prices by sector and country
There are indeed large differences in electricity prices across Southeast Asia, not only between countries but also across residential, commercial, and industrial users.
The Philippines has the highest residential electricity prices in the region, at 13.8 PHP/kWh, slightly above Singapore (13.7 PHP/kWh) and far above Indonesia (5.2 PHP/kWh) and Laos (2.4 PHP/kWh).
Singapore records the highest commercial electricity prices, reaching 12.2 PHP/kWh, followed closely by the Philippines at 11.7 PHP/kWh.
Vietnam and Indonesia have some of the lowest commercial tariffs, at 4.2 and 3.7 PHP/kWh, respectively.
Industrial electricity prices vary considerably. Singapore has the highest industrial tariffs (11.6 PHP/kWh), while Laos offers the lowest rates (2.0 PHP/kWh). Indonesia also maintains relatively low industrial prices at 3.7 PHP/kWh.
The gap between the most expensive and least expensive residential electricity markets is nearly sixfold, highlighting the region's diverse energy mixes, subsidy structures, and market designs.
Malaysia, Thailand, Vietnam, and Myanmar occupy the middle range, with residential prices clustered around 7.7–8.7 PHP/kWh and industrial prices around 5.8–7.2 PHP/kWh.
Source: @ember_energy by Dave Jones and Alnia Demoral
1
34
77
3,218
Jun 13
🇵🇭
Solar case: Philippines
Electricity prices are creating a strong rooftop solar incentive
The Philippines has some of the highest electricity prices in Southeast Asia. Residential tariffs reached 14.3 PHP/kWh in May 2026, ahead of most neighboring countries. As electricity prices rise while solar system costs fall, rooftop solar payback periods have shortened significantly, from 4 years to 3.1 years, strengthening the economic case for households and businesses.
Source: @ember_energy by Dave Jones and Alnie Demoral
1
3
38
815
Jun 13
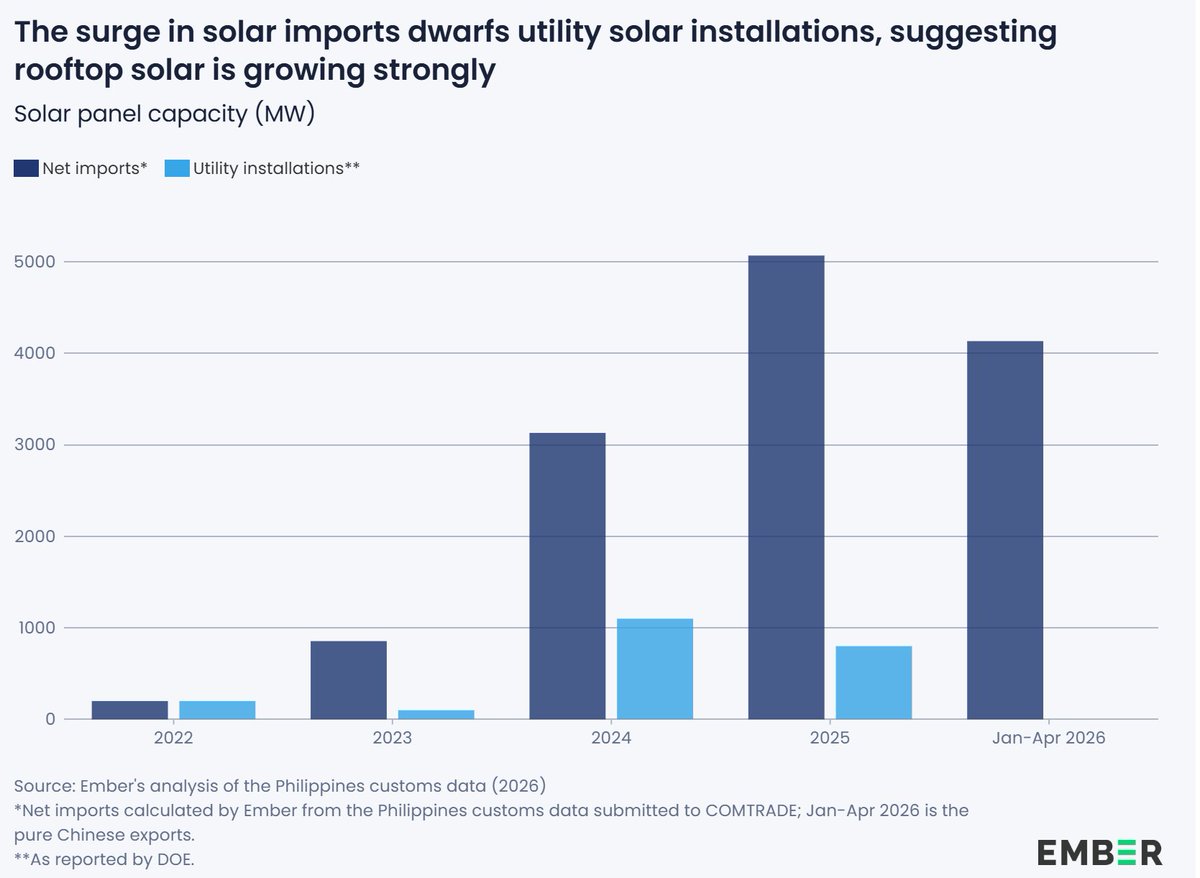
Chinese solar exports to the Philippines reached record levels in 2026
Monthly exports of both solar panels and solar cells from China to the Philippines surged throughout 2025 and reached new highs in early 2026. Several months exceeded 1 GW of combined exports, indicating accelerating solar deployment activity across the country.
1
1
10
243
Jun 13
Solar imports are growing much faster than utility-scale solar installation
The Philippines imported approximately 5 GW of solar panels in 2025, while utility-scale solar additions were below 1 GW. The large gap suggests that a substantial share of imported panels is being deployed outside the utility sector, most likely in rooftop solar installations.
1
7
153
Jun 12
.
3 fresh and flash data points from the U.S. energy sector
U.S. jet fuel production rebounds after prices doubled in March
U.S. Gulf Coast jet fuel prices briefly surged to nearly $5 per gallon in March 2026.
Higher margins encouraged refiners to increase output.
U.S. jet fuel production climbed above 2 million barrels per day, approaching record levels.
Source: @EIAgov June 2026.

2
4
17
383
Jun 12
Biofuel credit prices are approaching record highs again
D4 and D6 Renewable Identification Number (RIN) prices have risen sharply since early 2024.
Higher blending targets have increased demand for compliance credits.
Current prices are close to the peaks reached during 2021–2022.

1
1
8
216
Jun 12
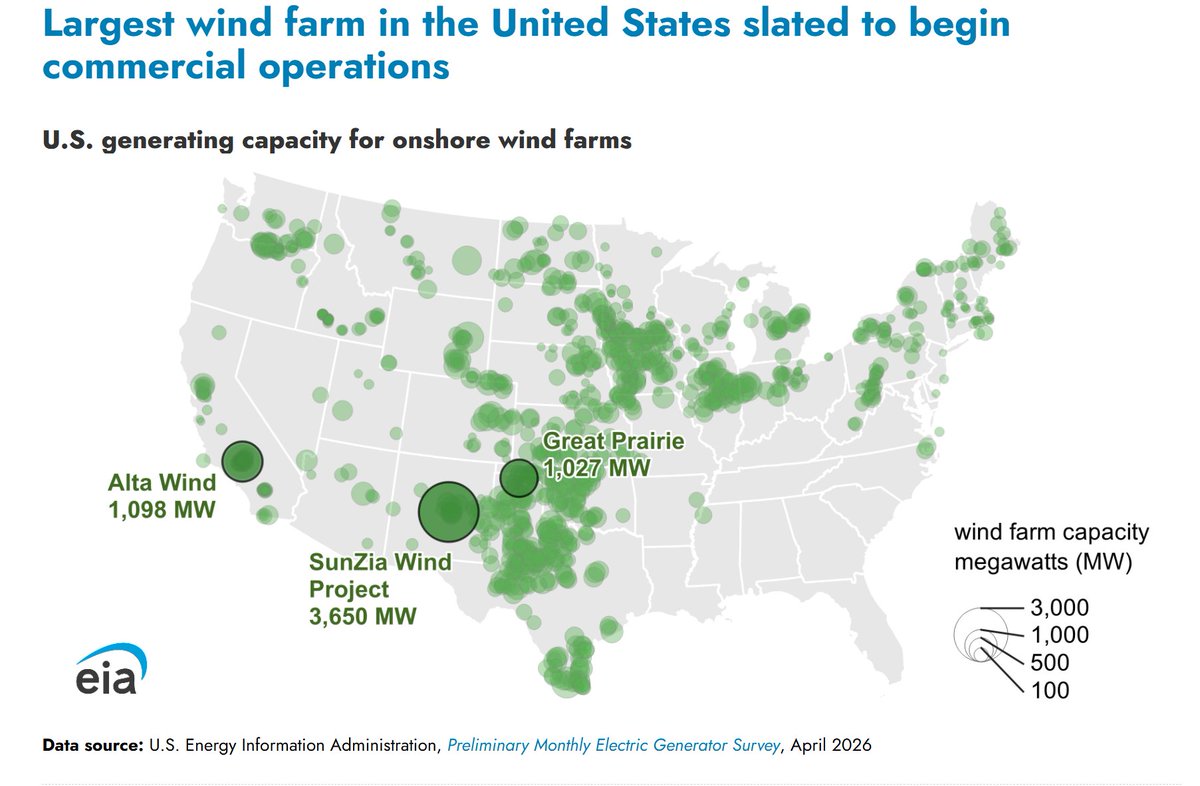
America's largest wind farm is set to begin operations
The 3.65 GW SunZia Wind Project is expected to become the largest onshore wind farm in the United States.
It is more than three times larger than the 1.1 GW Alta Wind facility and significantly exceeds the 1.03 GW Great Prairie project.
The project further expands wind capacity across the U.S. Great Plains and Southwest.
1
8
141