
1,046 Photos and videos


JasonX40 retweeted

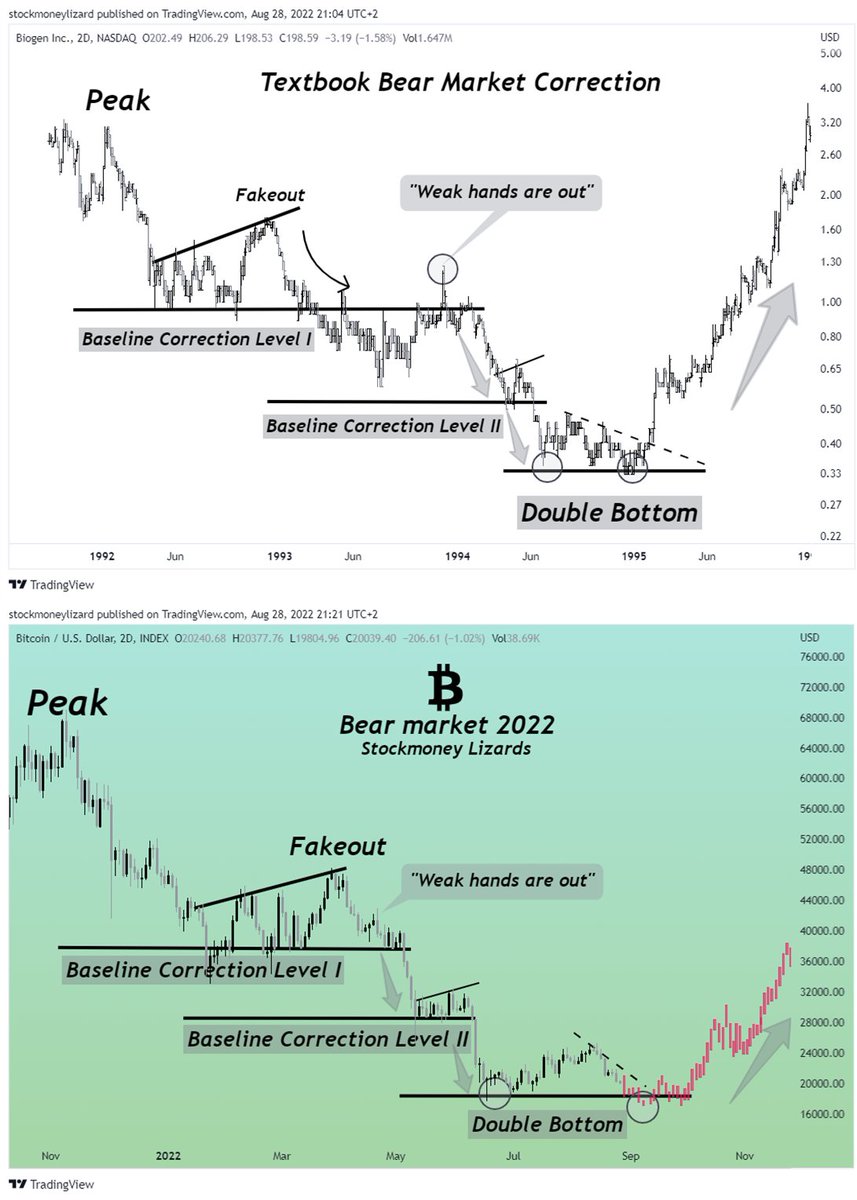
I posted this chart in 08/2022. And it predicted the course of the transition from bear to bull.
Bitcoin dumped from 30k to 17k in june 2022. then was slowly creeping up to 25k. Then elevator down to 19k. then ftx. then bull.
Sound familiar?
Don't listen to people trying to convince you stuff is different, something is broken, or this and that happens because of some model.
Maybe it's boring because it's too simple.
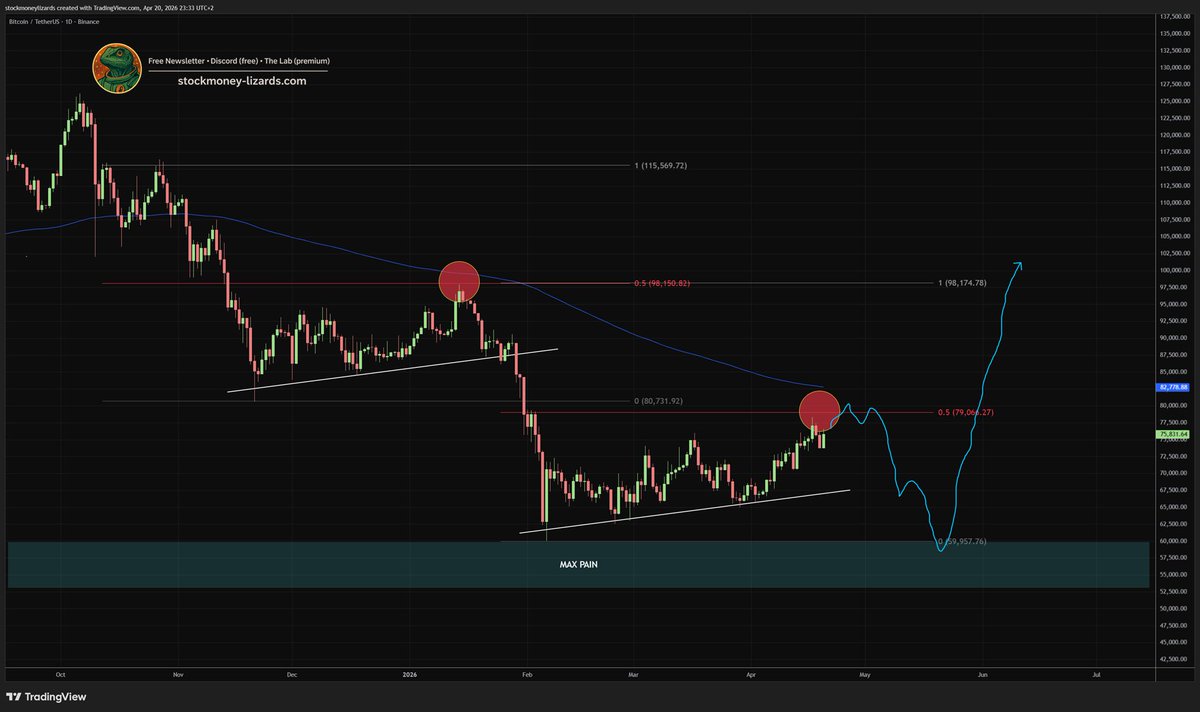
Apr 20

Stocks are back at all time highs, Bitcoin touched 78k and while last week people were still calling 50% corrections on the S&P 500, this week feels unreal.
Let's take an objective look at the charts:
Bitcoin is now repeating a move it has done multiple times before during bear markets.
I believe a rejection at the daily EMA200 / 0.5 FR is a possible scenario.
HOWEVER: WE WILL NOT DIVE TO 40k AS SOME PREDICT. I believe in 2 scenarios: A) Pullback to somewhere between 65k - 70k or - should stocks correct further down now - into the green "Max pain" box.
Either way. Downside is limited. I am cautious and not buying here. My buying zone is 53 - 60k, in case we touch that again.
Next 6 months are bullish.
ALT Disclaimer: We hold positions in the cryptocurrencies displayed here. This content is for informational purposes only and represents our opinions, not investment advice. We are not financial advisors. Crypto investing carries high risk including total loss of capital. Our models use historical data and may not predict future performance. We may sell positions at any time. Always do your own research and consult a financial advisor before investing
34
38
348
62,970
The market is absolutely heating up! 🚀 Check out these massive profit runs across the board:
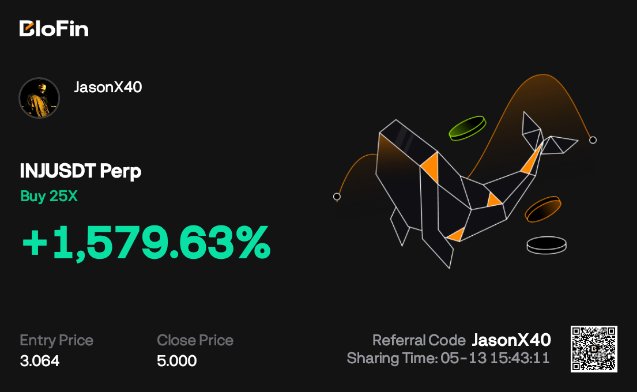
$INJ is leading the charge with incredible momentum. 📈
$SAGA is following close behind with a huge move. 🔥
$PEPE is seeing some serious green on the charts. 🐸
$SHIB is climbing fast as the rally continues. 🐕
The gains are stacking up! 💰
#CryptoGains #BloFin #TradingSuccess #ToTheMoon #Altcoins

1
4
72
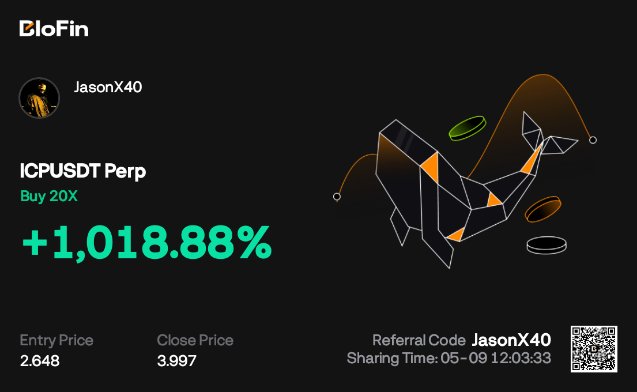
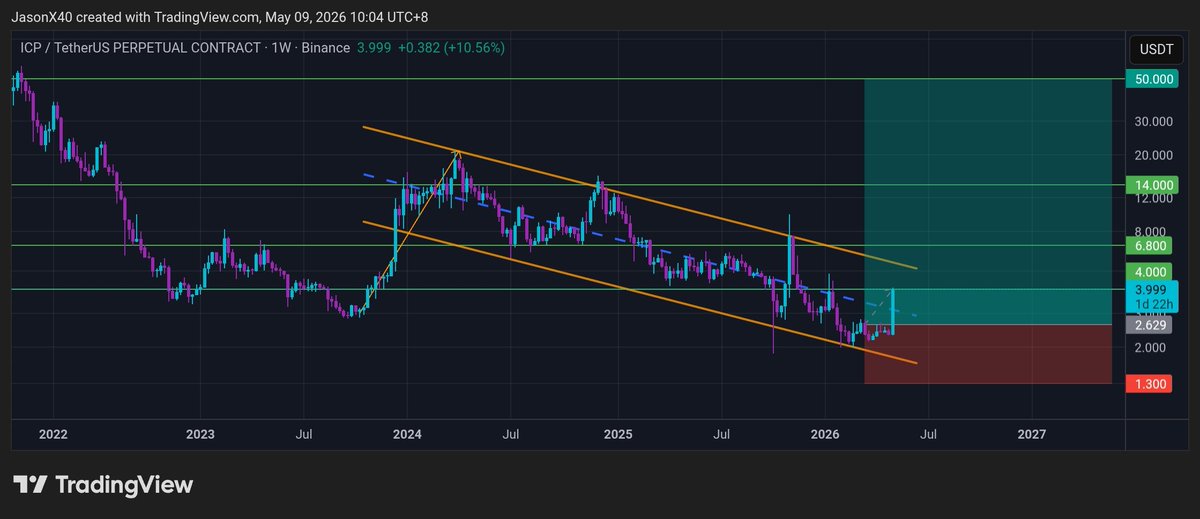
🚀 $ICP Update 🚀
Target 1 hit. I’ve been tracking this falling channel on the weekly, and the bounce is playing out exactly as planned. Confidence is high as we head toward the next resistance. 📈🔥
#ICP #InternetComputer #Crypto #Altcoins #TechnicalAnalysis #TradingView
1
4
361
🚀 $STX Breakout Confirmed! 🚀
The long-term descending channel has officially been cleared. Momentum is surging, and the first target has already been hit.
With the trendline now acting as support, the path toward the next major resistance levels is wide open. The reversal is looking solid! 🔥📈
#STX #Stacks #Crypto #Altcoins #Breakout #TradingView #TechnicalAnalysis

272
$HYPER keeps on delivering! 🚀🎯
TP 2 has officially been hit with precision. The momentum from that falling channel breakout is incredible, and we're just checking off targets now.
Another solid win in the books. Keeping a close eye on the next levels—let's see how high this goes! 📈🔥
#HYPER #CryptoTrading #TechnicalAnalysis #TPHit #Bullish #Altcoins #BloFin #TradingView


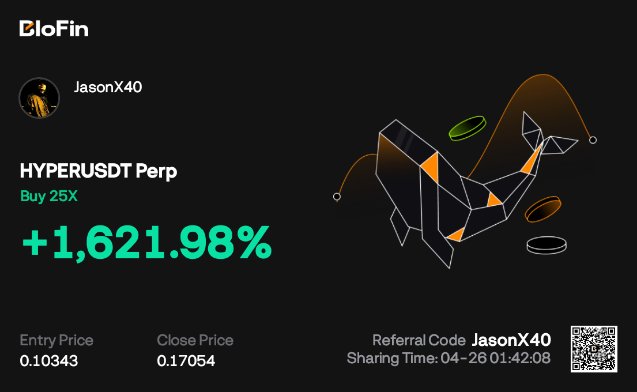
$HYPER delivering exactly as expected! 📈
The breakout from this long-term falling channel was a textbook setup. Just hit TP 1 with precision, securing a clean 645% gain on 25x leverage.
The momentum is strong—watching closely for the next targets. 🚀🎯
#HYPER #CryptoTrading #TechnicalAnalysis #TPHit #Bullish #Altcoins #BloFin #TradingView

2
386
$HYPER delivering exactly as expected! 📈
The breakout from this long-term falling channel was a textbook setup. Just hit TP 1 with precision, securing a clean 645% gain on 25x leverage.
The momentum is strong—watching closely for the next targets. 🚀🎯
#HYPER #CryptoTrading #TechnicalAnalysis #TPHit #Bullish #Altcoins #BloFin #TradingView
2
661
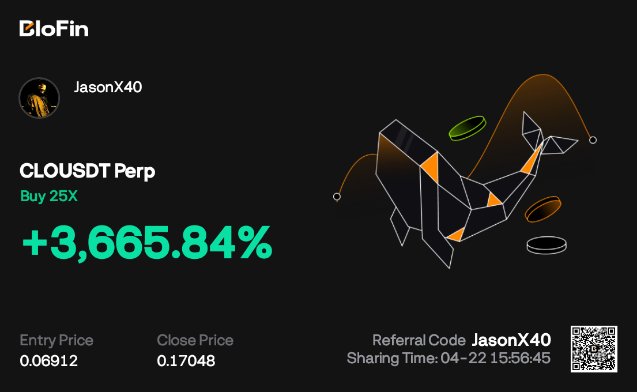
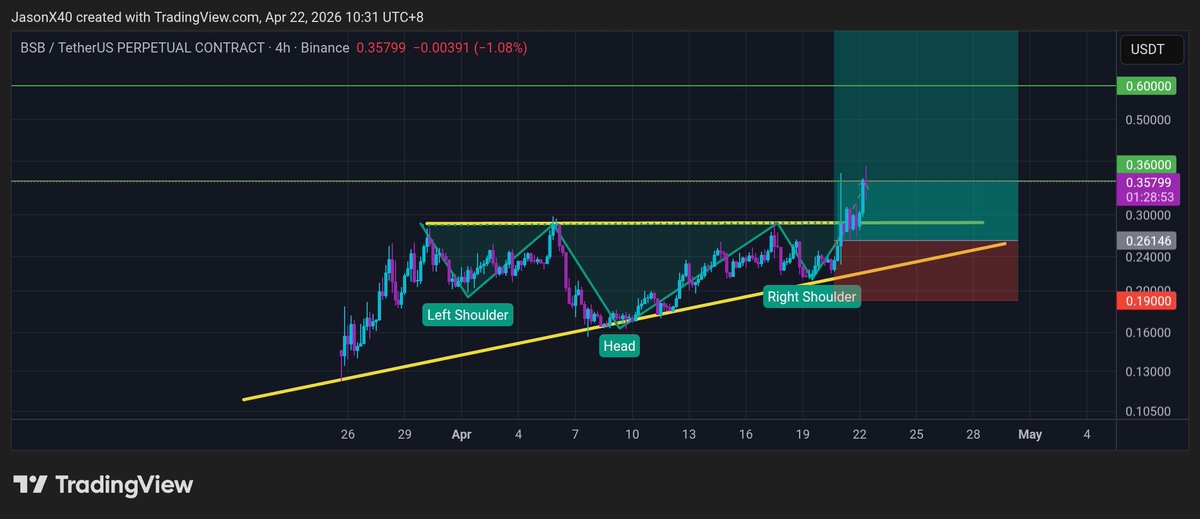
Another target smashed! 🎯
$BSB just hit TP 2 after that beautiful Inverse Head & Shoulders breakout. The technicals played out perfectly, climbing straight through the resistance levels.
Locked in a solid 1,371% gain with 10x leverage. Keeping the momentum going! 🐳🔥
#BSB #CryptoTrading #BloFin #TPHit #TechnicalAnalysis #Altcoins #Bullish #TradingView

$BSB just hit Target 1! 🎯
The chart played out perfectly—we saw a solid Inverse Head and Shoulders pattern combined with an Ascending Triangle breakout. When multiple bullish structures align like this, the results speak for themselves. 📈🚀
Onward to the next targets!
#BSB #CryptoTrading #TechnicalAnalysis #ChartPatterns #Bullish #PriceAction

2
333
$AAVE is looking very interesting on the 3D chart! 📊
Currently sitting right within a major demand zone and testing a key support trendline (yellow). To add even more weight to this setup, the daily chart is flashing a clear bullish divergence.
If this support holds, we could be looking at a significant reversal toward those upper targets. Staying patient and watching the reaction here. 🎯🚀
#AAVE #DeFi #CryptoTrading #TechnicalAnalysis #BullishDivergence #Crypto #Altcoins
1
3
236
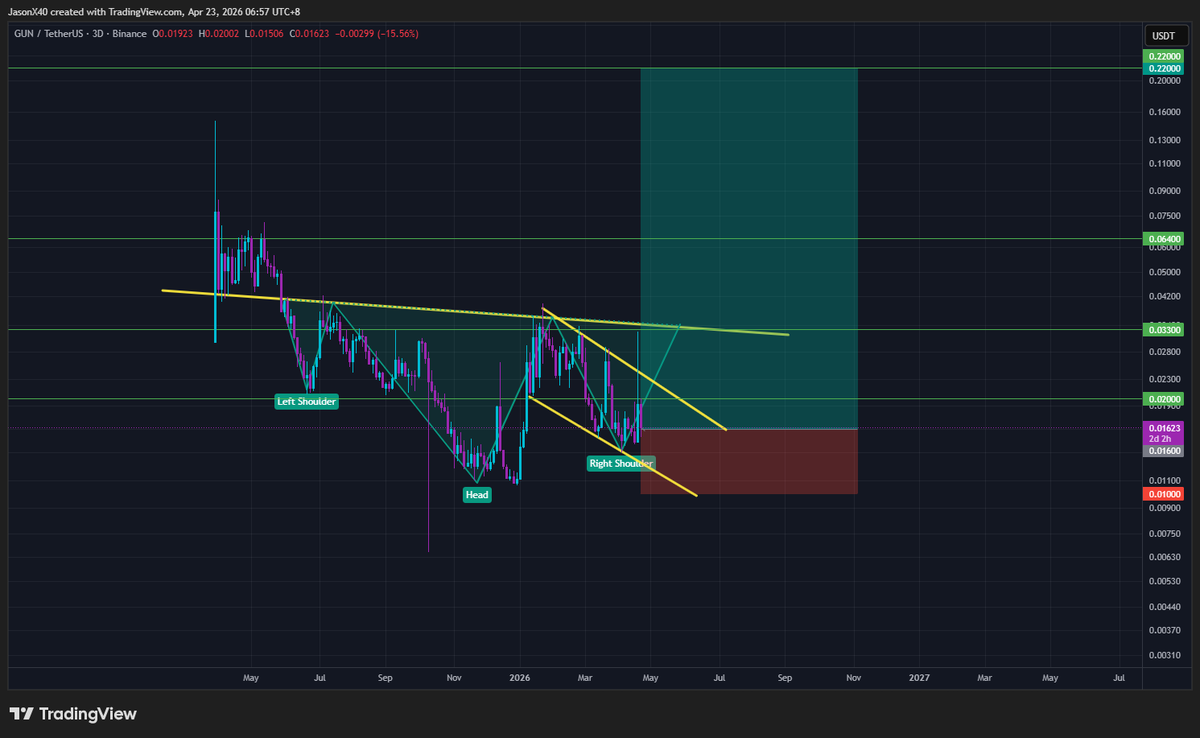
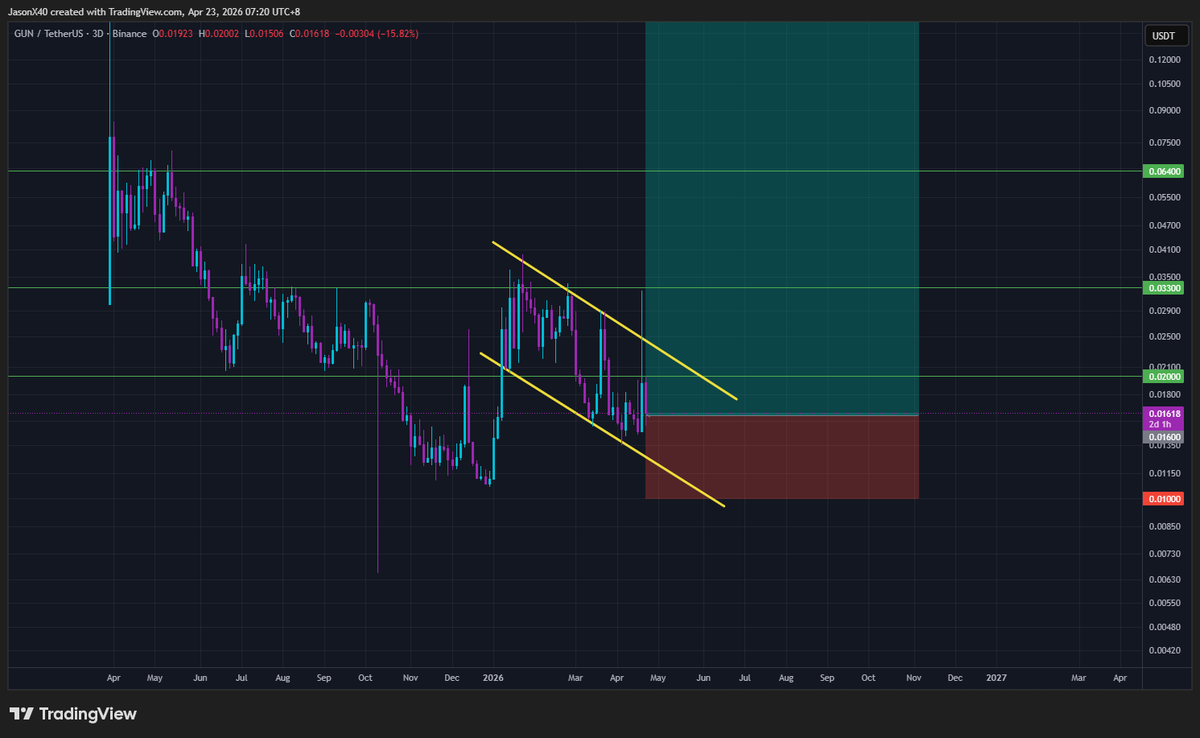
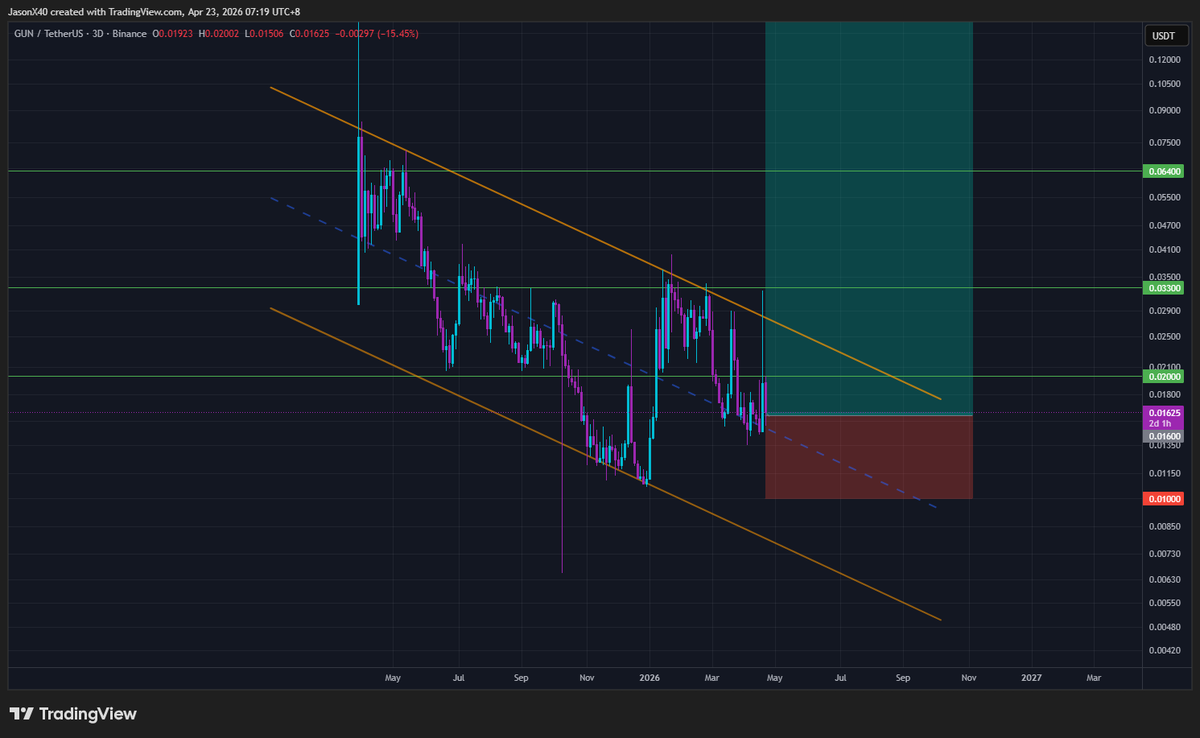
The setup on $GUN is looking absolutely prime on the 3D timeframe. 📈
We’ve got a massive confluence of bullish signals lining up:
1) Inverse Head & Shoulders forming the base
2) Consolidating within a Bull Flag
3) Long-term Falling Wedge
If this follows through, $GUN might just be the next $RAVE. Eyeing those upper targets! 🚀💎
#GUN #Crypto #TechnicalAnalysis #Bullish #Altcoins #CryptoTrading #FallingWedge #BullFlag
2
2
401
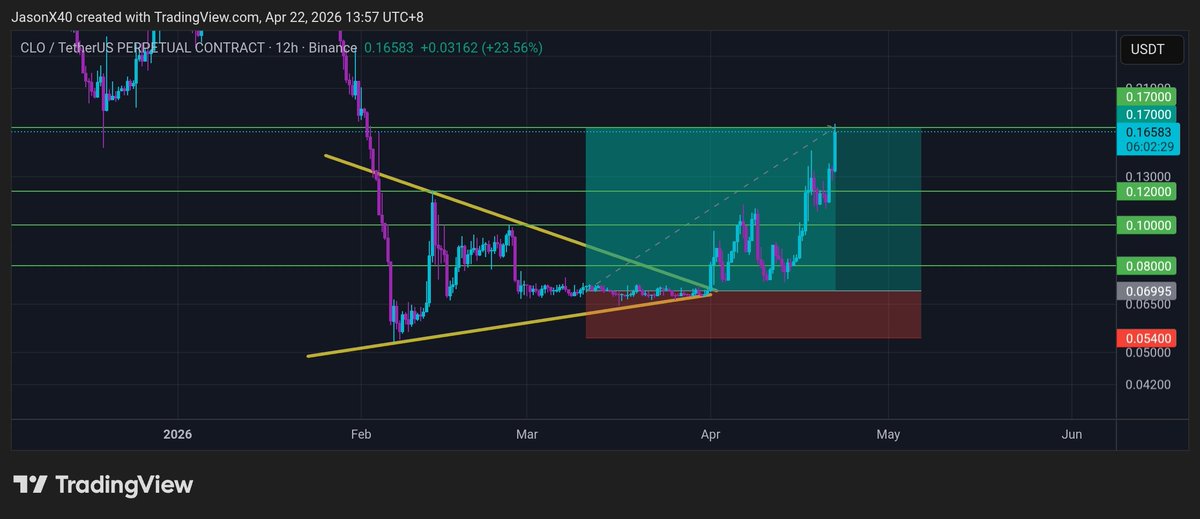
Patience pays off. 📈
The $CLO wedge breakout played out exactly as anticipated. Watching that consolidation phase lead into a massive move to hit the full target is why I love technical analysis 🐳🔥
#CLO #CryptoTrading #BloFin #TradingView #TPHit #FullTarget #Altcoins #Bullish
1
242
$BSB just hit Target 1! 🎯
The chart played out perfectly—we saw a solid Inverse Head and Shoulders pattern combined with an Ascending Triangle breakout. When multiple bullish structures align like this, the results speak for themselves. 📈🚀
Onward to the next targets!
#BSB #CryptoTrading #TechnicalAnalysis #ChartPatterns #Bullish #PriceAction
478
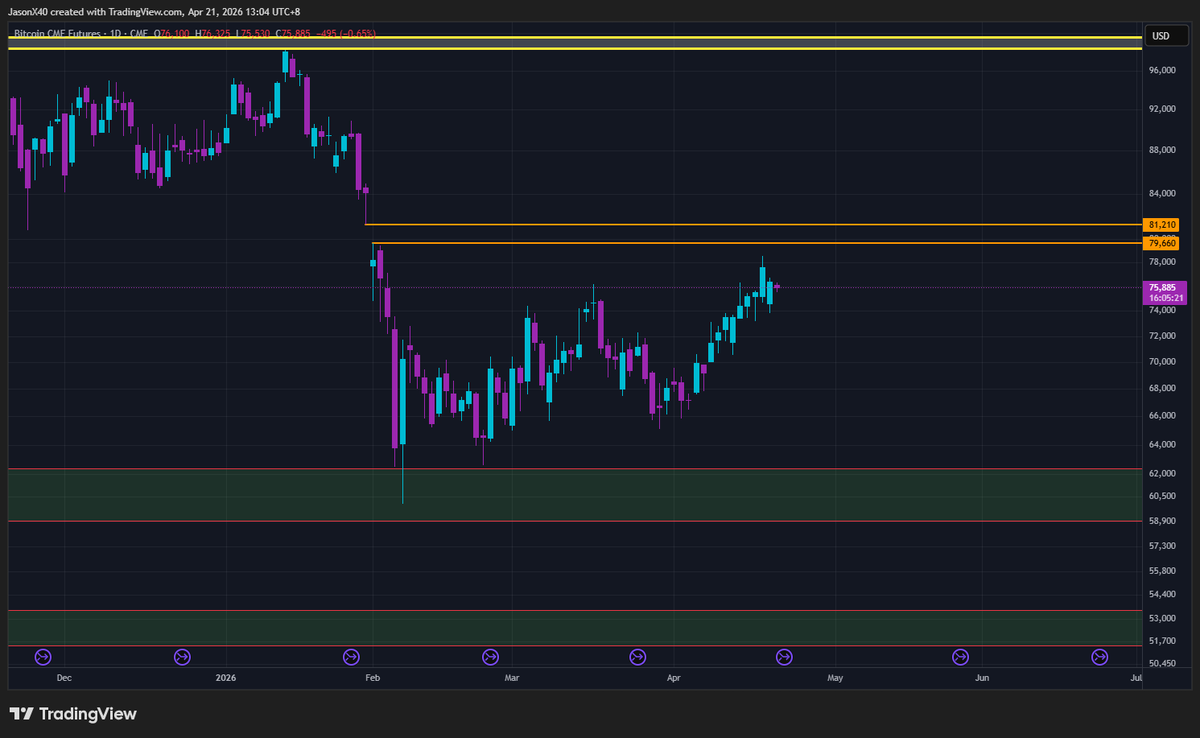
$BTC is at a critical juncture with 3 possible scenarios playing out. 📊
1️⃣ The Bullish Path: We need a clean breakout and retest of the major downward trendline once the CME gaps at 79K - 81K if filled.
2️⃣ The Fakeout: Watch for a potential fakeout once those gaps are hit. If it fails to hold the support trendline, we could see a sharp reversal.
3️⃣ The Bearish Channel: We’re currently in a rising channel/bear flag. If the breakout becomes invalid, it might follow this bearish structure down.
The CME gap fill is the key zone to watch! Stay sharp. ⚡️
#BTC #Bitcoin #CryptoTrading #TechnicalAnalysis #CMEGap #CryptoMarket
103
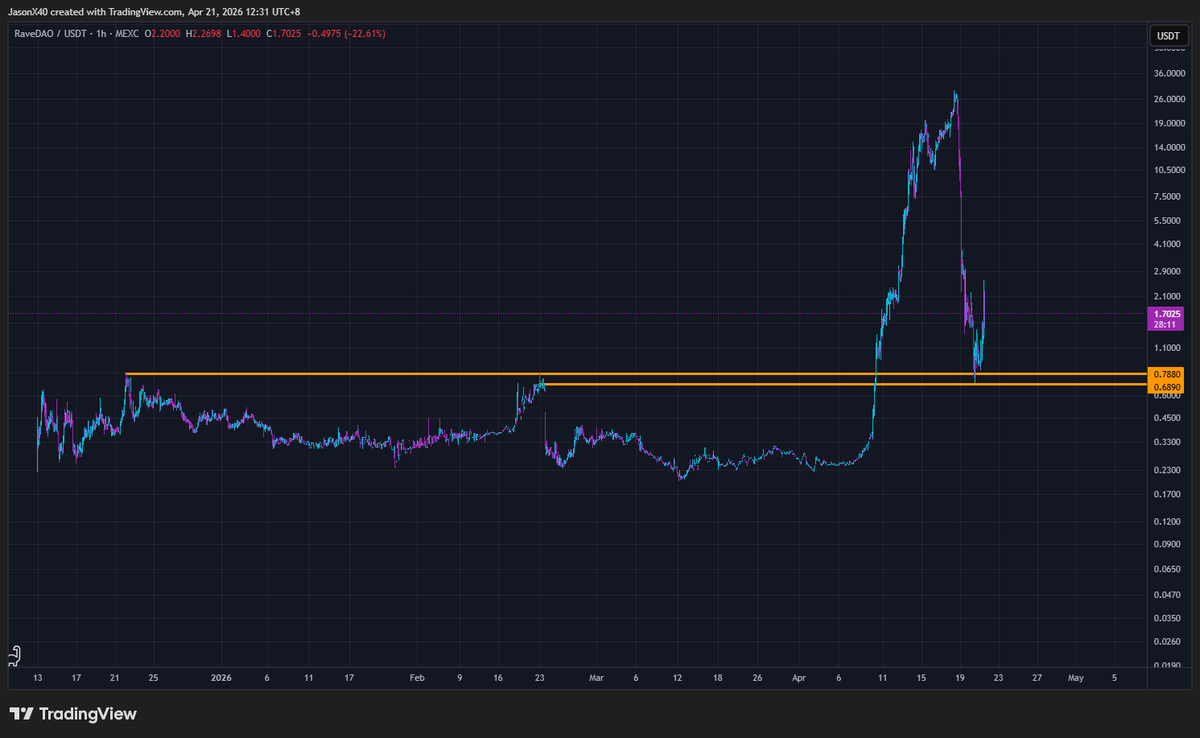
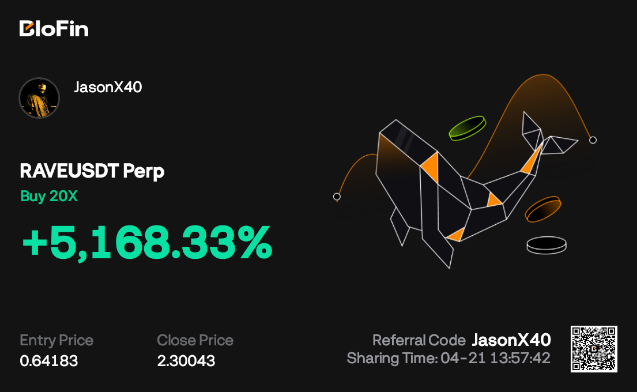
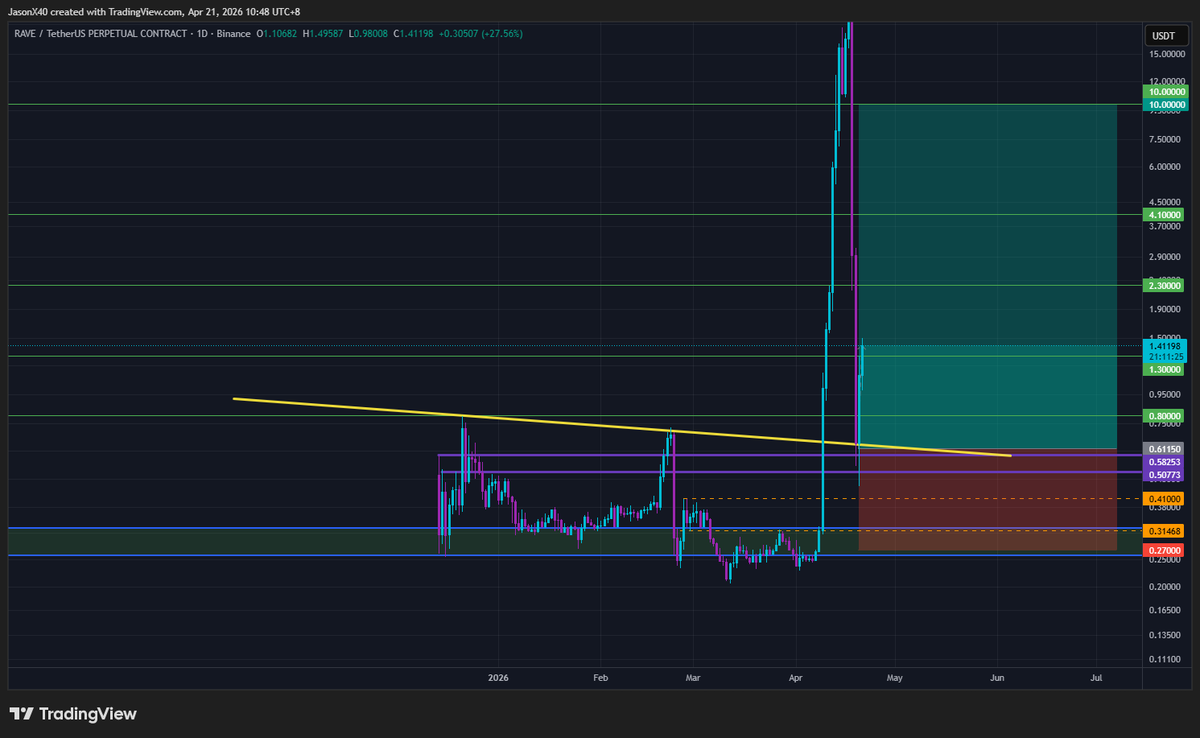
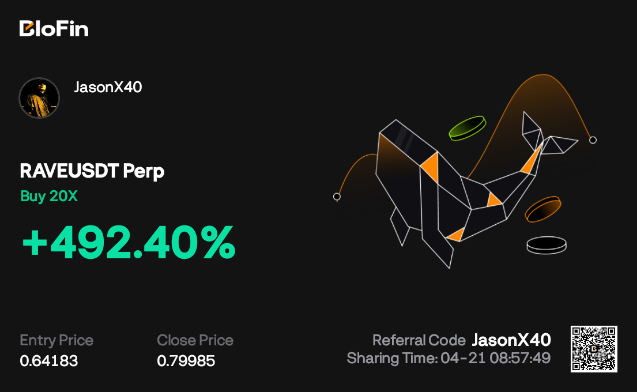
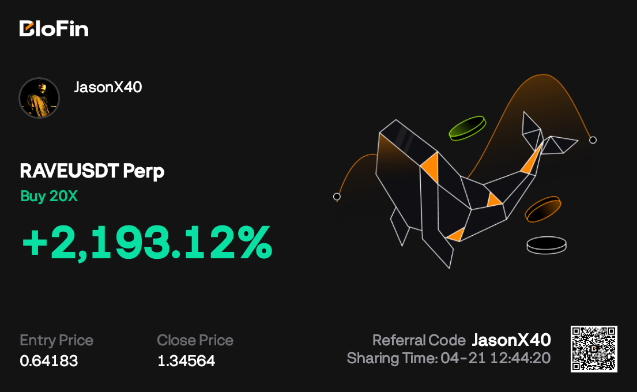
The gains on $RAVE just keep coming! 🚀🚀🚀
We’ve officially cleared Target 3 at 2.30. That’s a massive move on the 20x position. Absolute monster of a trade—hope you all caught some of this action! 📈🔥
#RAVE #CryptoTrading #ToTheMoon #Profits #TechnicalAnalysis #Bullish #blofin
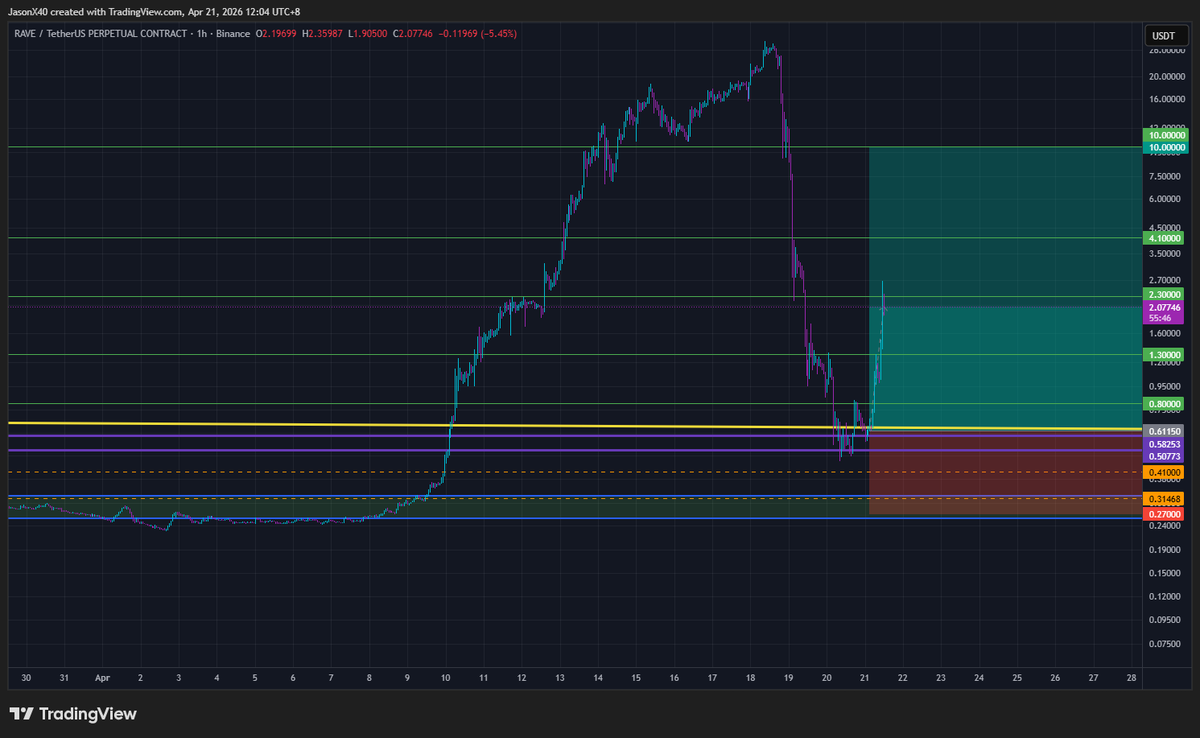
$RAVE is on the move! 🚀
Target 1 and 2 have been officially hit. Great to see the price action following the plan so cleanly. 📈
#RAVE #CryptoTrading #TechnicalAnalysis #Profits #Bullish
749