
Joined October 2020
- Tweets 50
- Following 439
- Followers 172
- Likes 134
16 Photos and videos


jbg retweeted

8 Oct 2024
A new Urban report in the Do No Harm Guide series explores #international differences, approaches, & perspectives that can broaden convos on #equitable #data use & offer opportunity for people across the world to learn from each other. urbn.is/4eWb7UE @tableau @salesforce
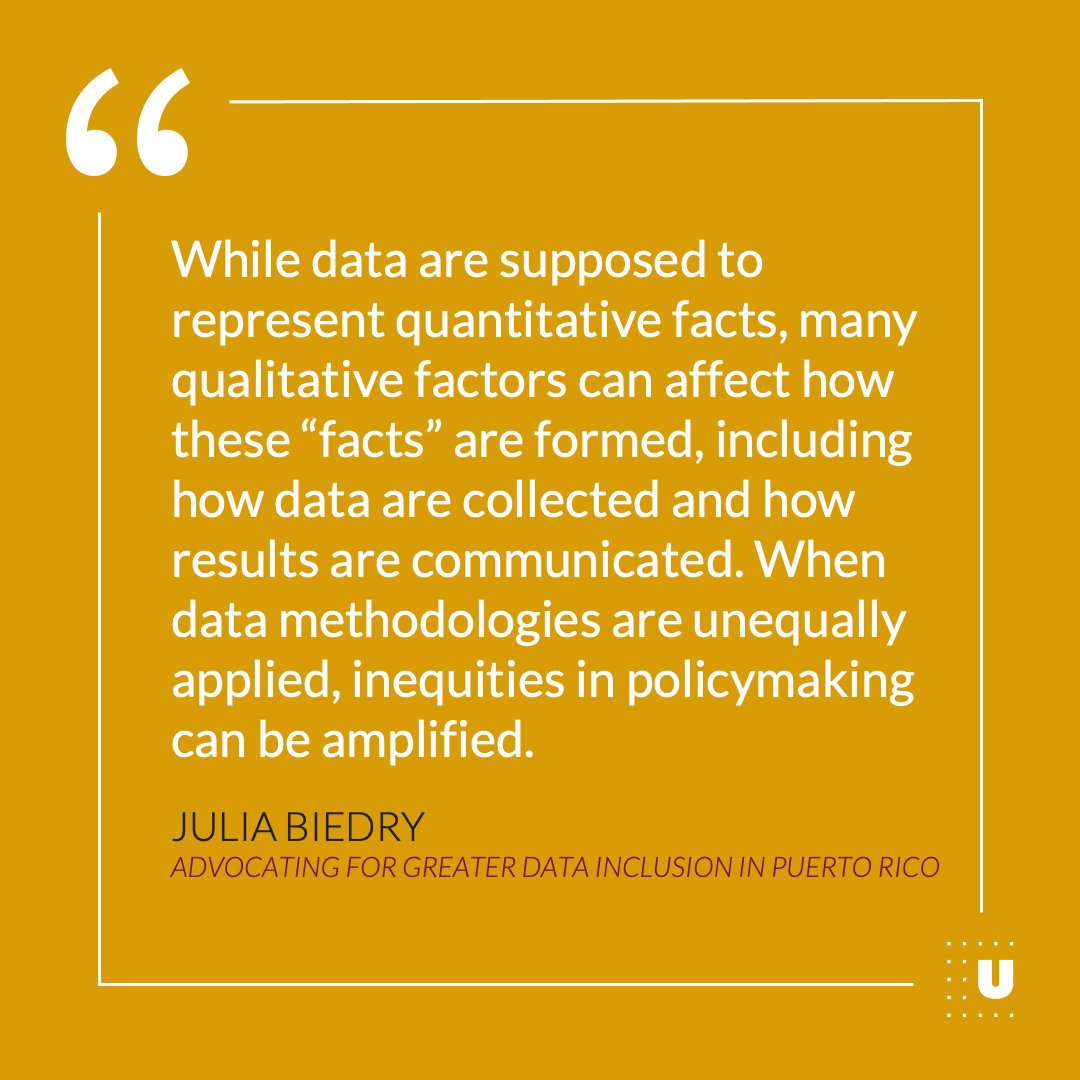
ALT Quote by Julia Biedry on the impact of qualitative facts on data communication and methodologies, advocating for greater data inclusion in Puerto Rico, displayed on a yellow background with a stylized quotation mark.
2
4
1,106

16 May 2023
Amazing panel on decoding disparity and representation using public data at #CfASummit — as a puerto rican-american data person, I’ve often noticed Puerto Rico and other islands missing from large government datasets. thanks Rekha @urbaninstitute for your insightful comments!
1
1
247
jbg retweeted

3 Mar 2023
NYC heating complaints are associated with structure fires, particularly in immigrant, Black, and Latinx communities. Safe heating is a legal right in NYC and proper enforcement is needed to minimize fire-related harm. @csheckter ja.ma/3KPy5AZ
3
5
1,506
13 Mar 2023
thank you for publishing our research letter on this important topic @JAMANetworkOpen !! more awareness and action is needed to protect these communities from fires.
3 Mar 2023

NYC heating complaints are associated with structure fires, particularly in immigrant, Black, and Latinx communities. Safe heating is a legal right in NYC and proper enforcement is needed to minimize fire-related harm. @csheckter ja.ma/3KPy5AZ
1
1
376

Feeling nostalgic with the latest #BestOfTableauWeb from @datawithjules. Get your monthly dose of Tableau tips, tricks, and inspiration from the community. tabsoft.co/3v3Qukd
4
20
4,614
8 Dec 2022
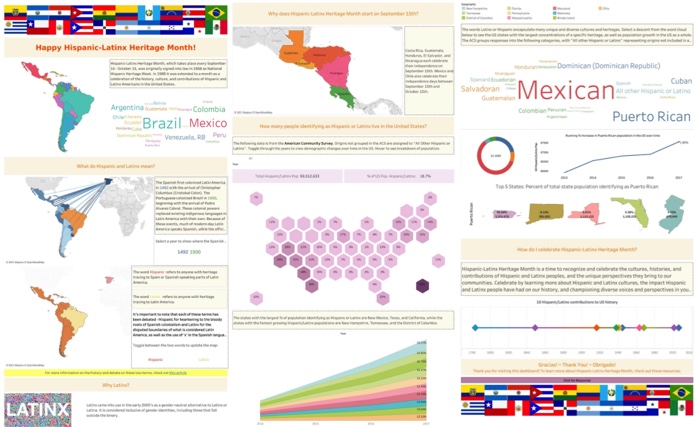
hi #datafam! made a viz today to mark #LatinaEqualPayDay, which symbolizes how long into the next year latinas would have to work to equal the median earnings of a non-hispanic white man in 2021. let's join together to close the wage gap, and check out @EqualPay2dayOrg for more!
ALT an infographic with facts about Latina Equal Pay Day
3
17 Nov 2022
did you know that water is the most common @pokemon type? i've been doing a bit of ~pokelytics~ in advance of the release of #pokemonscarletviolet tomorrow 🎉 (this @tableau treemap takes into account both a pokemon's types, so gyarados would count in both water flying) #datafam
ALT a treemap visualization showing the most frequent pokemon types
3
15
17 Nov 2022
this was a bit inspired by @WJSutton12 @Visual_Endgame @ninjavizlouis #gamesnightviz, thanks for such a fun community project!!🎮📈
1
4
27 Sep 2022
was so excited to collaborate with @BrookingsInst, @bigchange_ and @LEGOfoundation to create this data visualization launching @BigEdConvo globally at #UNGA77 last week -- igniting a million conversations about the purpose of education using data. 📚📈tinyurl.com/bigedconvo
2
5
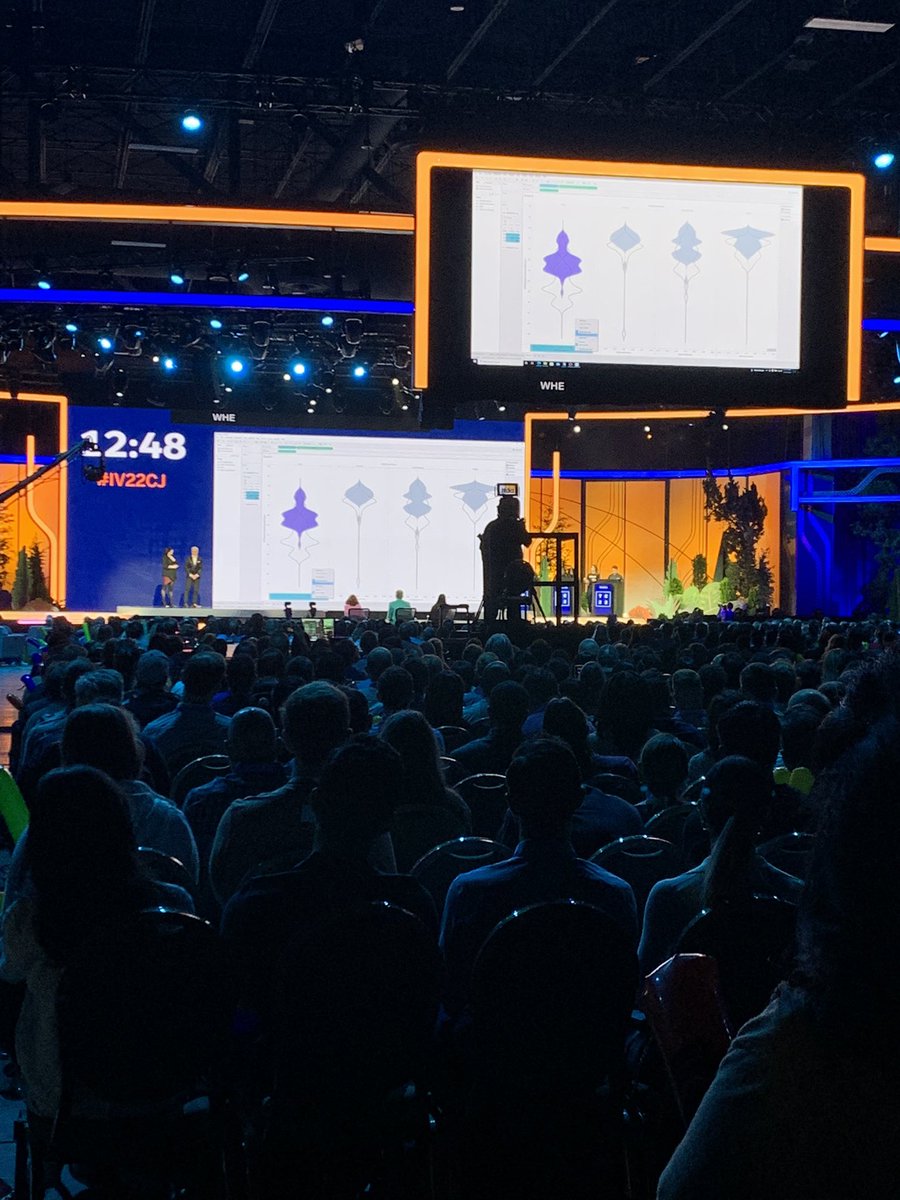
18 May 2022
love the term “bird’s eye view vs worm’s eye view” @FryRsquared 😂have been looking for a way to describe this when zooming in/out of data 📊 #data22 #tc22 #ironviz
1
2
An all-new #BestofTableauWeb is here. Tableau lead solutions engineer @datawithjules covers the latest Tableau tips, tricks and inspiration. tabsoft.co/364dgj7
2
8
36
12 Jan 2022
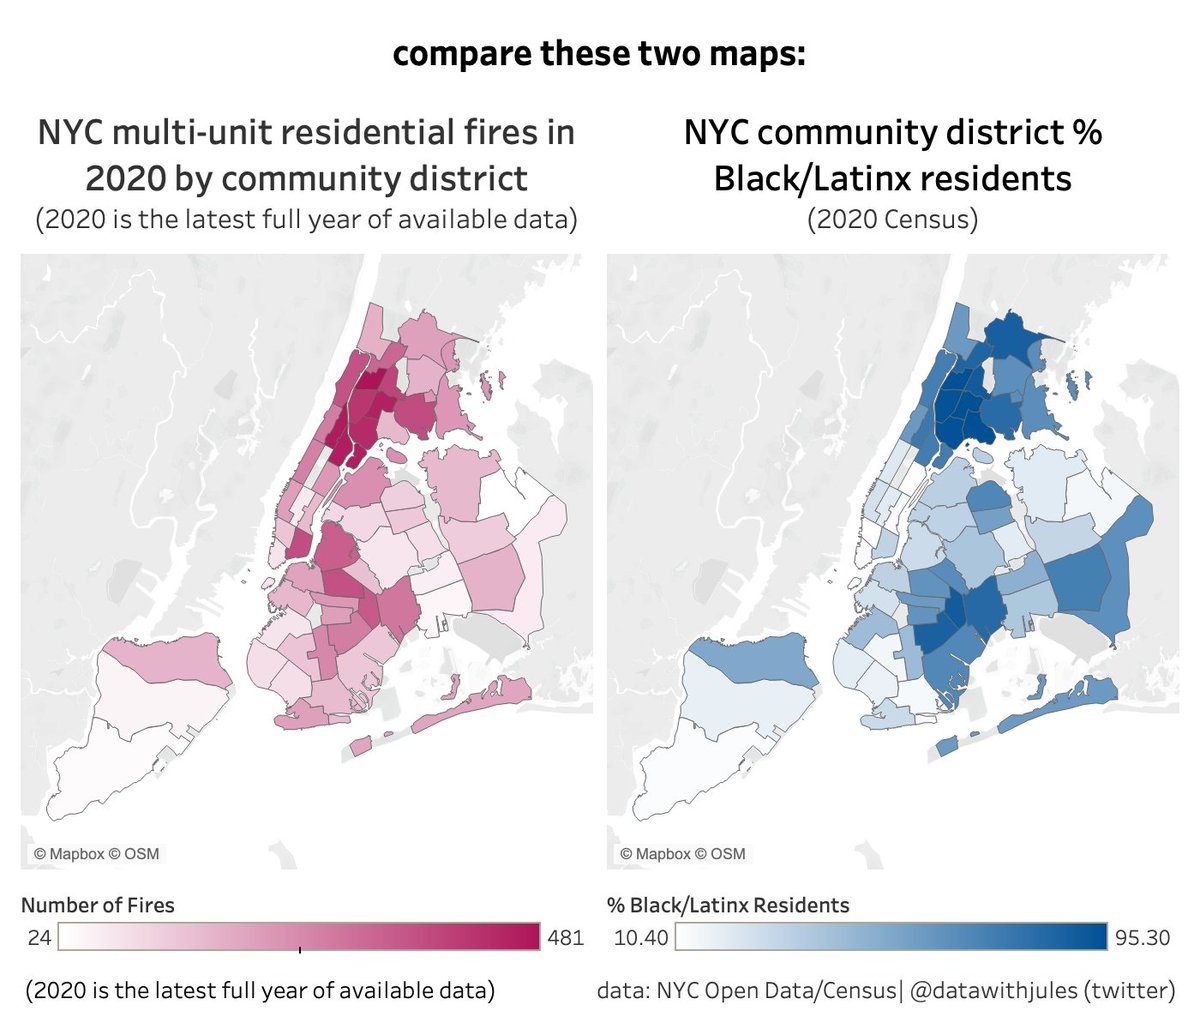
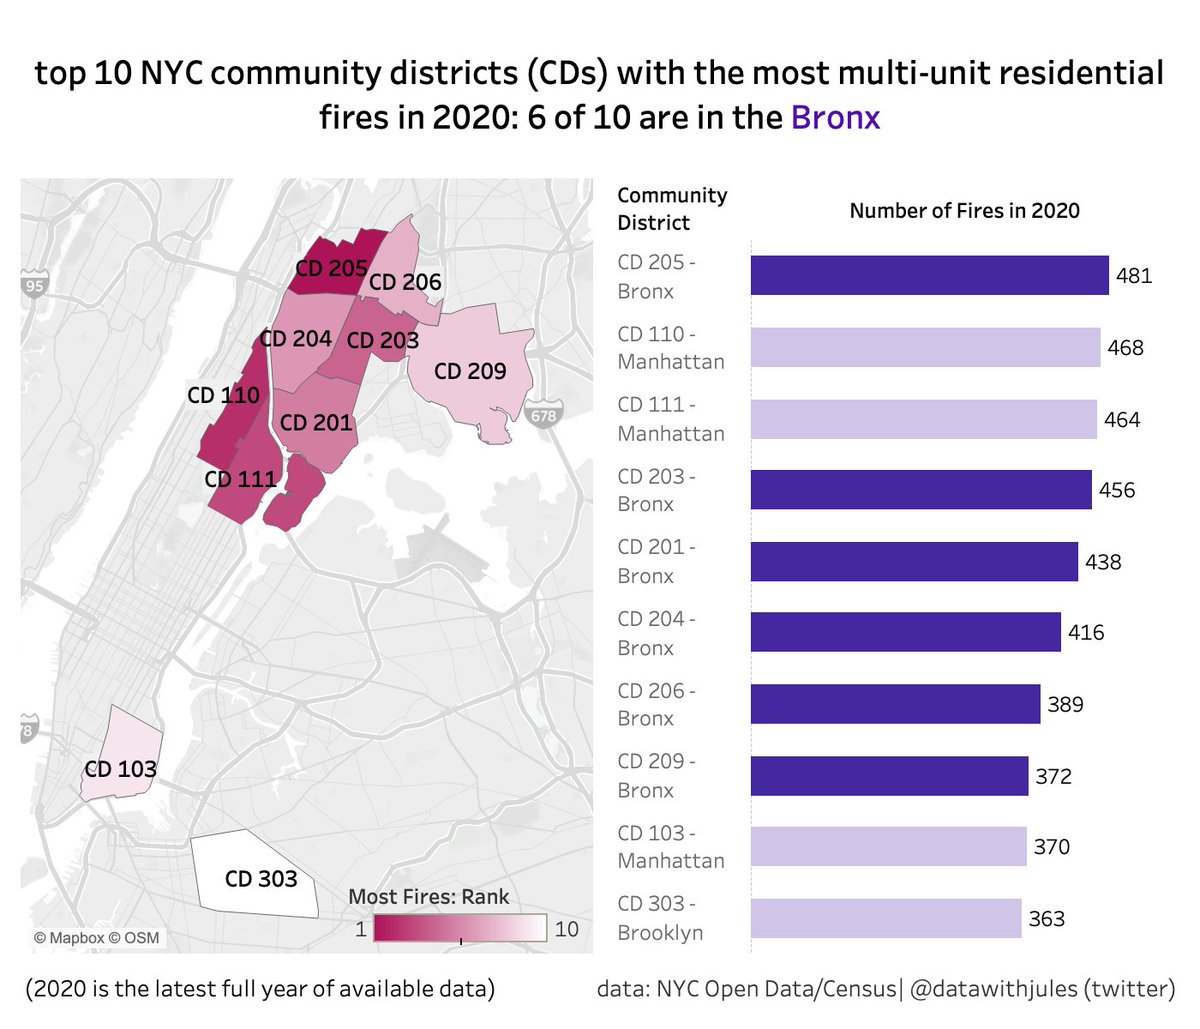
did this analysis after reading @annia's thread about the Bronx fires and wondering what the data said about the circumstances that led to it
12 Jan 2022

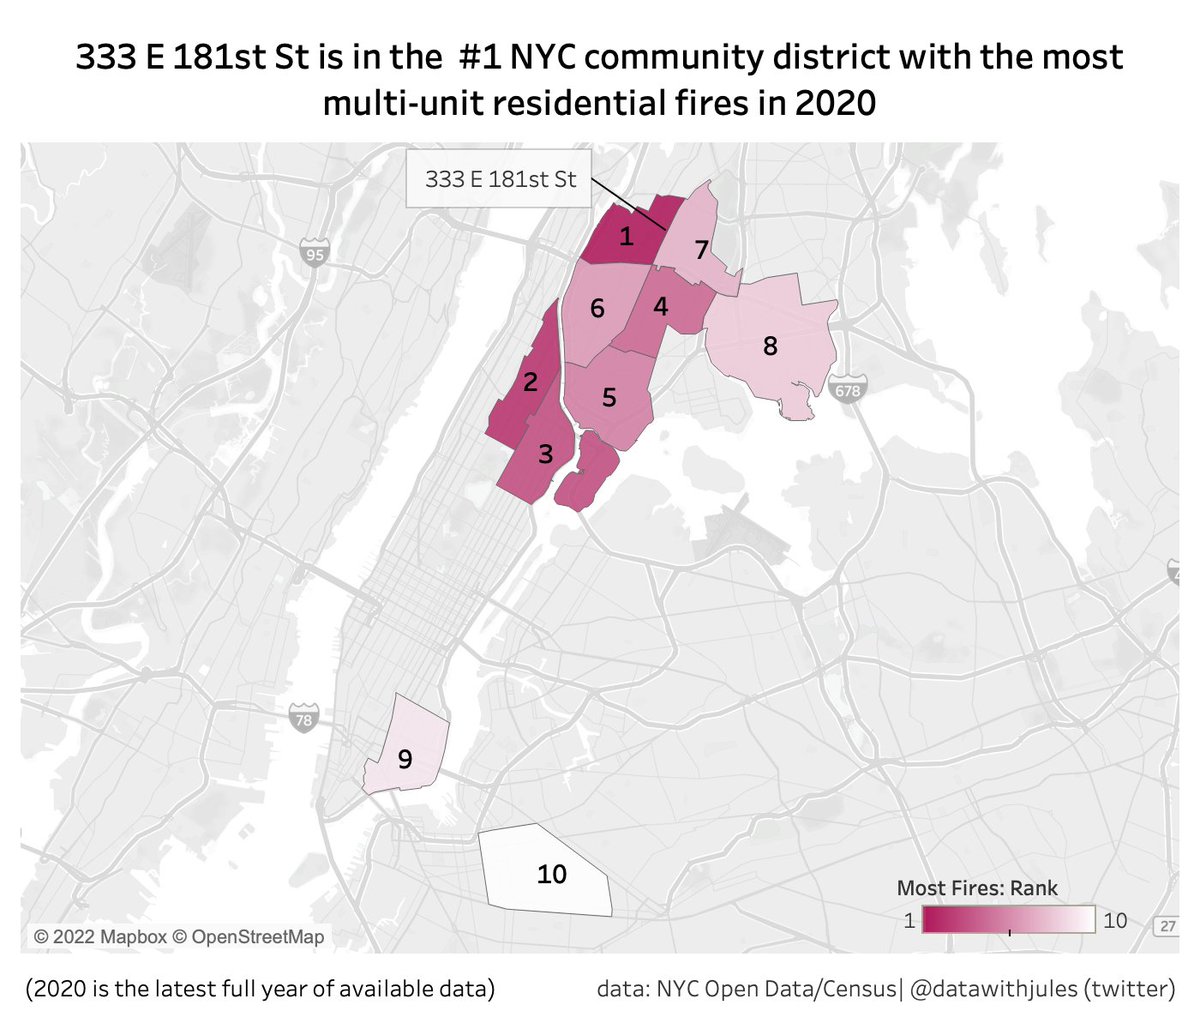
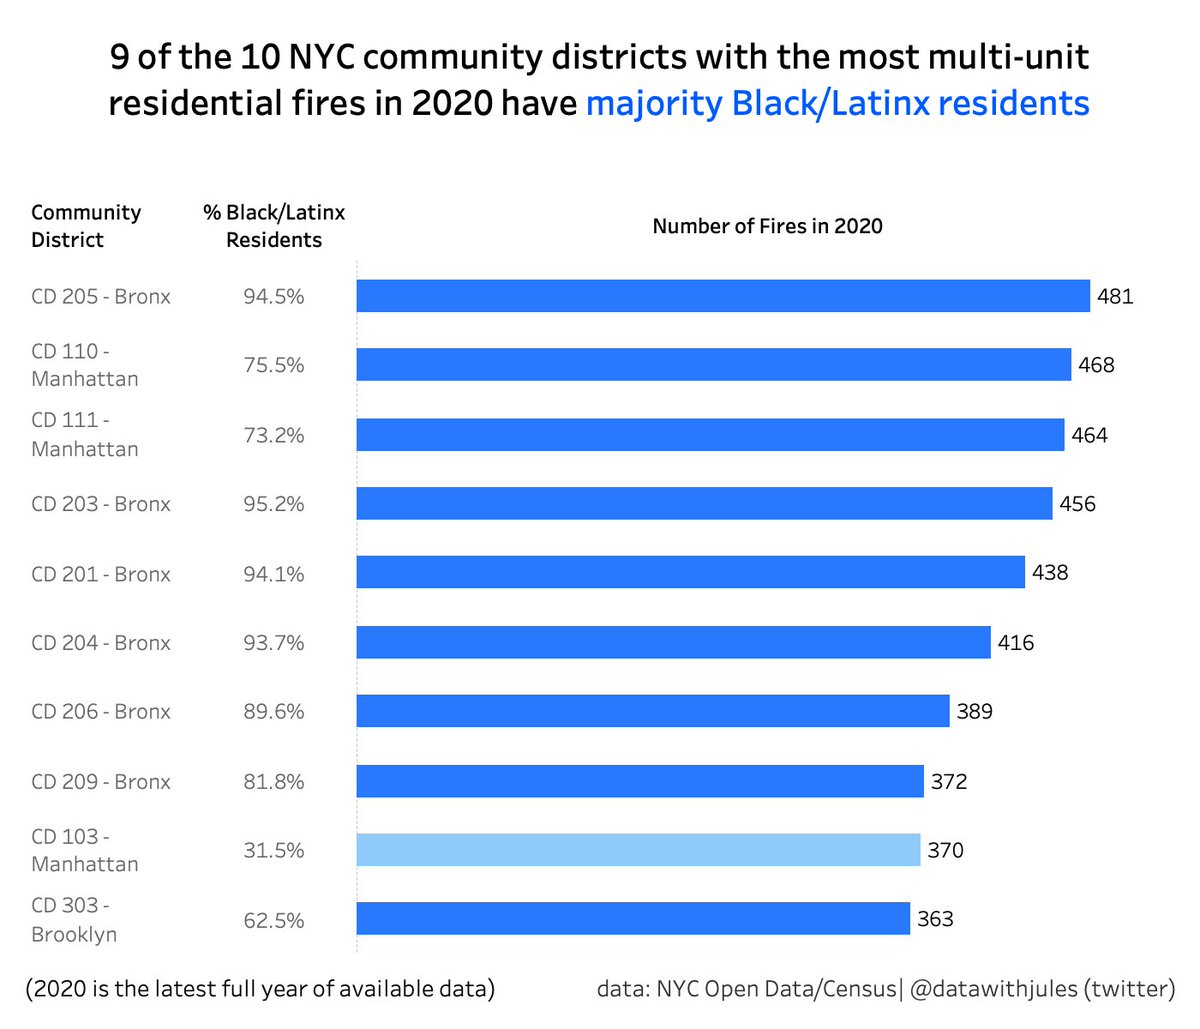
pulled some NYC/census data after hearing about the heartbreaking bronx fire. sadly the data paints a picture of what I feared to be true -- this tragedy isn't an isolated data point -- either in the borough or the diverse community of residents it affected. #bronxfire #data
1
4
12 Jan 2022
pulled some NYC/census data after hearing about the heartbreaking bronx fire. sadly the data paints a picture of what I feared to be true -- this tragedy isn't an isolated data point -- either in the borough or the diverse community of residents it affected. #bronxfire #data
2
3
10
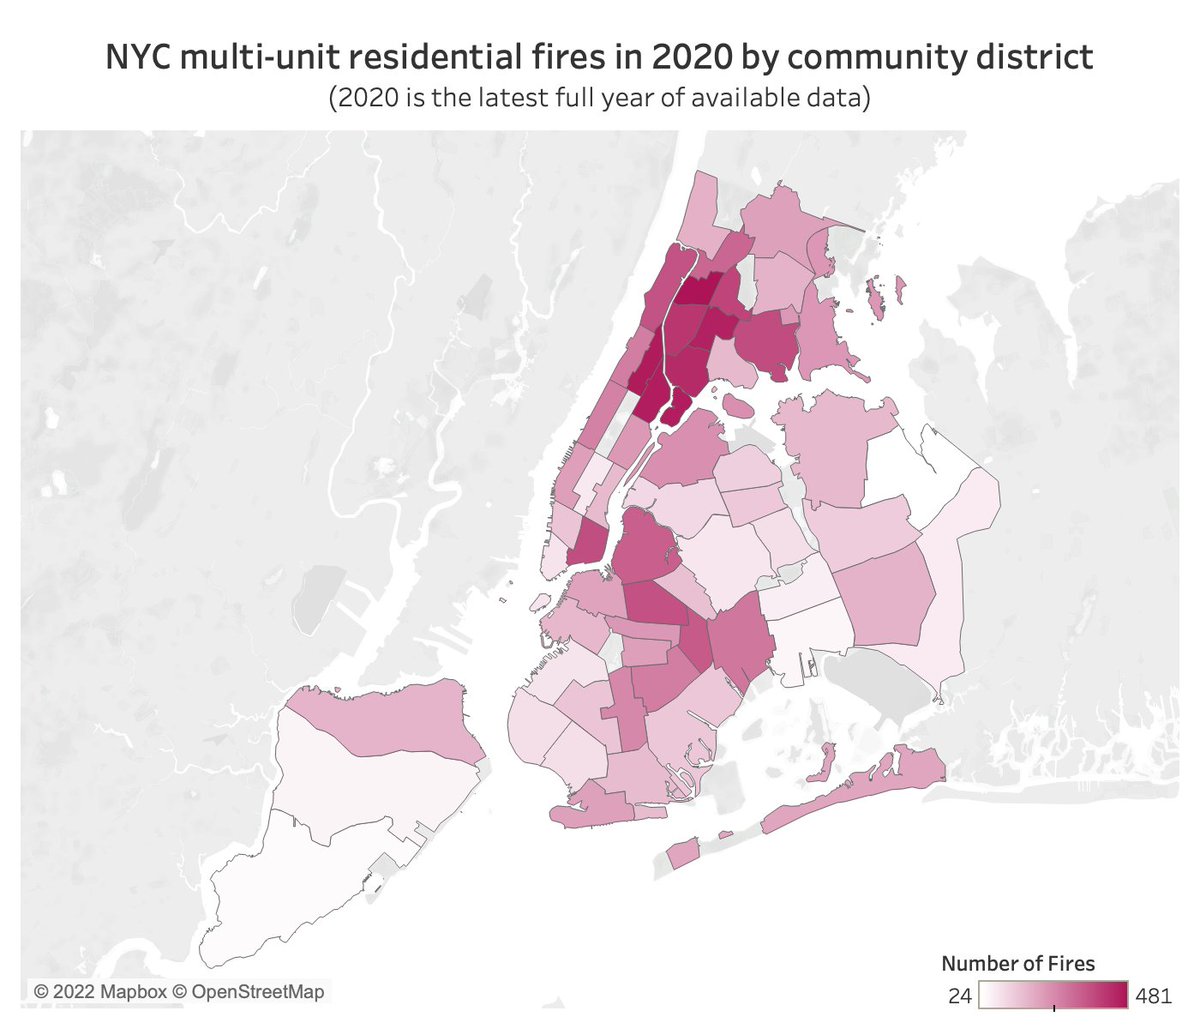
12 Jan 2022
one of the most striking comparisons was looking at a map of multi-unit residential fires in NYC in 2020 (last full year of data available) next to a map of percent of new yorkers identifying as Black or Latinx. #bronxfire #data
2

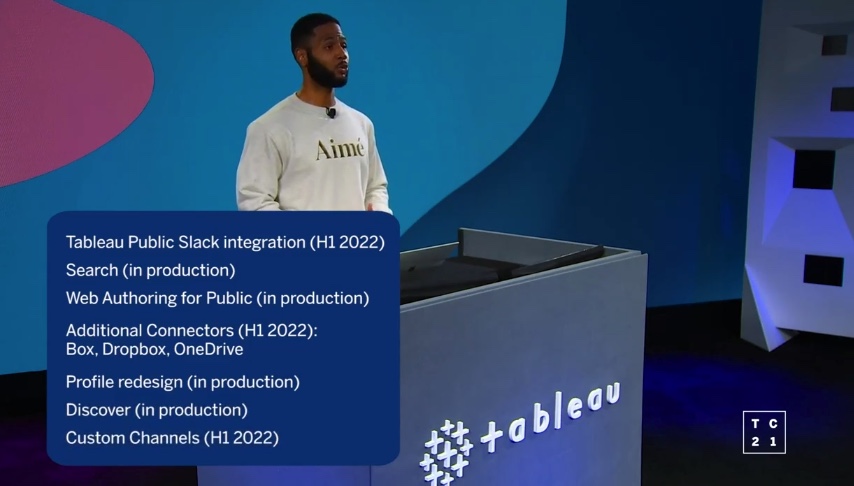
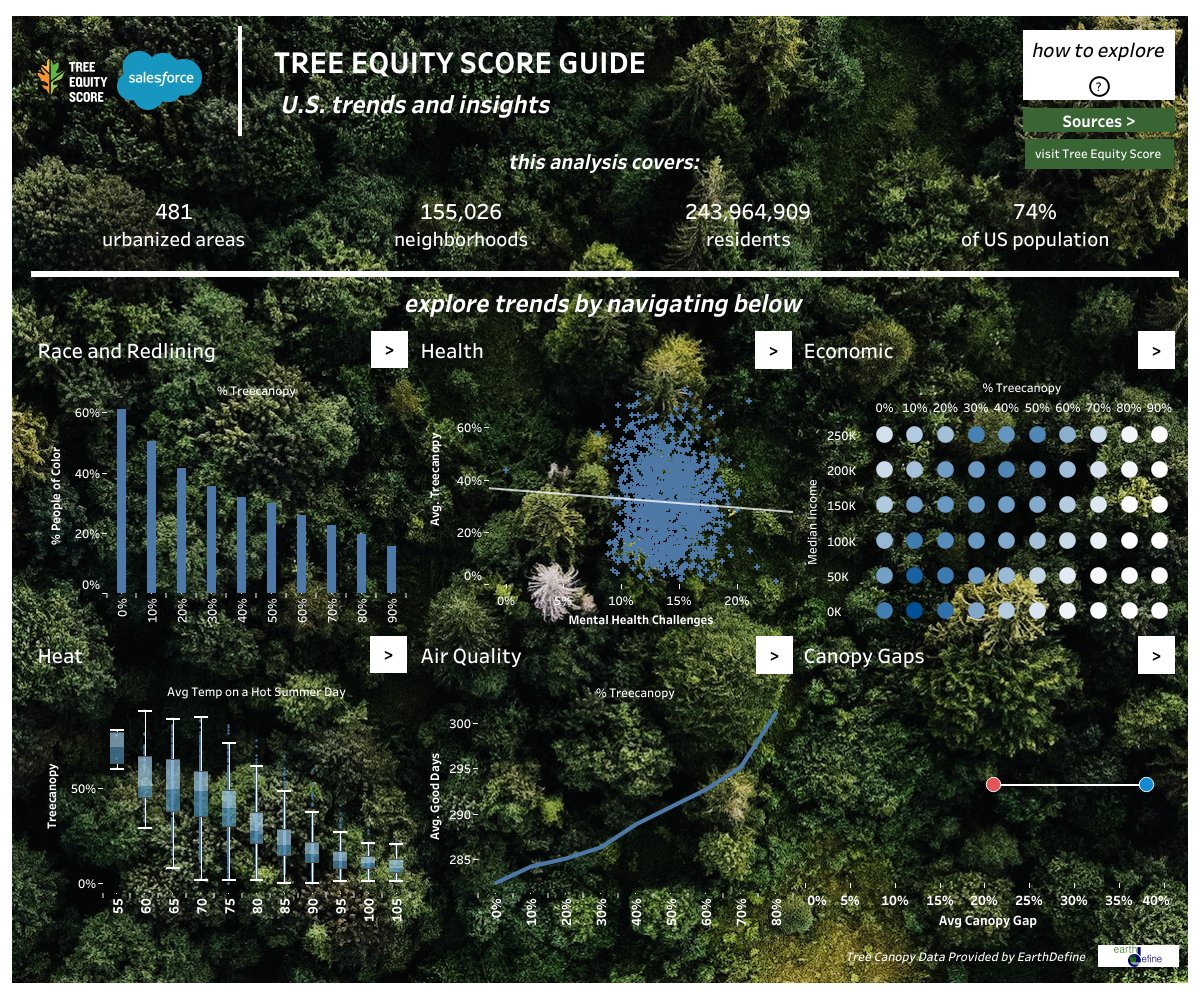
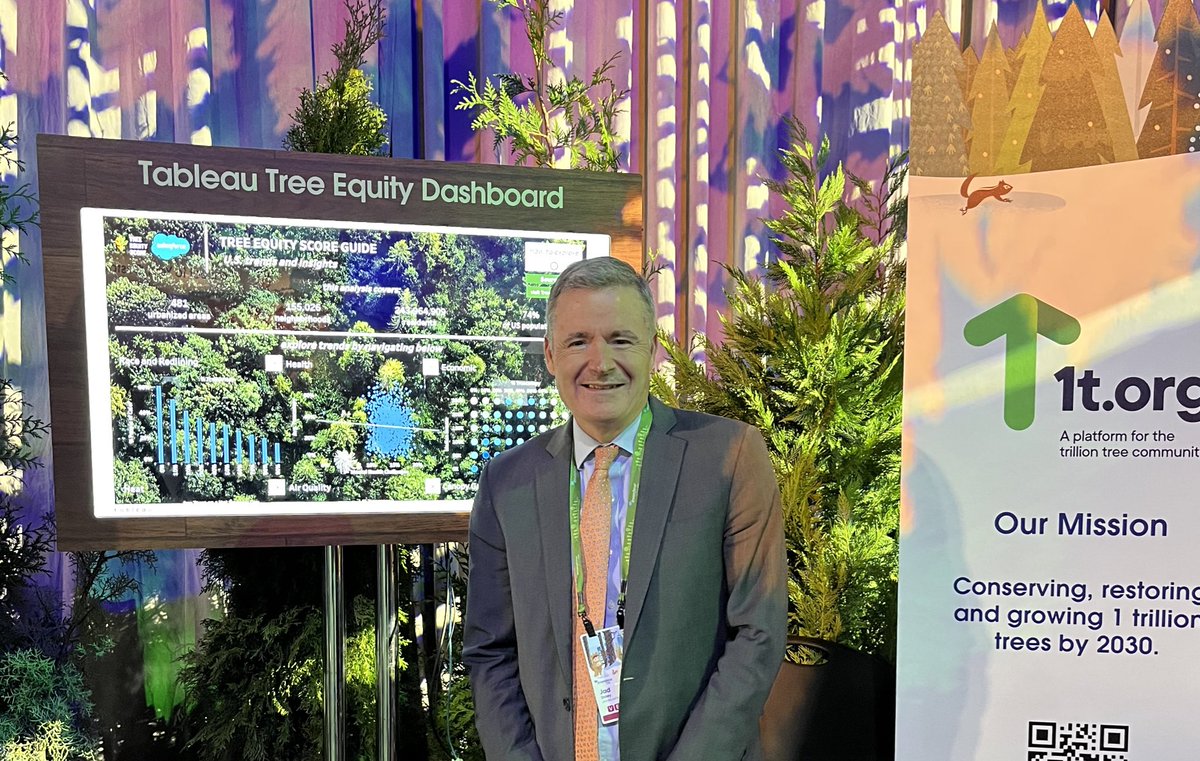
I’m grateful #TreeEquity has Center Stage here at #DFNYC. The new @tableau Tree Equity Dashboard has added a whole new power to how we tell this story & build the movement.
🙏 @Benioff @salesforce from @AmericanForests! @1t_org_US
8
30
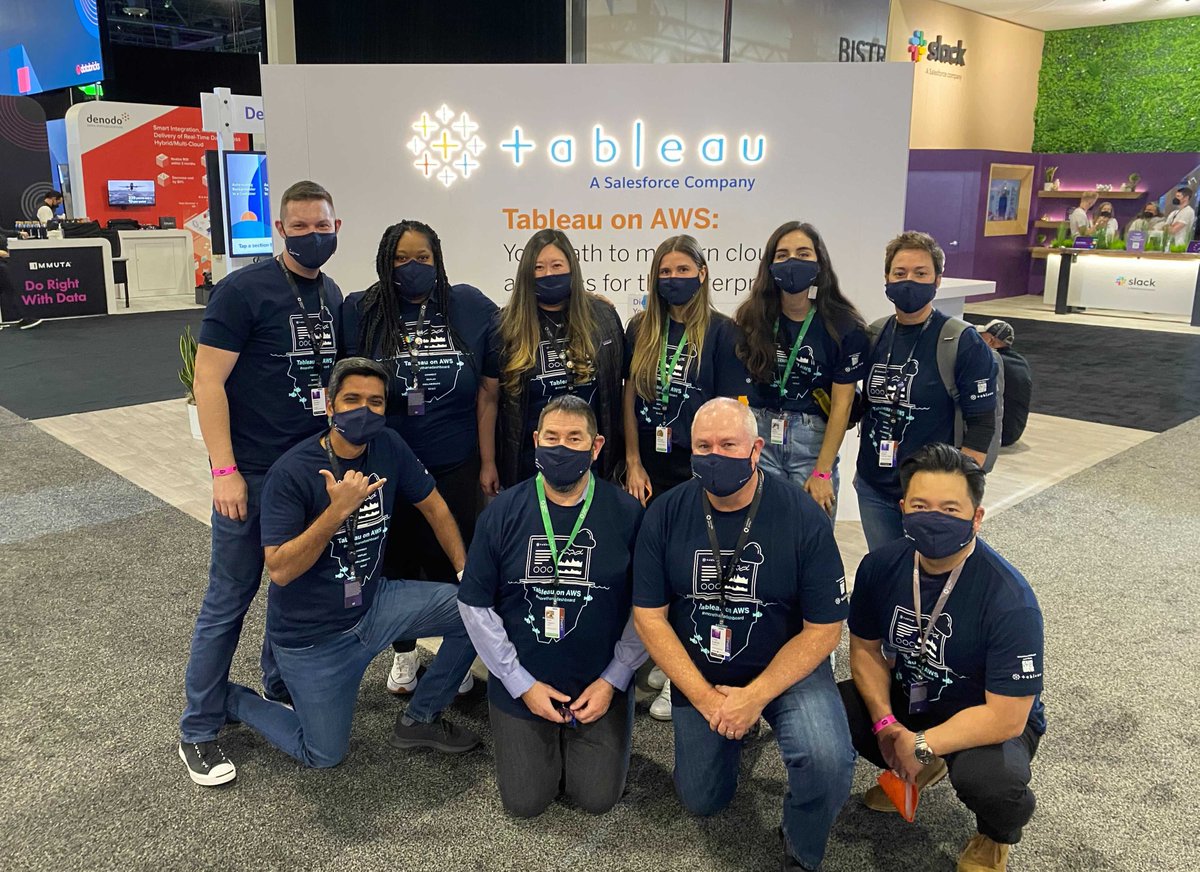
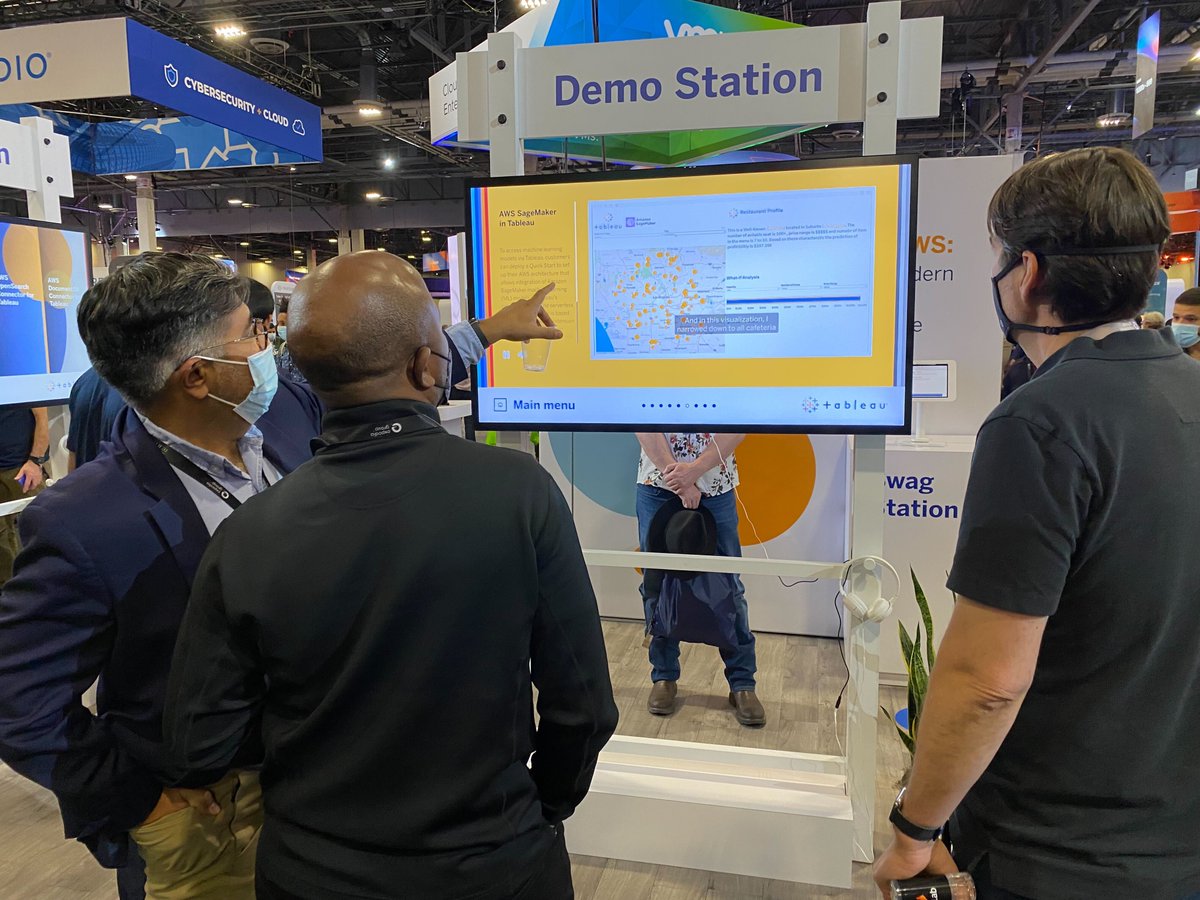
#TableauOnAWS your path to Modern Cloud Analytics for the enterprise. #reInvent with Tableau ➡️ tabsoft.co/31mNkgc

3
20
30 Nov 2021
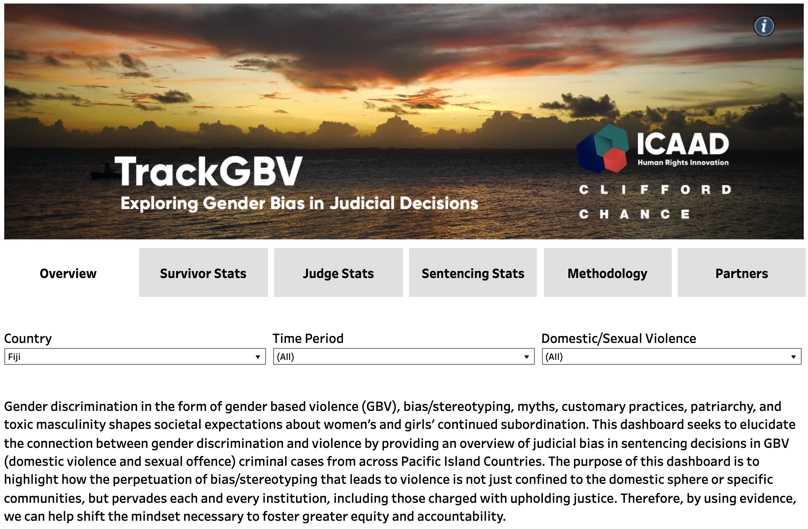
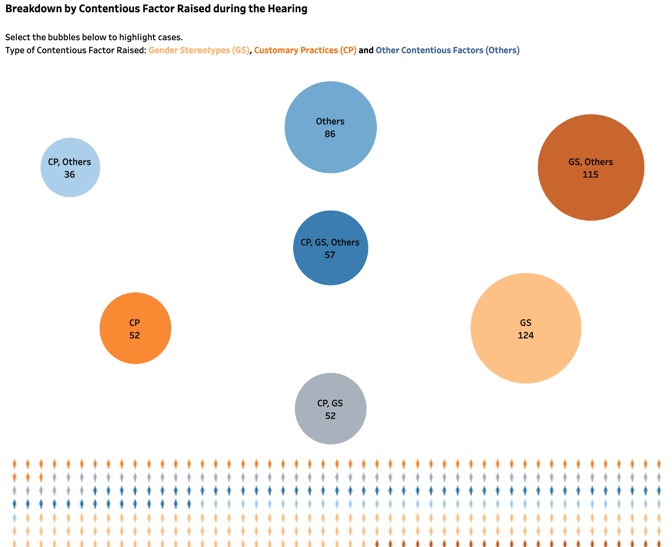
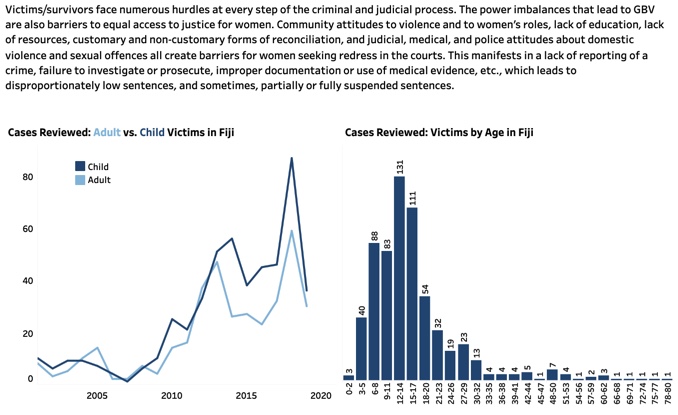
shout out to @ICAADglobal this #GivingTuesday, who just launched an impactful project tracking bias in #GenderBasedViolence legal outcomes. grateful to have been able to advise on this project! check out the #dataviz: tinyurl.com/trackgbv and donate:tinyurl.com/ggart
1
3
11 Nov 2021
1
7