
Joined August 2011
- Tweets 12,703
- Following 2,901
- Followers 3,855
- Likes 3,584
2,856 Photos and videos


Pinned Tweet

21 Feb 2025
🚨 FREE GIVEAWAY ALERT! 🚨
Want to leverage AI for smarter trading? 📈
I'm giving away my Step-by-Step AI Chart Analysis Guide!
To enter:
1️⃣ Follow @binarypro
2️⃣ RT this post
3️⃣ Tag 3 trading buddies
Guide is Send Per DM in less than 24 hours! 🎁
#TradingAI #FinTech #Trading #CryptoTrading
6
14
2,145
Binary Options Pro retweeted

Short term corrections can persist while the higher timeframe bullish structure stays intact. I advise you follow Titan of Crypto's TG channel, he gives great insights there, simply search “WashigoriraTA” on telegram.
1
1
12
Binary Options Pro retweeted

Jun 13
1
1
12
133
Binary Options Pro retweeted

Good morning and Happy Sunday ☀️
Every day is special.
Not because something extraordinary happens, but because it's another chance to learn, improve, and move one step closer to your goals.
Don't wait for the perfect moment. Make today count.
Have an amazing Sunday, legends. 🚀

27
1
25
687
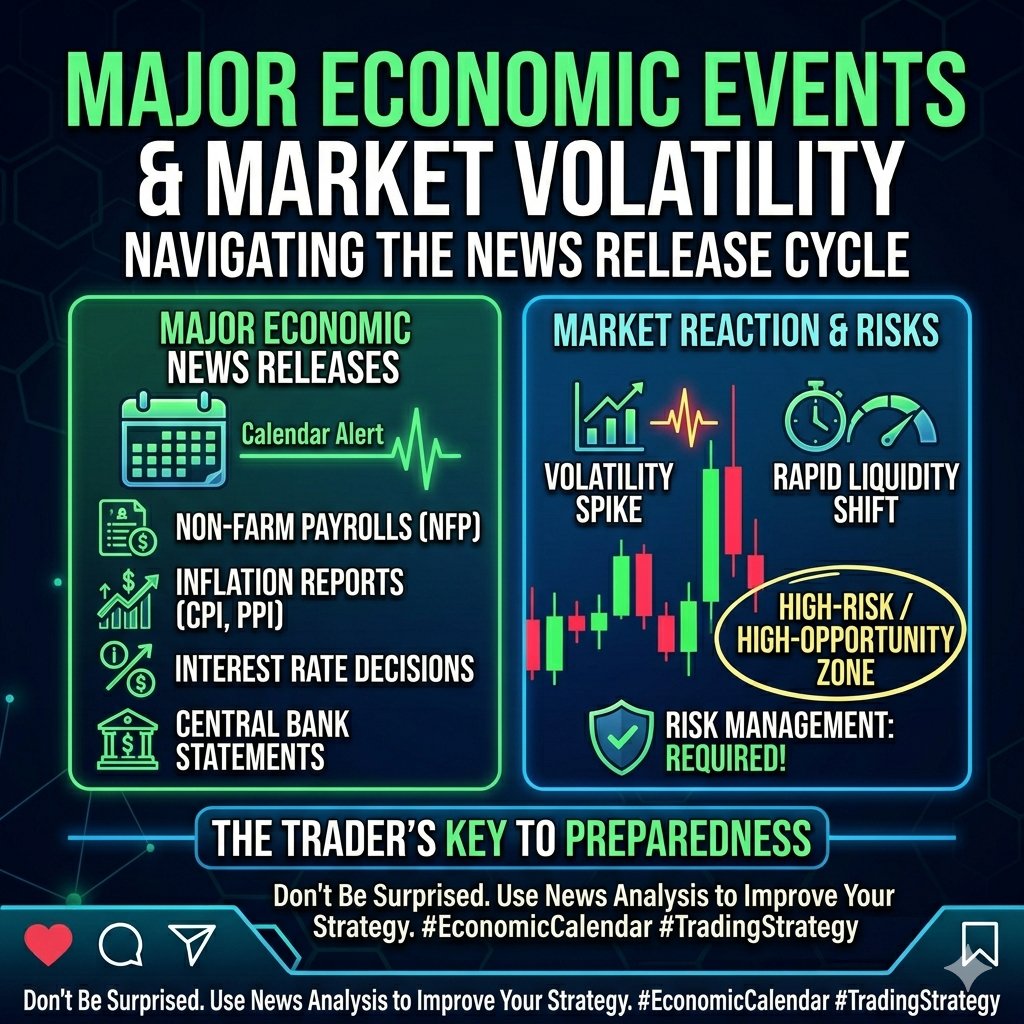
Major economic events can create significant market volatility within seconds. News releases such as Non-Farm Payrolls, inflation reports, interest rate decisions, and central bank statements often influence currency prices and trading opportunities. Understanding these events is essential for traders who want to navigate the markets effectively.
When important news is released, liquidity and volatility can increase rapidly. Currency pairs may experience sharp movements that create both opportunities and risks. Traders who understand economic calendars and market expectations are often better prepared to react to these changes.
Staying informed about major economic events can improve trade planning and risk management. Rather than being surprised by sudden market movements, traders can use news analysis as part of a comprehensive trading strategy.
Role of economic news and events in trading: youtu.be/6zYotOTTyP4
#ForexNews #ForexTrading #EconomicCalendar #TradingEducation #MarketAnalysis
14
Imagine two traders starting with the same account balance. One risks 20% of their account on every trade, while the other risks only 2%. After a series of losses, the first trader may struggle to recover, while the second trader still has enough capital to continue trading confidently. This simple example highlights the importance of risk management.
Professional traders understand that preserving capital is essential for long-term growth. Proper position sizing, realistic profit targets, and controlled risk exposure allow traders to survive losing streaks and take advantage of future opportunities. Risk management is often the difference between consistent traders and those who constantly restart their accounts.
If you want sustainable success in forex trading and binary options trading, focus on protecting your account before chasing profits. A disciplined approach to risk can help you stay in the market long enough to benefit from your strategy.
Learn risk management for trading: linkedin.com/pulse/top-risk-…
#RiskManagement #ForexTrading #TradingSuccess #BinaryOptions #TraderLife
21
Many traders focus on finding the perfect strategy while ignoring the mistakes that quietly destroy trading accounts. Overleveraging, revenge trading, and risking too much on a single position are among the most common reasons traders struggle to achieve long-term success. Even profitable setups can lead to losses when proper risk management is ignored.
One of the biggest challenges in forex trading and binary options trading is controlling emotions. Fear and greed often push traders into making impulsive decisions, entering trades without confirmation, or increasing position sizes after losses. Developing discipline and following a structured trading plan can help avoid these costly errors.
Trading success is often less about winning more trades and more about protecting capital. Focus on consistency, risk control, and patience. Avoiding major mistakes can have a greater impact on your results than finding a new indicator or strategy.
Complete guide on pocket option trading: youtu.be/JDO9YRKUYLg
#TradingTips #ForexTrading #BinaryOptions #RiskManagement #TradingMindset
19
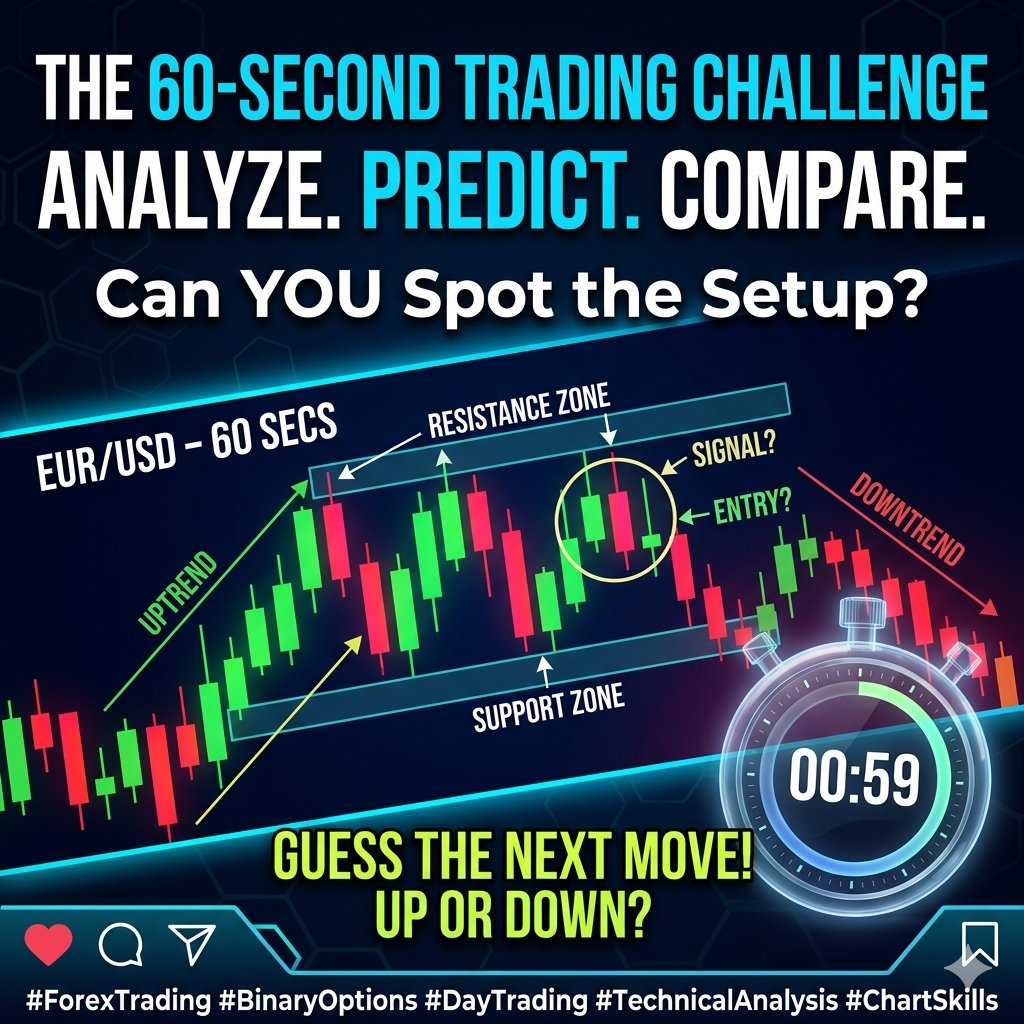
Every trader sees the market differently, and that's what makes trading so exciting. Looking at a chart for just 60 seconds can reveal trends, support and resistance zones, candlestick signals, and potential entry points. The challenge is simple: analyze the chart, decide whether the market is likely to move up or down, and then compare your prediction with the actual result. This type of exercise helps improve decision-making skills and strengthens market analysis over time.
Successful forex trading and binary options trading are not about guessing. They are about identifying high-probability setups and managing risk effectively. By practicing quick chart analysis regularly, traders can sharpen their ability to recognize opportunities and avoid emotional decisions. The more charts you study, the better your understanding of market behavior becomes.
Challenge yourself today. Take a chart, set a timer for 60 seconds, make your prediction, and evaluate the outcome. Consistent practice can help build confidence and improve your trading performance over the long term.
Forex Trendy User Review: youtube.com/watch?v=JQqlgx3R…
#ForexTrading #BinaryOptions #TradingChallenge #TechnicalAnalysis #DayTrading
1
27
Binary Options Pro retweeted

Jun 10
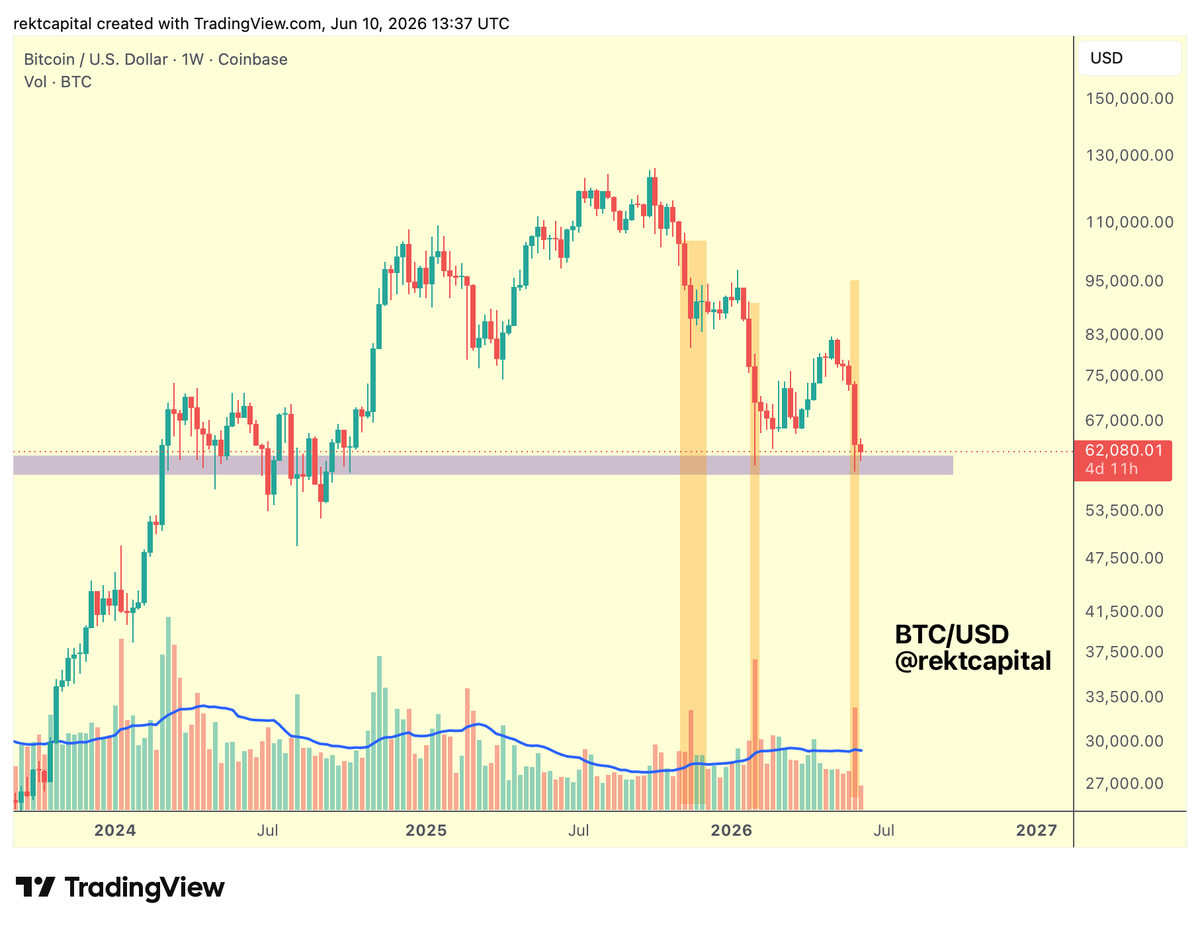
#BTC
One could make a case for Seller Exhaustion on this recent bout of Bearish Acceleration
Bitcoin crashed right into the ~$60,000 historical demand area (purple) on high sell-side volume
Previous crashes which occurred on high seller volume in this Bear Market actually preceded temporary local bottoms to kickstart limited rallies of relief before additional macro downside over time
Therefore, this $60k historical demand area is very likely a weakening support so while a short-term rebound could make sense...
Over time price is likely to breakdown to new 2026 lows
The most important level are the February 2026 lows and if they act as resistance then $60k may not be able to prop price up for too long
$BTC #Crypto #Bitcoin
36
40
331
23,581
Jun 10
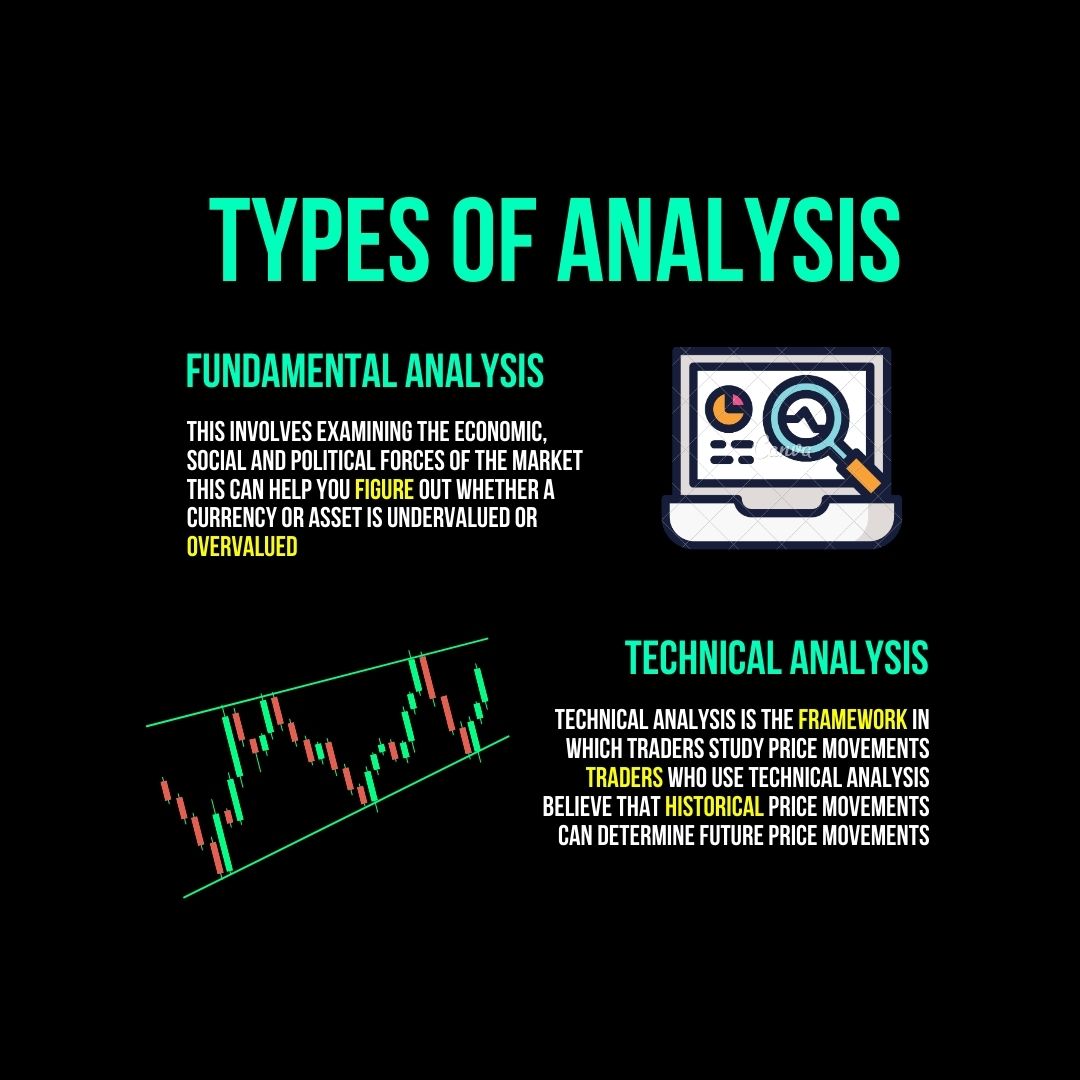
When it comes to trading, knowing how to analyze the market is half the battle. Let’s dive into the two main types of analysis every trader should know: Fundamental and Technical Analysis.
Fundamental Analysis
Think of this as the "big picture" approach. It focuses on understanding the economic, financial, and political factors that affect an asset’s value.
Key Elements:
- Economic indicators like GDP, interest rates, and inflation.
- Company performance for stocks (earnings, revenue, etc.).
- Global news and events (geopolitics, policy changes).
Example: If the Federal Reserve announces higher interest rates, it may strengthen the USD in forex markets.
Used by: Long-term investors and traders aiming to understand the intrinsic value of an asset.
Technical Analysis
This is all about price action and charts. It focuses on historical price movements to predict future trends.
Key Tools:
- Candlestick patterns.
- Support and resistance levels.
- Indicators like RSI, MACD, and moving averages.
Example: Spotting a “double bottom” pattern on a chart may indicate a potential upward trend.
Used by: Day traders, swing traders, and scalpers looking for short-term opportunities.
Which One Should You Use?
- Fundamental Analysis helps you understand why the market is moving.
- Technical Analysis helps you decide when to enter or exit a trade.
Want to learn both types of analysis in detail? Enroll Now: whop.com/trading-titan-tradi…
#ForexTrading #BinaryOptions #FundamentalAnalysis #TechnicalAnalysis #TradingEducation
33
Binary Options Pro retweeted

Jun 7
$BTC JUST TOUCHED THE DCA ZONE
Every time this happened the market called Bitcoin dead
Every time the people who bought became very wealthy
2019 - Bitcoin was finished, dca zone printed, then 2,200%
2022 - Bitcoin was finished, dca zone printed, then 639%
2026 - Bitcoin is finished, dca zone printing right now
The pattern has two sides
Maximum pain before maximum gain
Bookmark this post we'll talk about it later
Follow me - next update incoming
111
149
708
125,142
Binary Options Pro retweeted

Jun 7
#Bitcoin
Historically, when BTC exceeds the lower Bollinger Band on the 3-week timeframe, major lows have usually followed.
This time, however, the signal appeared unusually early in the cycle.

40
50
323
21,067
Jun 7
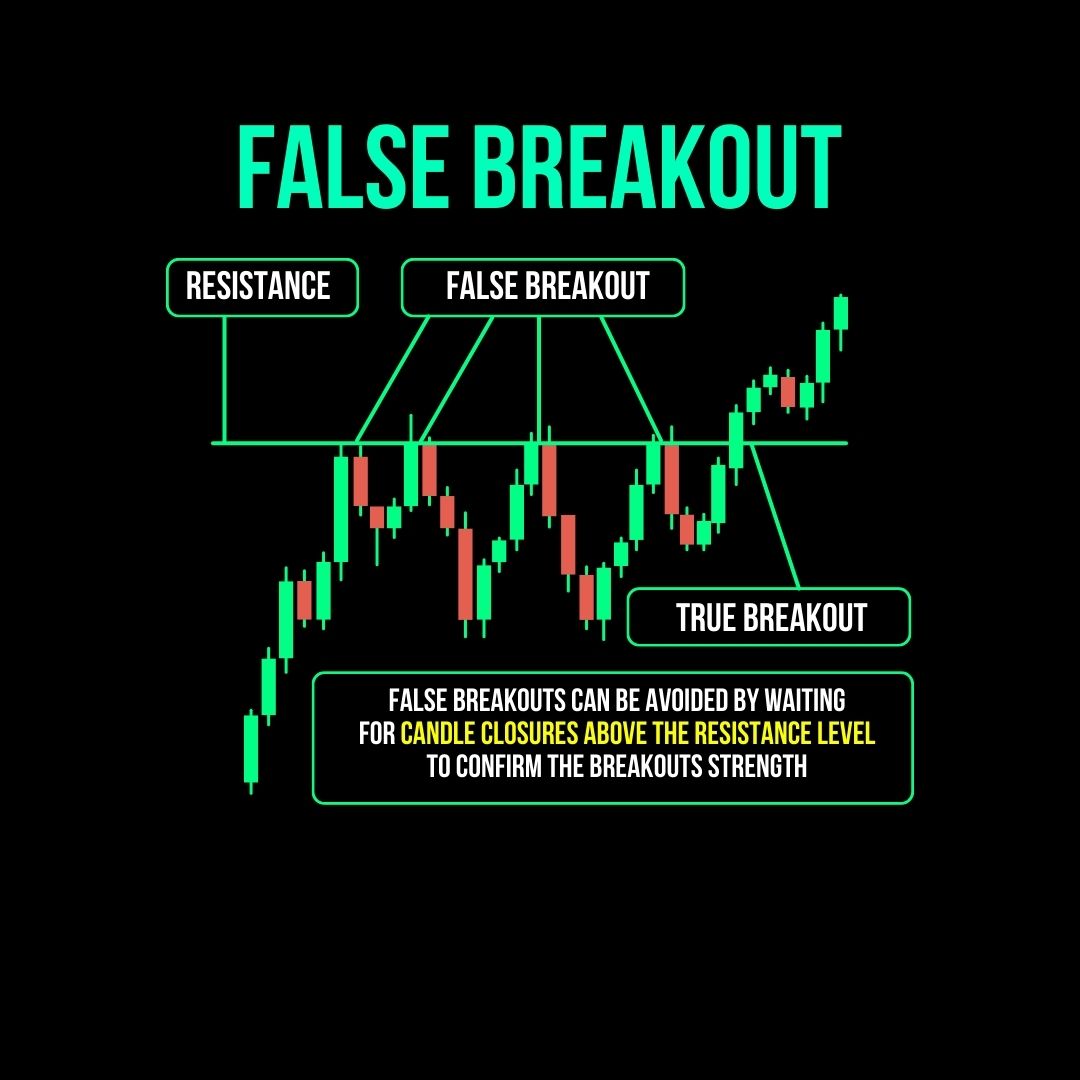
When trading, breakouts can lead to incredible opportunities; or costly mistakes if you're caught in a false breakout. Here's how to tell the difference and protect your trades!
False Breakout 🚩
A false breakout happens when price temporarily breaks a key level (like support or resistance) but fails to sustain the move. Traders who jump in too early can end up in losing positions as the price reverses.
True Breakout ✅
A true breakout is when price breaks a key level and sustains the move, often confirming a new trend or momentum in that direction.
How to Avoid False Breakouts?
👉 Wait for Candle Closure:
Before jumping into a trade, wait for the breakout candle to close above the resistance level (or below support for bearish breakouts). A closed candle confirms the breakout strength and reduces the chances of being caught in fake moves.
Do you struggle with false breakouts? Let us know in the comments below! 👇
#TradingTips #BreakoutStrategy #ForexTrading #BinaryOptions
25
Jun 7
The Shooting Star is a powerful bearish reversal pattern, signaling a potential trend shift after an uptrend. This candlestick looks like a star in the sky, with a small body at the bottom and a long upper wick. It tells traders that buyers tried to push the price higher, but sellers took control by the close, driving the price down.
Key Features:
1. Small real body (can be either red or green)
2. Long upper shadow (at least twice the size of the body)
3. Little or no lower shadow
What does it mean?
It indicates that upward momentum is weakening, and a potential downward move might follow. It’s important to wait for confirmation (like a bearish candle after the Shooting Star) before entering a trade.
Pro Tip: Always combine this pattern with other indicators like RSI or MACD to increase your chances of a successful trade!
Want to learn more trading strategies? Download this guide: drive.google.com/file/d/1OLz…
#tradingtips #candlestickpatterns #shootingstar #forextrading #binaryoptions #marketanalysis #financialmarkets #tradingstrategies #priceaction #technicalanalysis #stocktrading
41
Jun 7
Is IQ Option a better trading platform compared to others such as Olymp Trade and Binomo? Why or why not?
IQ Option, Olymp Trade, and Binomo are all reputable trading platforms, but IQ Option often stands out due to its robust features, comprehensive tools, and global recognition. IQ Option offers a wide range of financial instruments, including binary options, CFDs, forex, and cryptocurrencies, paired with a highly intuitive user interface and advanced charting tools, which appeal to both beginners and experienced traders. Its competitive payouts and extensive educational resources further enhance its appeal.
In contrast, Olymp Trade is known for its straightforward approach, lower minimum deposits, and beginner-friendly platform, while Binomo offers a simple trading experience but may lack the depth and tools provided by IQ Option. Each platform has its strengths, but IQ Option generally provides a more comprehensive trading environment, making it a preferred choice for those seeking versatility and advanced features.
Want to read detailed reviews of all these brokers? Visit my Website
feeds.feedburner.com/BOBroke… download my comprehensive broker selection guide to make an informed choice based on your trading style, goals, and the credibility of these platforms:
dropbox.com/scl/fi/wdvxj6tl3…
48
Jun 7
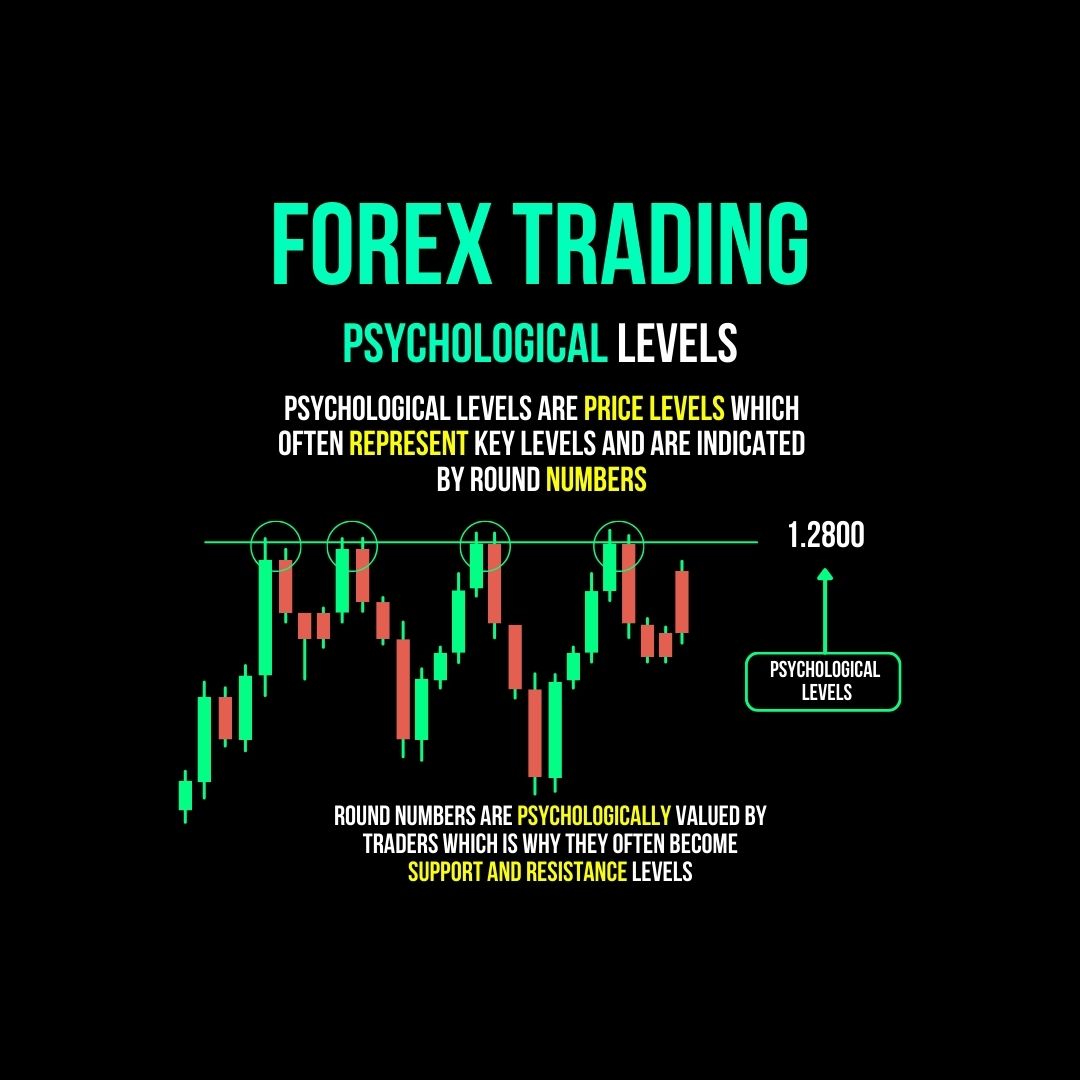
In forex trading, psychological levels are key price points that often influence market behavior. These levels are typically round numbers like 1.2800, 1.3000, or 1.5000, and they hold significant meaning for traders. The reason behind their importance is rooted in human psychology; round numbers are easier for traders to remember and tend to serve as natural support or resistance levels.
For example, if EUR/USD is approaching the 1.2800 level, traders may see it as a psychological barrier. The market often reacts around these levels, as they represent points where traders expect price action to either bounce or break through.
When EUR/USD approaches 1.2800, many traders may view this as a critical level, setting buy or sell orders around it. If the price breaks through this level, it could signal the start of a new trend, while if it holds as resistance or support, it may cause the market to reverse. This happens because many traders place stop-loss orders or entry orders around these psychological levels, which can trigger chain reactions in the market. Essentially, the 1.2800 level becomes a self-fulfilling prophecy as it draws in attention, making it a key point to watch in your trading strategy.
Traders often look for confirmation signals when price approaches these psychological levels, combining technical analysis with price action to decide whether to enter or exit trades. Whether you’re trading short-term or looking for longer-term moves, understanding these psychological levels can help you make more informed decisions in your trades.
Learned something new? Follow me for more: facebook.com/BinaryOptionsSt…
#ForexTrading #PsychologicalLevels #PriceAction #TradingTips
30
Jun 7
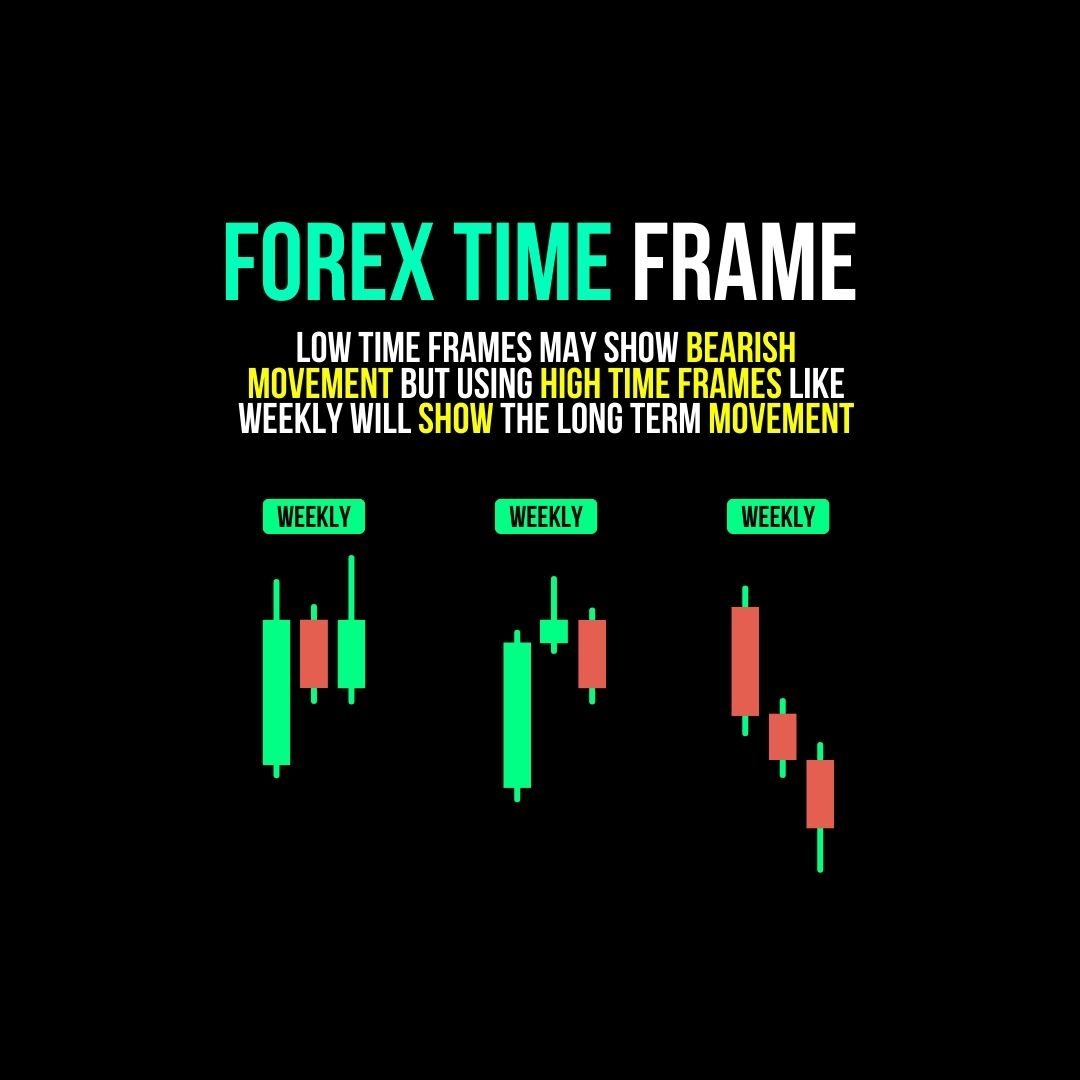
Forex and binary trading often require analyzing time frames to make informed decisions. Understanding how low time frames (e.g., 1-15 minutes) and high time frames (e.g., daily, weekly) reveal trends is key to identifying bullish (upward) or bearish (downward) momentum. Let’s break it down:
Low Time Frames (1m, 5m, 15m)
These are best for scalping and short-term binary trades. Key Characteristics are:
1. Show rapid price movements and short-lived trends.
2. Traders often see false signals (temporary breakouts) due to noise.
For example, a bearish trend on a 5-minute chart might reverse quickly, showing bullish momentum after a news event.
Tip: Use indicators like Moving Averages or RSI to confirm trends before taking positions.
High Time Frames (Daily, Weekly)
These are best for Swing trading or identifying long-term trends in forex. Key Characteristics are:
1. Show clearer, more reliable trends.
2. Ideal for spotting market sentiment: Are buyers (bulls) or sellers (bears) in control?
A bullish trend on the daily chart often signals sustained upward momentum despite short-term fluctuations.
Example: If EUR/USD shows an uptrend on the weekly chart but a pullback on the 15-minute chart, the broader trend remains bullish unless confirmed otherwise.
Want more tips on mastering forex and binary options trading? Join my course now: whop.com/trading-titan-tradi…
#ForexTrading #BinaryOptions #TradingTips
50
Binary Options Pro retweeted
Jun 4
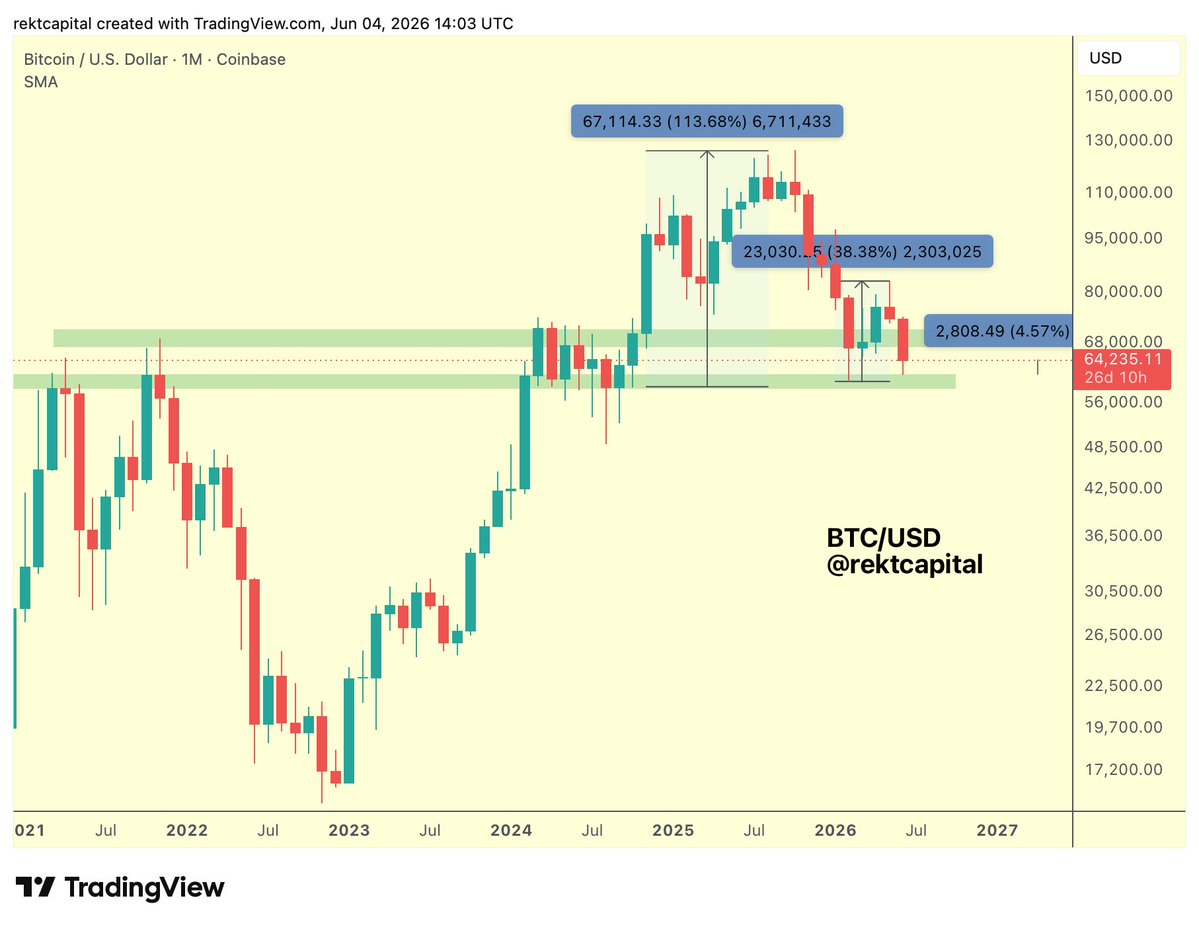
#BTC
What are we really looking for at this stage for Bitcoin?
Weakening higher timeframe supports
Rallies have been getting progressively weaker from the ~$60,000 region (lower green)
The mid-2024 rally saw price go up 113% from here
But the February 2026 move generated only 38%
This current bounce is 4% thus far but it's very likely that the rebound from here will be even weaker
And this is how the ~$60,000 area will be completely lost as support over time
$BTC #Crypto #Bitcoin
22
28
276
18,113
Jun 4
What is the difference among Hedging, Trading, and Investing: Explained with Stocks, Futures, and Options
Hedging
Hedging is a strategy to reduce risk by taking an opposite position in a related asset. Think of it as financial insurance! For instance, if you own stocks in a company but fear a market downturn, you might buy a put option (the right to sell at a set price) on the same stock. This way, if the stock price falls, your losses are offset by gains from the option.
Trading
Trading is all about short-term buying and selling to profit from market fluctuations. Unlike hedging, it seeks gains rather than risk reduction. For example, a trader might use options to speculate on a stock's price increase, buying call options (the right to buy at a set price) if they expect a rise. Futures contracts are also popular for traders aiming to profit from price movements in commodities like gold or indices like the S&P 500.
Investing
Investing focuses on long-term growth and wealth building. This involves buying assets like stocks and holding them for years, betting on the company’s sustained success. For example, you might invest in Tesla stocks, believing its innovations will drive future profits. Options can also be used to generate income, like selling covered calls on stocks you own.
🔑 Key Differences:
Hedging: Protects against losses (e.g., buying a put option on your stocks).
Trading: Profits from short-term market moves (e.g., day trading futures or options).
Investing: Builds wealth over time (e.g., buying stocks for long-term growth).
Follow for more insights on trading, hedging, and investing!
feeds.feedburner.com/BOBroke…
#hedging #trading #investing #options #stocks #crypto #assets #binarytrading
69
Jun 3
Market conditions and timing are critical factors when using the short straddle strategy because its performance depends heavily on stability and predictable price movement. This strategy is designed to benefit when the underlying asset remains within a narrow range and does not experience sudden volatility spikes.
The most favorable market condition for a short straddle is low volatility with a sideways trend. In such environments, option premiums gradually decline due to time decay, allowing the seller to potentially profit. However, even in calm markets, unexpected news events or economic data releases can quickly change price behavior and increase risk.
Trade timing also plays an important role in strategy effectiveness. Many traders prefer entering positions during periods when implied volatility is relatively high, as this allows them to collect higher premiums. As time progresses and expiration approaches, theta decay accelerates, which can further support the position if price remains stable.
Avoiding major events such as earnings announcements, policy decisions, or high-impact economic reports is often considered essential when deploying short straddles. These events can trigger sharp movements that may lead to significant losses, even if the position was initially well-structured.
Successful execution depends on combining favorable market conditions with disciplined timing. Without these factors aligned, the strategy can quickly shift from income-generating to high-risk exposure.
#ShortStraddle #OptionsTrading #MarketConditions #TradingEducation #RiskManagement
24
Jun 2
Theta decay plays a central role in the short straddle strategy because it represents the gradual loss of option value as time passes. In a short straddle, a trader sells both a call and a put, and profits when the total premium of these options decreases over time.
As expiration approaches, theta decay accelerates, especially in the final weeks. This works in favor of the seller because both options lose value each day, assuming the underlying price stays within a stable range. The ideal scenario for a short straddle is low volatility combined with steady time decay.
However, theta decay does not eliminate risk. If the underlying asset moves sharply in either direction, the loss from price movement can outweigh the benefit of time decay. This is why managing volatility exposure is just as important as understanding theta itself.
Traders often monitor theta alongside implied volatility to evaluate whether the premium received justifies the risk taken. When used carefully, theta decay can become a consistent source of edge in range-bound markets.
#ThetaDecay #OptionsTrading #TradingEducation #StockMarket #OptionsStrategy
25