
1,525 Photos and videos


Mr. NIO retweeted

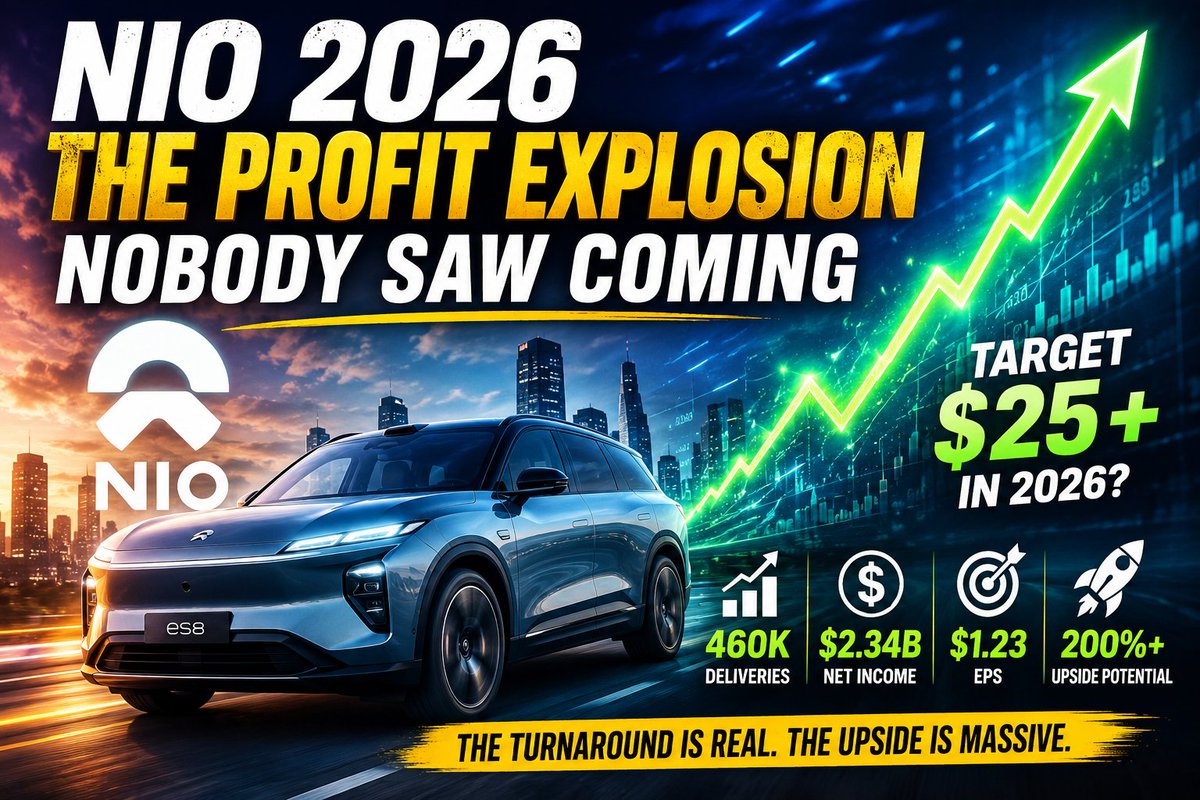
𝗡𝗜𝗢 𝟮𝟬𝟮𝟲: 𝗪𝗵𝘆 𝗔 $𝟮𝟱 𝗦𝗵𝗮𝗿𝗲 𝗣𝗿𝗶𝗰𝗲 𝗠𝗮𝘆 𝗕𝗲 𝗝𝘂𝘀𝘁 𝘁𝗵𝗲 𝗕𝗲𝗴𝗶𝗻𝗻𝗶𝗻𝗴
For years, critics argued that NIO would never become profitable. They pointed to heavy investments, aggressive expansion, and a fiercely competitive EV market as reasons the company would struggle to generate meaningful earnings.
Yet 2026 is shaping up to be the year that narrative changes.
Based on realistic delivery, pricing, and margin assumptions, NIO could be approaching an earnings inflection point that few investors fully appreciate today.
𝗧𝗵𝗲 𝗗𝗲𝗹𝗶𝘃𝗲𝗿𝘆 𝗠𝗶𝘅 𝗧𝗵𝗮𝘁 𝗖𝗵𝗮𝗻𝗴𝗲𝘀 𝗘𝘃𝗲𝗿𝘆𝘁𝗵𝗶𝗻𝗴
The key is selling more of the right vehicles.
Under this scenario, NIO delivers approximately 460,000 vehicles in 2026, with a growing contribution from its highest-margin premium models.
Premium ES8 and ES9• 270,000 deliveries• Average selling price: approximately $62,000• Vehicle margin: 20%
Other NIO Models• 110,000 deliveries• Average selling price: approximately $48,000• Vehicle margin: 18%
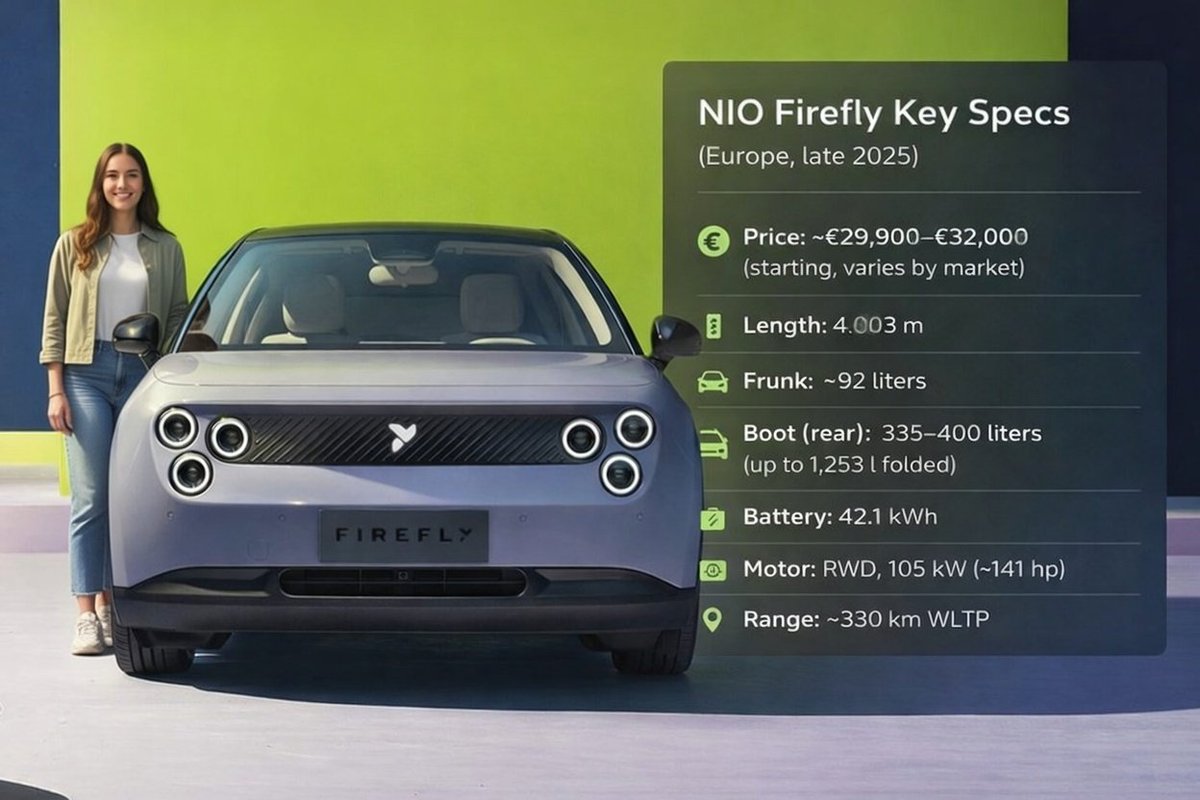
ONVO and Firefly• 80,000 deliveries• Average selling price: approximately $21,000• Vehicle margin: 18%
While ES8 and ES9 account for roughly 59% of total deliveries, they generate a significantly larger percentage of total gross profit. This is where operating leverage begins to accelerate.
𝗧𝗵𝗲 𝗡𝘂𝗺𝗯𝗲𝗿𝘀 𝗕𝗲𝗵𝗶𝗻𝗱 𝘁𝗵𝗲 𝗣𝗿𝗼𝗳𝗶𝘁 𝗦𝘁𝗼𝗿𝘆
Using the assumptions above:
Vehicle Gross Profit
• ES8 and ES9: approximately $3.35 billion• Other NIO models: approximately $0.95 billion• ONVO and Firefly: approximately $0.30 billion
Total Vehicle Gross Profit: approximately $4.60 billion
NIO's ecosystem contributes additional high-margin revenue streams through:
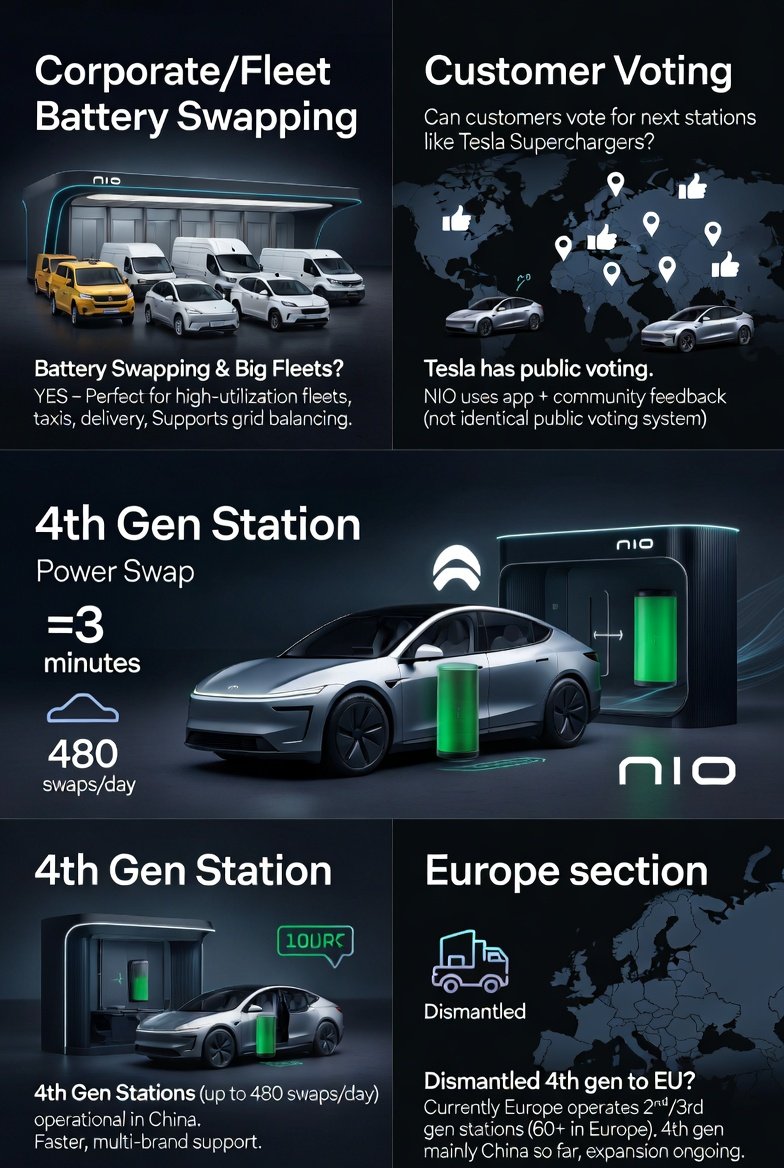
• Battery-as-a-Service subscriptions• Software services• NIO Pilot and autonomous-driving features• Charging and energy services
Assumed contribution: $1.15 billion
Total Gross Profit: approximately $5.75 billion
𝗢𝗽𝗲𝗿𝗮𝘁𝗶𝗻𝗴 𝗟𝗲𝘃𝗲𝗿𝗮𝗴𝗲 𝗙𝗶𝗻𝗮𝗹𝗹𝘆 𝗔𝗿𝗿𝗶𝘃𝗲𝘀
NIO has spent years building factories, battery-swap infrastructure, software platforms, and a multi-brand ecosystem.
As deliveries scale, those fixed costs become increasingly efficient.
Assuming operating expenses average approximately $250 million per month, annual operating expenses would total:
Annual Operating Expenses: approximately $3.0 billion
That produces:
Operating Income: approximately $2.75 billion
After applying a 15% effective tax rate:
Estimated Net Income: approximately $2.34 billion
For a company still growing rapidly, that would represent one of the most significant earnings turnarounds in the global EV industry.
𝗘𝗣𝗦 𝗔𝗻𝗱 𝗪𝗵𝗮𝘁 𝗜𝘁 𝗖𝗼𝘂𝗹𝗱 𝗠𝗲𝗮𝗻 𝗳𝗼𝗿 𝘁𝗵𝗲 𝗦𝘁𝗼𝗰𝗸
Assuming approximately 1.9 billion ADS-equivalent shares outstanding:
Estimated EPS = $2.34 billion ÷ 1.9 billion shares
Estimated EPS: $1.23
Applying different valuation multiples:
15x P/E Multiple• Implied Share Price: $18.45
20x P/E Multiple• Implied Share Price: $24.60
25x P/E Multiple• Implied Share Price: $30.75
Under a reasonable 20x earnings multiple, NIO approaches $25 per share, representing substantial upside from current levels.
𝗪𝗵𝘆 𝗧𝗵𝗶𝘀 𝗦𝗰𝗲𝗻𝗮𝗿𝗶𝗼 𝗜𝘀𝗻'𝘁 𝗙𝗮𝗻𝘁𝗮𝘀𝘆
Several assumptions are intentionally conservative:
• ES8 and ES9 launch margins have previously exceeded 20%, making the margin assumption achievable.• Operating expenses continue trending lower as scale improves.• Battery-swap infrastructure is already largely built, allowing future growth to flow through more efficiently.• ONVO and Firefly expand volume without materially diluting NIO's premium brand positioning.
This scenario does not require perfect execution.
It requires continued execution along trends that are already visible.
Investors should conduct their own research and consider risks before making investment decisions.
15
68
1,558
Mr. NIO retweeted

Jun 14
🔝🤷♂️🚨⁉️
For decades, the answer to “What is the most comfortable car in the world?” was simple:
Rolls-Royce Phantom.
But in 2026, we finally have a serious challenger.
Not from Germany.
Not from Japan.
From China.
The NIO ES9.

5
6
45
1,352
Mr. NIO retweeted

Jun 12
The Chinese car in front, the NIO, costs less than the BMW and Audi, yet delivers far greater value.
For too long legacy automakers sold prestige while offering less value for money.
We choose to be scammed by obsessing over legacy brands.
9
62
203
22,220
Mr. NIO retweeted

Jun 12
>Be Elon
>Get bullied so badly as a kid that you end up in the hospital
>Escape into books
>Read more than 8hrs a day
>Teach yourself programming
>Sell a video game at 12
>Leave South Africa
>Sleep on couches
>Work odd jobs
>Get into America
>Build a startup
>Get fired from your own company
>Start over
>Build another company
>Merge it into PayPal
>Get removed as CEO
>Your company gets acquired
>Walk away with nearly $180 million
>Instead of retiring at 31, put almost all of it into three impossible ideas: Electric cars, Solar energy, Rockets
>People tell you you're insane
>Start a rocket company with no aerospace degree
>Learn rocket science from textbooks
>First rocket fails
>Second rocket fails
>Third rocket fails
>Divorce
>Public humiliation
>Cash running out
>One launch away from bankruptcy
>Launch anyway
>The fourth rocket reaches orbit
>NASA signs a contract
>Survive
>Tesla is weeks from collapse
>Save it at the last minute
>Get mocked for wanting reusable rockets.
>Land one.
>Then another.
>Then dozens.
>Turn science fiction into engineering
>Get mocked for betting on EVs
>Turn electric cars into status symbols
>Force the entire auto industry to follow
>Build the most valuable car company in history
>Launch astronauts into orbit
>Create a global satellite internet network.
>Buy Twitter
>Fire most of the staff
>Rename it X
>Walk into politics
>Risk your reputation
>Risk your companies
>Risk your fortune
>Become one of the most polarising people on Earth.
>Get attacked by the media, politicians, competitors, and activists
>Keep building anyway
>Become a TRILLIONAIRE

1,123
4,464
24,306
1,540,485

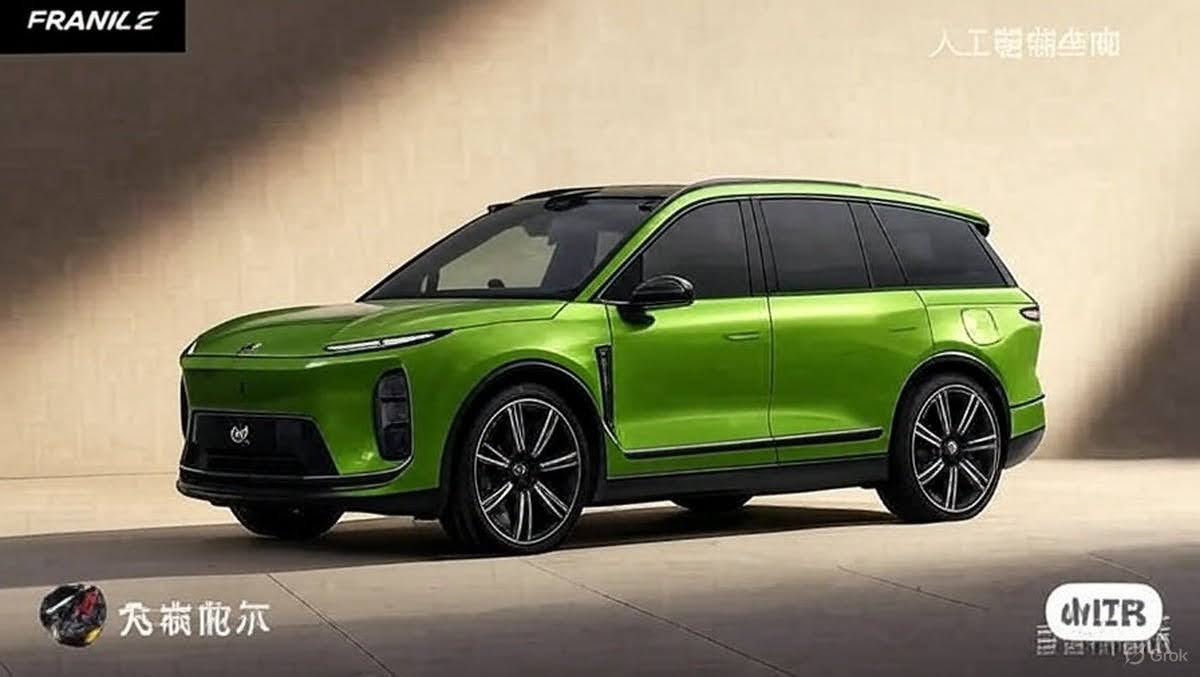
Nio highlights engineering challenges of making lighter EVs as Chinese cars face obesity crisis
Making EV models lighter requires courage, Nio founder William Li said. cnev.co/7nCpRSV 👇
1
13
96
3,353
Mr. NIO retweeted

Jun 12
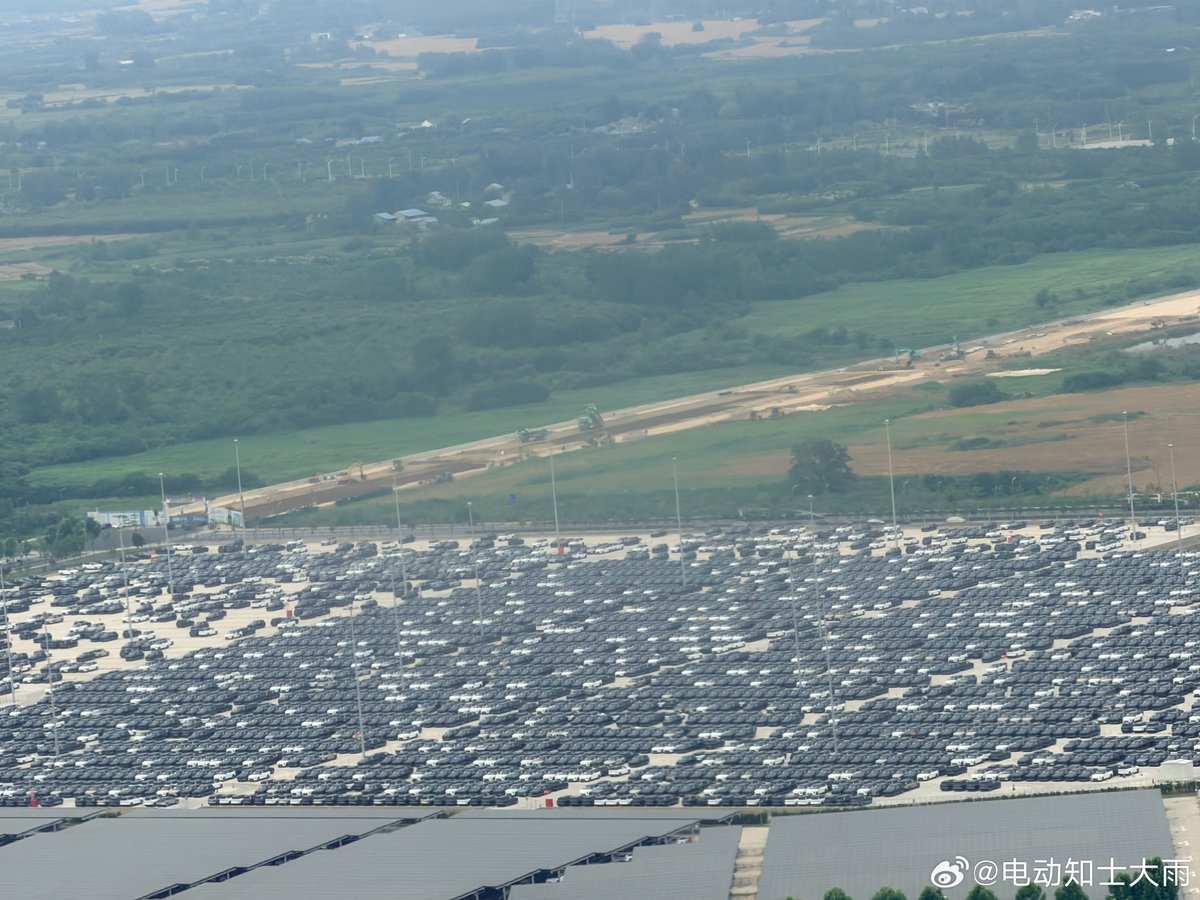
The parking lot of the NIO F2 factory is packed with ES8 and ES9 vehicles that have just rolled off the production line; the production capacity is at its maximum!
$NIO
2
29
211
14,587
Mr. NIO retweeted

Jun 12
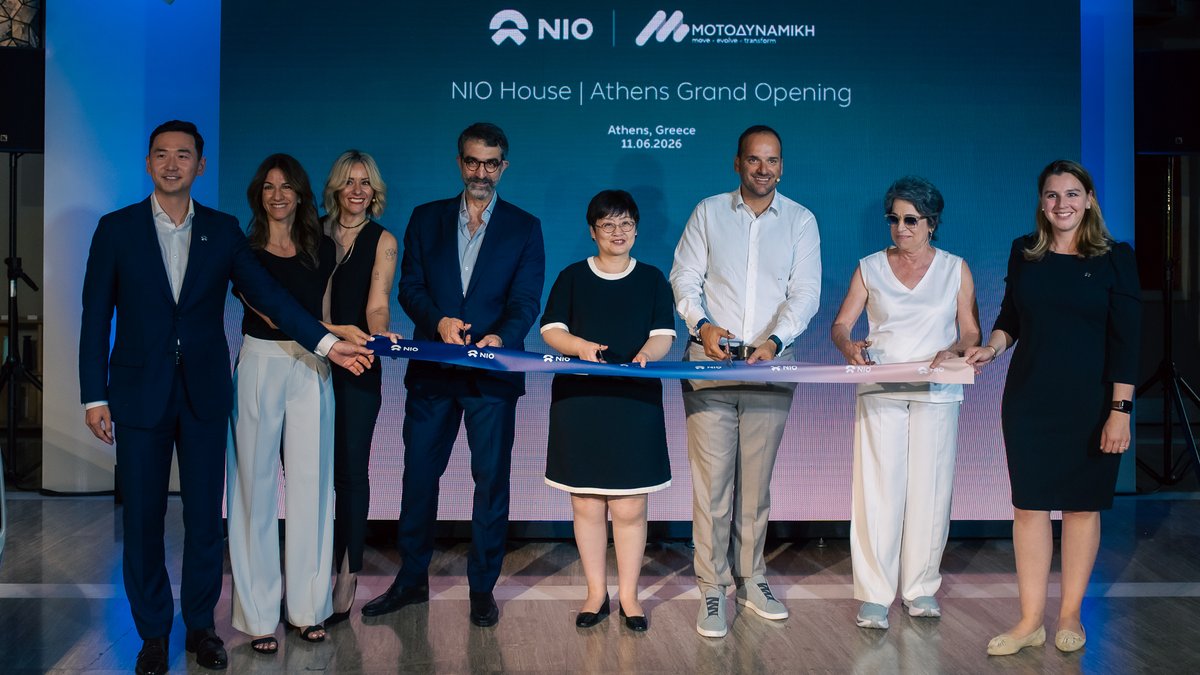
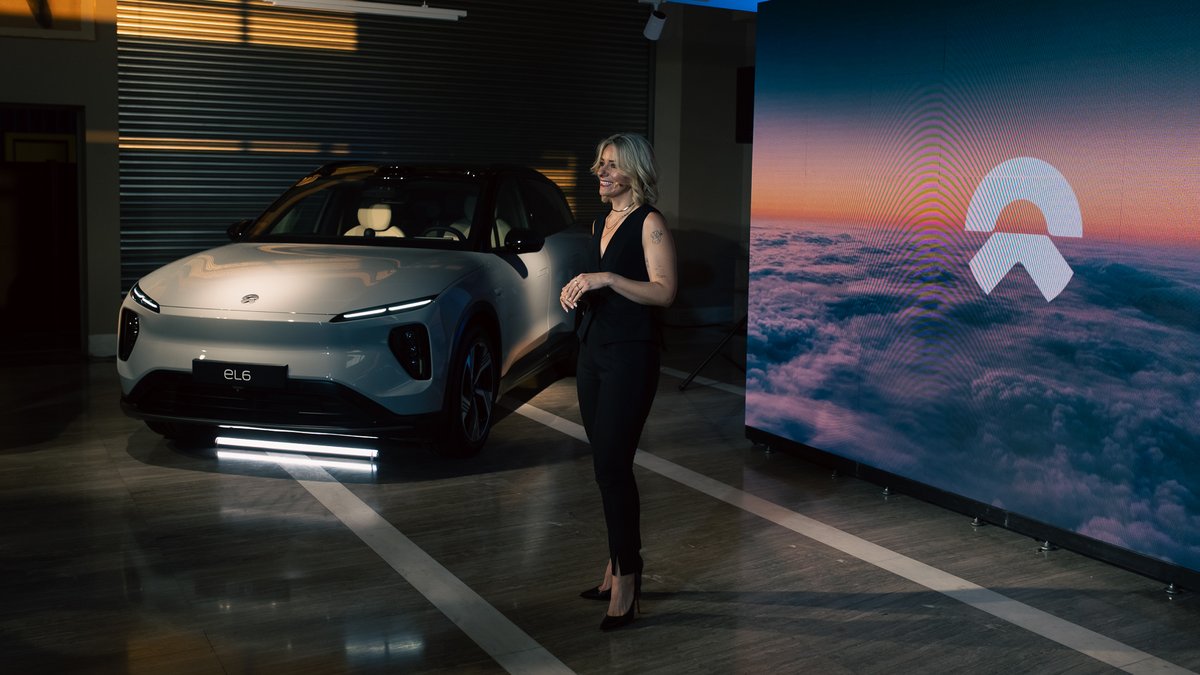
Thrilled to share a new milestone in our global expansion: yesterday, together with our partner Motodynamics Group, we opened the first NIO House in Greece.
Located at the culturally significant Athens 14 in Kifissia, NIO House | Athens is now open to everyone. Visitors can explore the NIO and firefly brands, discover our vehicles, and take a test drive.
We'll keep working with local partners to strengthen our global presence.
Let's Power Up! Let's Jiadian!⚡
#NIO #NIOHouse #firefly #BlueSkyComing


25
40
288
8,669

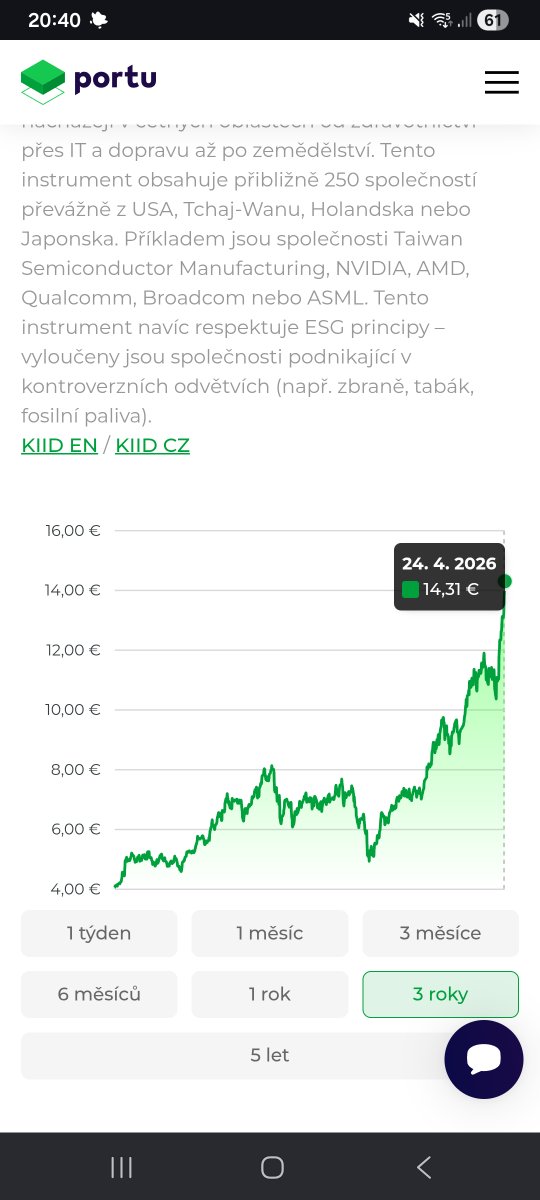
V roce 2026 nakoupit BTC okolo 45 000$ nebo #CSG okolo 300 CZK co do roku 2030 udělá větší ROI. Nebo máte jiné tipy co je a bude ve slevě a udělá ideálně za 4 roky násobek vkladu? #investice #doporuceni #akcie
2
53
Mr. NIO retweeted
Jun 11
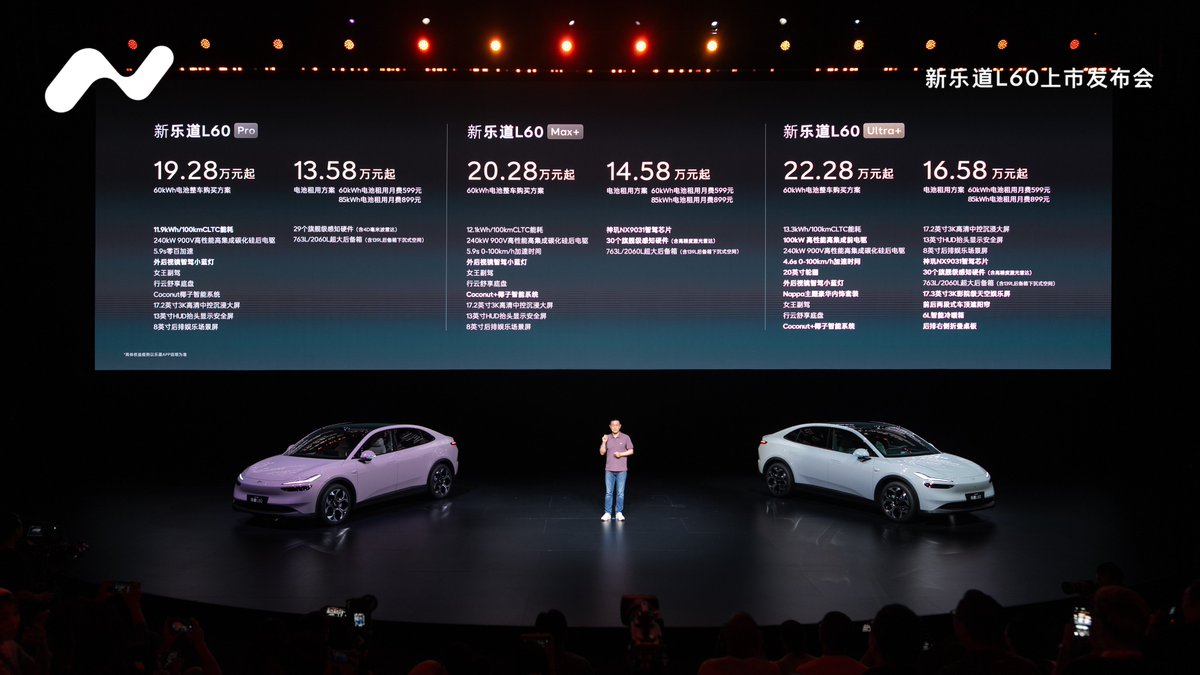
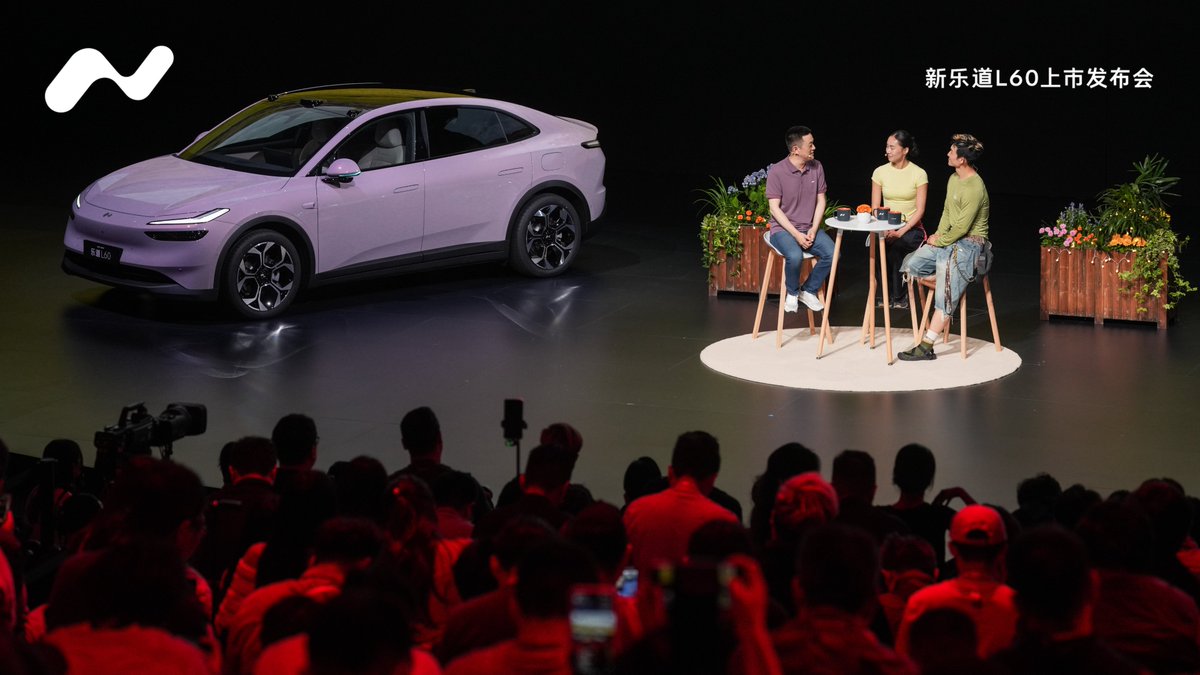
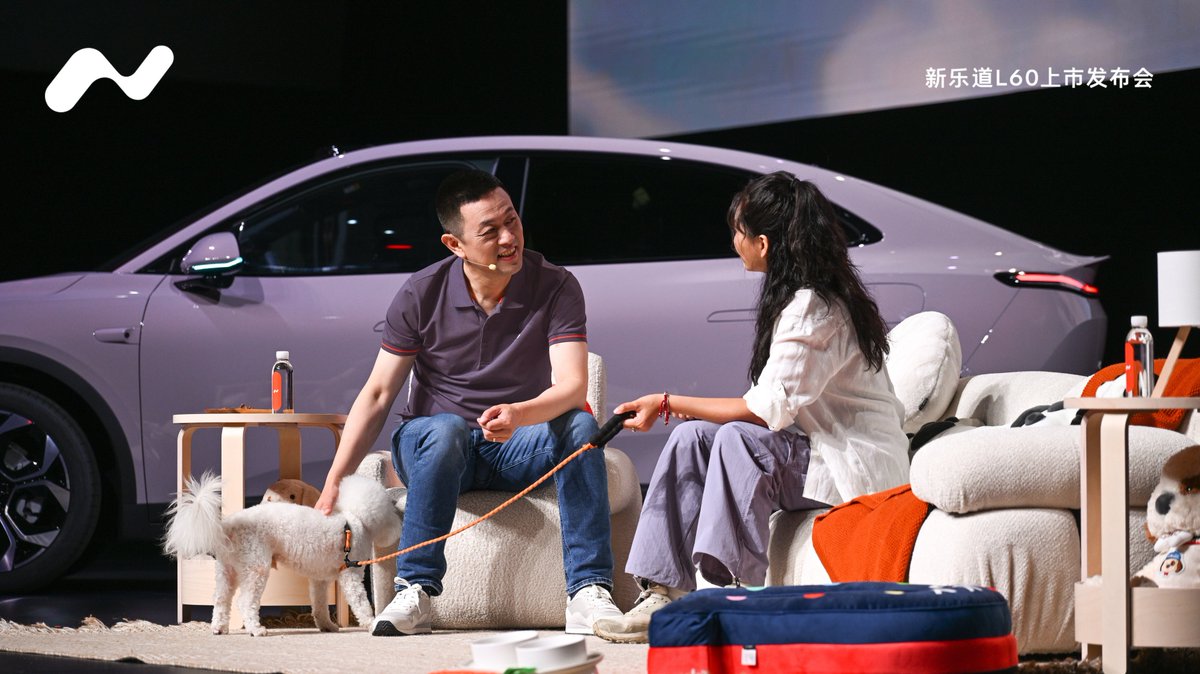
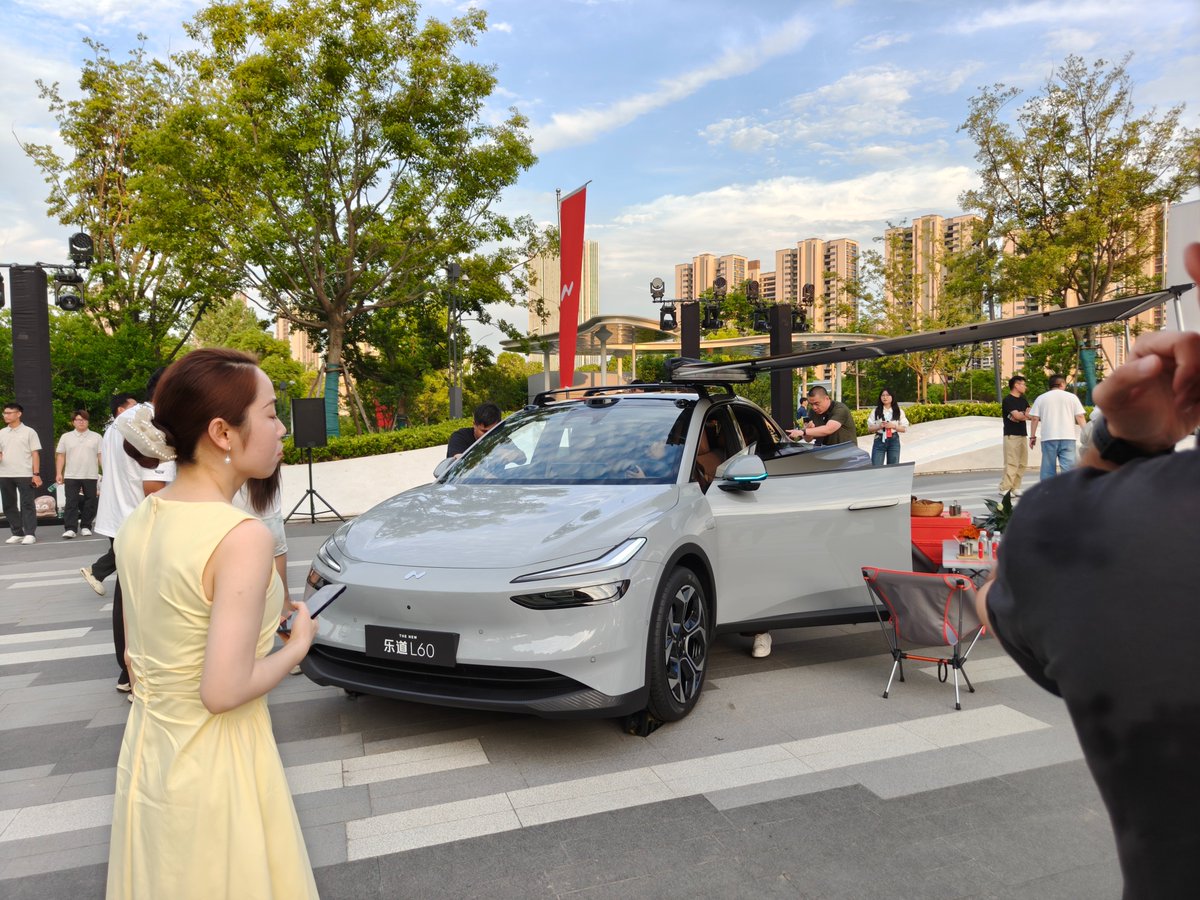
The New ONVO L60 officially launched tonight. Our mid-size SUV tech flagship just got even better.
Starting at RMB 192,800 for full purchase, and RMB 135,800 with Battery as a Service (BaaS) option.
Let's Power Up! Let's Jiadian!⚡
#NIO #ONVO #ONVOL60 #BlueSkyComing
6
38
272
5,767

Mr. NIO retweeted
Jun 11
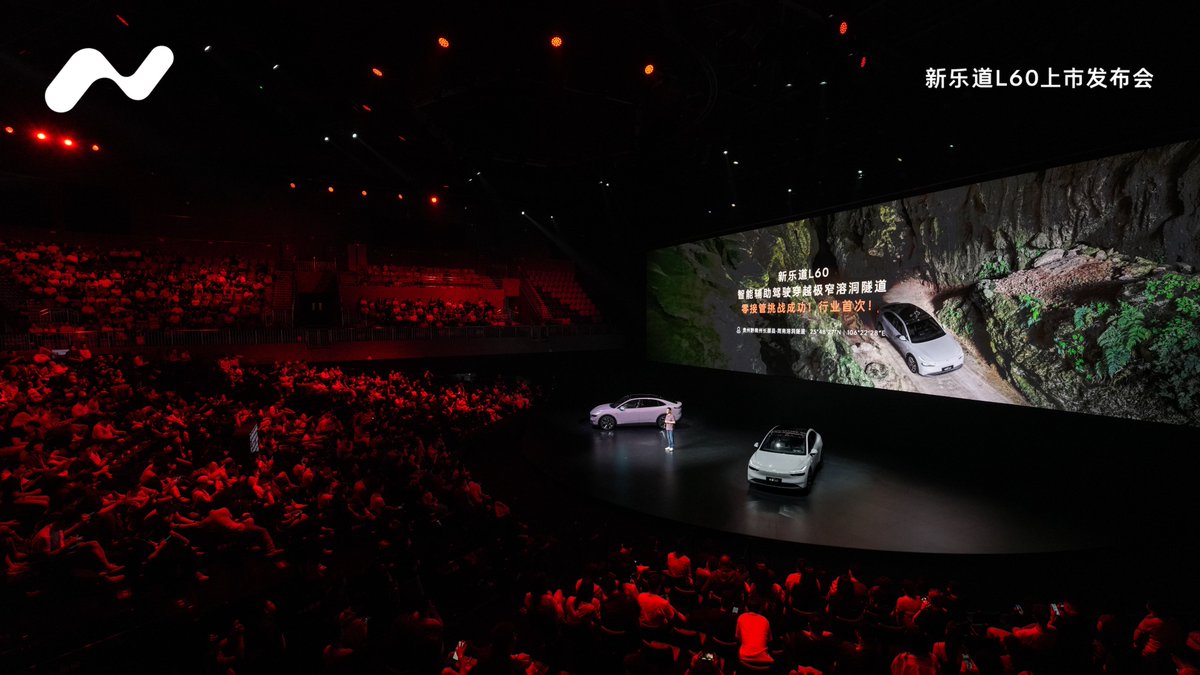
Proud to share that the New ONVO L60 successfully made it through Guizhou Jiannan Road, an extremely narrow natural karst cave tunnel, on its Advanced Driver Assistance System (ADAS) with zero driver takeover.🚗
With the L60's agility and our latest version of NIO WorldModel, we were able to complete this challenge for the first time in the industry.
Huge credit to the team.
Let's Power Up! Let's Jiadian!⚡
#NIO #ONVO #ONVOL60 #BlueSkyComing
32
87
409
15,189
Mr. NIO retweeted

Jun 11
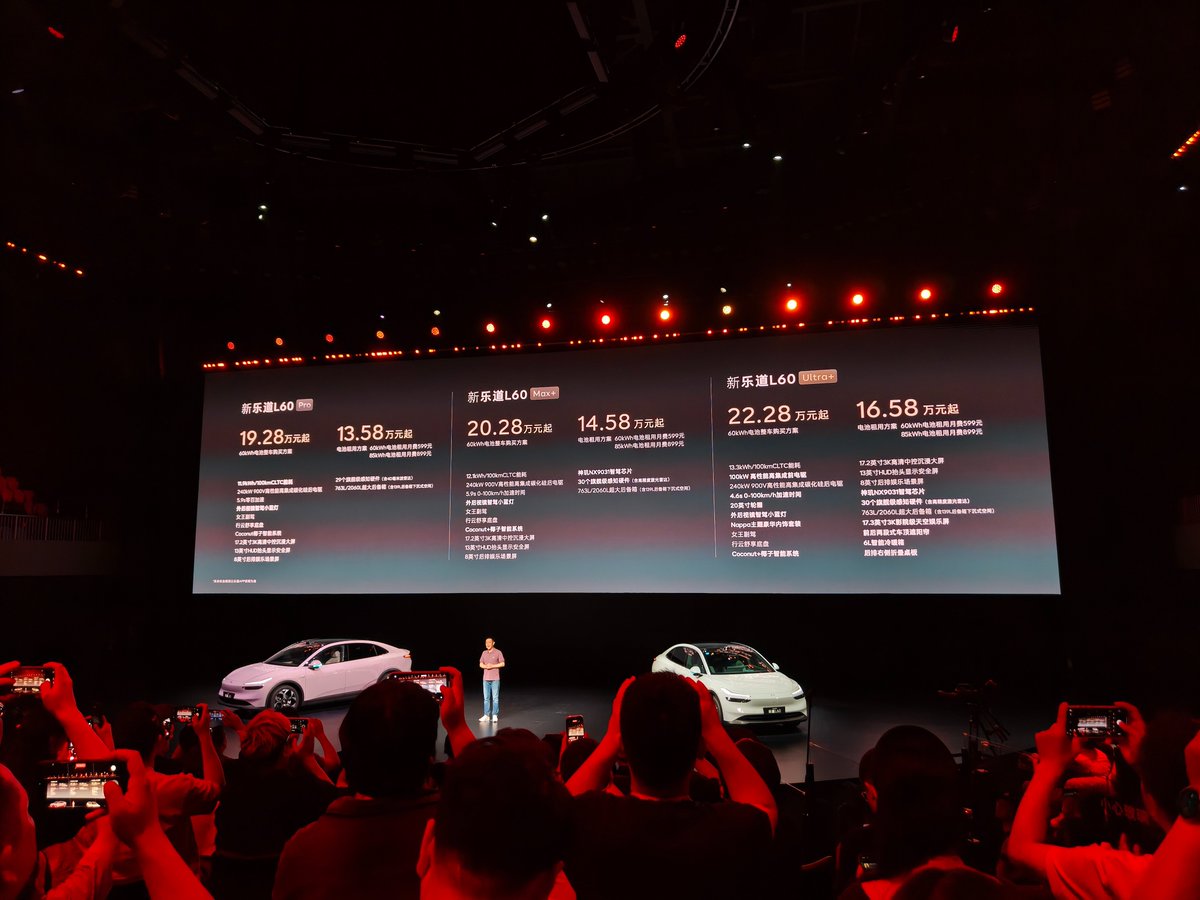
The all-new ONVO L60 is officially launched, with a starting price of 192,800–222,800 RMB ($26,990–$31,200). The battery rental scheme starts at 135,800–165,800 RMB ($19,010–$23,210).
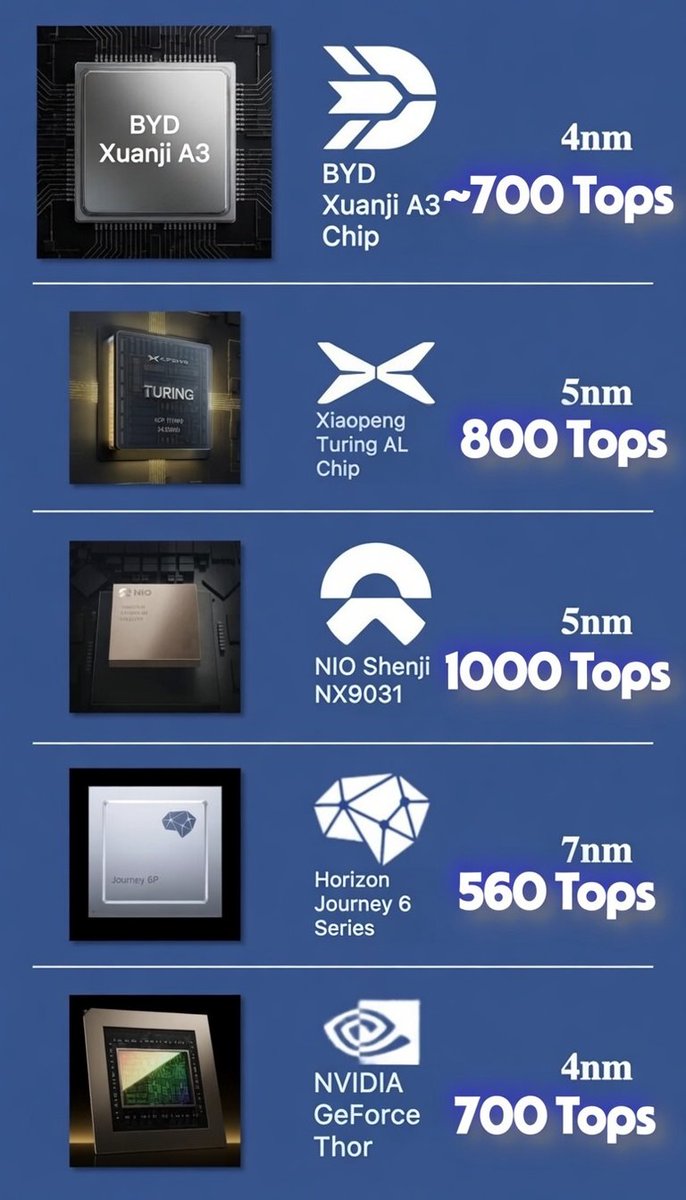
The new car features 106 upgrades across six dimensions, powered by the Shenji NX9031 chip and NIO World Model NWM. Its Navigate on Autopilot now supports tidal lane and variable lane detection.
The interior has been upgraded with improved materials, dual rear screens and dual in-car refrigerators. The small blue AD indicator light on the side mirrors will open for upgrade in July, while the chassis setup has also been optimized. A major update for the Coconut intelligent system will be officially rolled out to all users in July.
Deliveries of the new ONVO L60 will start tomorrow. $NIO #ChinaEV #ONVO


2
19
100
2,909
Mr. NIO retweeted

NIO has surpassed XIAOMI, XPEV, LI and Zeekr in May, now NIO will outsell TSLA and HUAWEI in June or July at latest👀
3
8
80
3,880
Mr. NIO retweeted
Jun 11
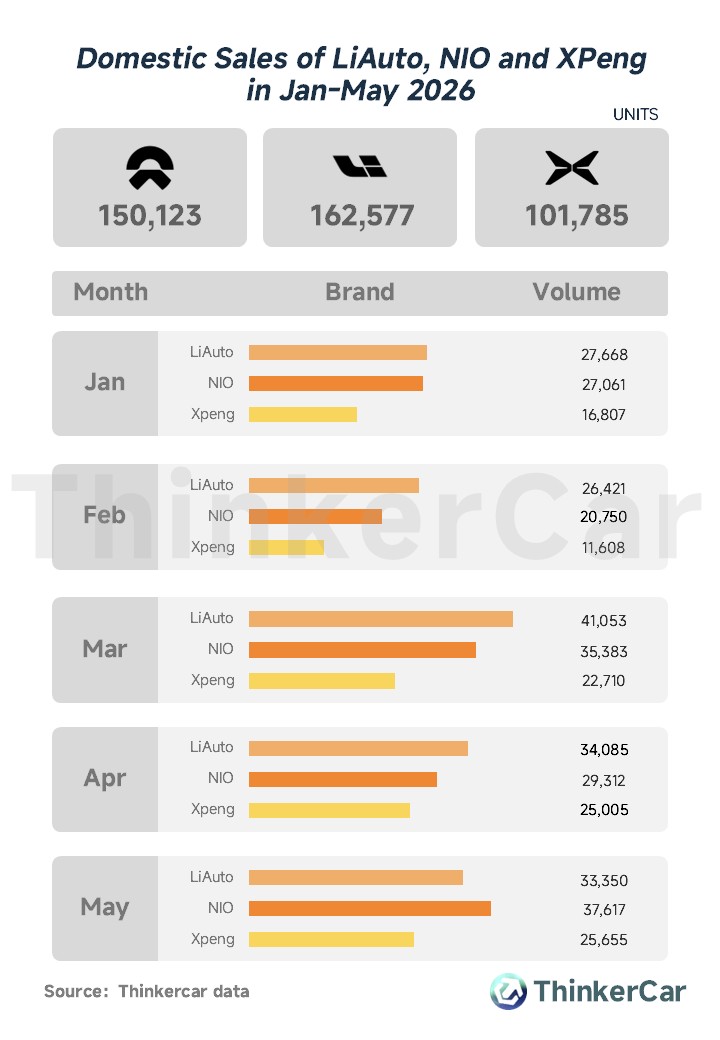
Nio’s May sales breakdown is out.
The ES8 led the volume, followed by the newly launched ONVO L80, the refreshed L90, and the ES9, which has been delivering for just three days.
Larger, higher-margin models accounted for most of Nio's sales this month. $NIO #ChinaEV #CNEVdata

2
20
107
7,802
Nio Onvo to hold launch event on June 11 evening for new L60 with 106 upgrades
Onvo announced that the launch event for the new L60 will begin at 7:30 pm Beijing Time on June 11, saying the model brings a total of 106 upgrades. cnev.co/GWPjoYs 👇
2
14
111
6,673


Mr. NIO retweeted

$NIO Deutsche Bank raised its 2026 delivery forecast to 450,000 vehicles, increased its ES9 estimate to 56,000 units, and lifted its price target to HK$86(~$11 USD). WOWZAR, still not selling until 10x lol
8
23
165
6,450
Mr. NIO retweeted

Jun 8
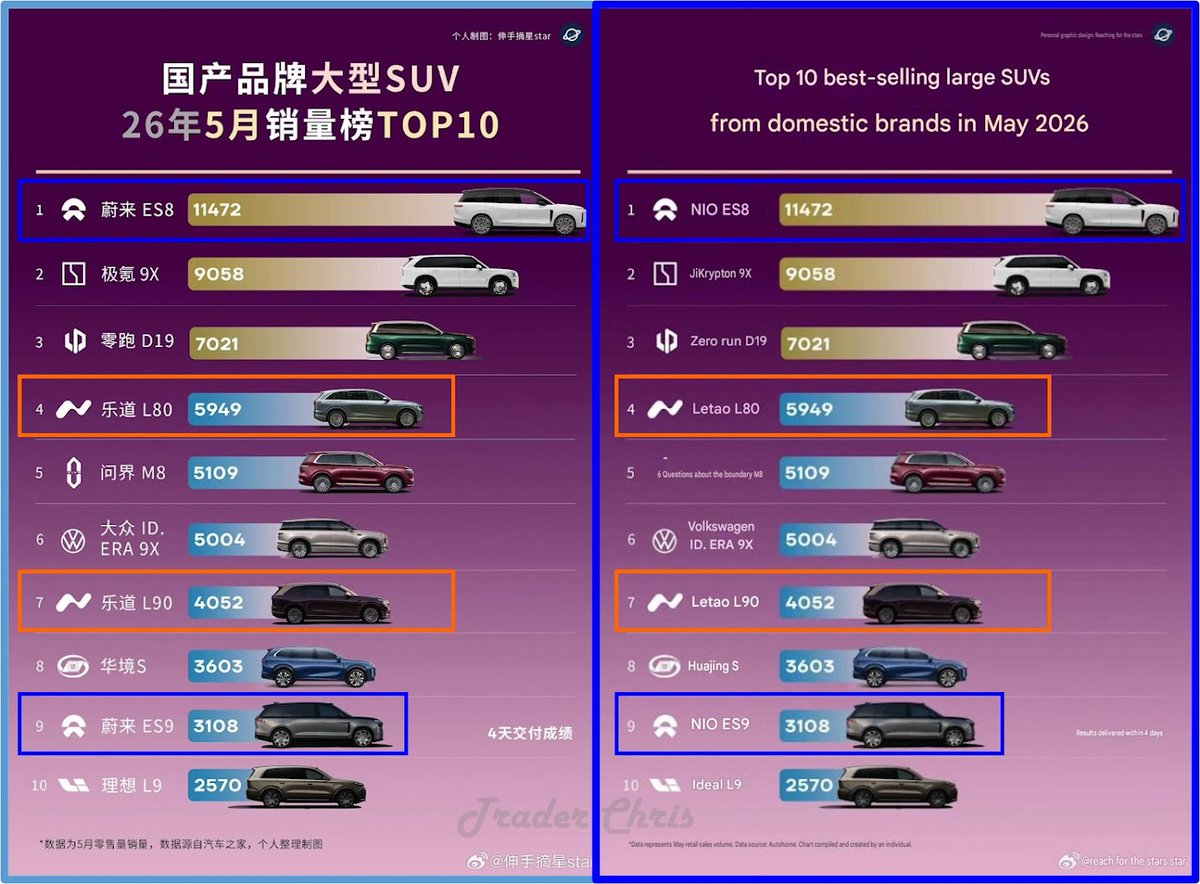
Top-10 best selling large SUV's in Chinese brands for May-2026
$Nio ES8 at #1 is expected. But surprisingly the Onvo L80 landed in 4th place & L90 in 7th.
Another surprise is that the #Nio ES9, in 4 days of delivery, landed in 9th place with 3,109 deliveries!
@NIOGlobal
7
27
5,337
Mr. NIO retweeted
Jun 9
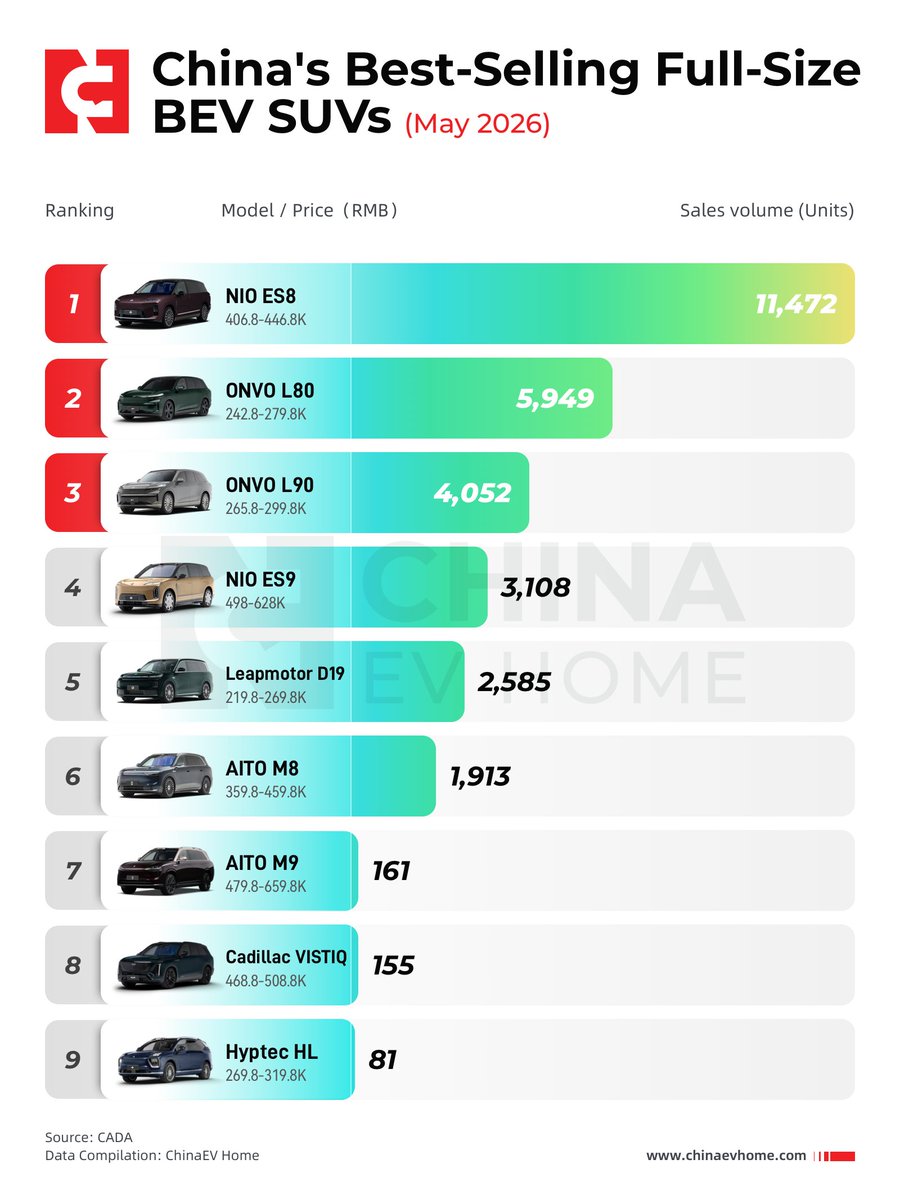
If you look strictly at the BEV full-size SUV segment, NIO Group sweeps the top four positions with an overwhelming lead.
Sticking to the pure electric path is undeniably tough, but solid delivery numbers speak way louder than any internet drama. $NIO #ChinaEV
Jun 9

May full-size SUV sales are in, and the NIO ES8 has locked down the top spot for the sixth consecutive month.
Just as I said, Leapmotor’s D19 has massive potential—and it just broke into the top three this time.
On top of that, NIO’s new product rollout speed has been crazy fast—the ES9 hit 3.1K (3,108) units just three days into delivery, while the ONVO L80 crossed nearly 6K (5,949) units within 15 days.
$NIO #ChinaEV #Leapmotor

3
14
68
5,235