
Diary for speculative market analysis and frequent political musings.
Joined January 2021
- Tweets 10,096
- Following 146
- Followers 1,653
- Likes 10,547
1,521 Photos and videos


Pinned Tweet

Mar 14
The name of a killed service member covered up by a Dow Jones index ticker is a pretty grim metaphor for how America often operates.

102
4,280
30,623
429,999
Frothy Assets retweeted

By the way all of the censorship/surveillance that is happening in the UK, Australia, Canada, Europe etc., eventually comes for the US. Other countries are testnets for ideologies/systems that get merged into the US once they're proven effective. The US is the last bastion of freedom. You have to be vocal, vote against surveillance, call your politicians, etc., if you don't do anything the US too will fall. The US isn't immune from this. You have to remain vigilant and resist the pushes.
70
232
1,661
33,619
Frothy Assets retweeted

NEW DYSTOPIA ACHIEVEMENT UNLOCKED
Jun 14

🚨 NEW: Under-16s in the UK will be banned from the following 10 social media apps
TikTok
YouTube
Snapchat
Instagram
X
Reddit
Facebook
Twitch
Kick
Threads
4
2
25
5,602
Current narrative looks like this, pretty grim. We will never truly know where every dollar ends up.
America, Iran, and gulf states are incentivized to say it is all allocated appropriately.
Embarrassing, midterms will be very blue.
x.com/megatron_ron/status/20…
Jun 14

1
2
330
and btw, Iran will just have Hezbollah and the Houthis do their dirty work for them after a deal is signed (not good for Israel).
Jun 14

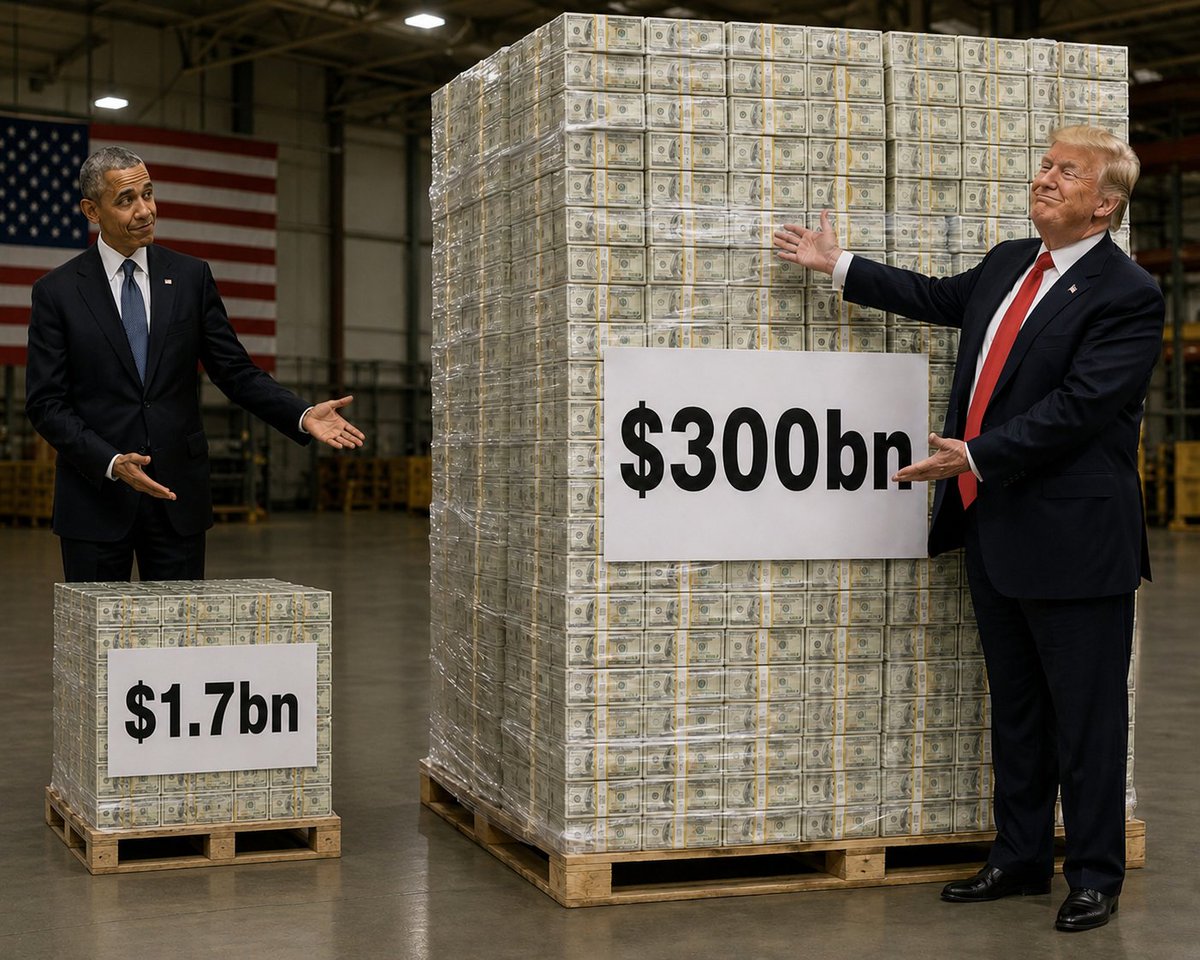
BREAKING: Iran says the US has agreed to pay $300 billion in reconstruction funds directly to Iran as part of the deal Pakistan announced, alongside the release of $24 billion in frozen funds with $12 billion released before negotiations even start, per Mehr News.
This directly contradicts Trump's & Vance's claim that no funds will be transferred to Iran at all.
If Trump denies this is true, there never was a deal. If Trump confirms, the US has fully capitulated to Iran's demands.
2
2
290
Trump wants out, he has given some blame to Netanyahu as of late.
Stupid war, complete embarrassment for Trump. Trump’s foreign policy strategy was writing naked puts with leverage, but he couldn’t steal the blinds this time. He didn’t have the guts to finish Iran off, (he feared an oil spike/stock selloff) so instead we get a lame deal that leaves things about the same as pre-war.
I suspect this deal will be viewed far worse than Obama’s $2 billion “pallets of cash.”
1
126
Frothy Assets retweeted

Jun 15
Trying to imagine the coverage if Obama had spent $60 million to host a pay-per-view NBA event at the White House where LeBron called Melania a hooker.
531
3,127
42,836
1,270,755
Frothy Assets retweeted

Jun 15
the purpose is not to remove young people from the internet. the purpose is to remove anonymity from the internet in a country where the government routinely punishes dissent with jail. the british caliphate is no longer free.
Jun 15

JUST IN: UK Government clarifies adults will still be able to use social media by verifying their identities with digital IDs, facial recognition, passports and credit cards.
695
4,994
26,916
32,726,395
Jun 15
?
Jun 15

🔴 MOC IMBALANCE
S&P 500: -3023.7 MLN
NASDAQ 100: -2155.2 MLN
DOW 30: -1025.0 MLN
MAG 7: -1321.6 MLN $MACRO
1
129
Frothy Assets retweeted

Jun 15

2
1
13
2,418
Jun 14
Since 1950, CPI inflation has been >2% in 65% of the years. Mean inflation at 3.5%
1950: 1.1%
1951: 7.9%
1952: 2.3%
1953: 0.8%
1954: 0.3%
1955: 0.3%
1956: 1.5%
1957: 3.3%
1958: 2.8%
1959: 0.7%
1960: 1.7%
1961: 1.0%
1962: 1.0%
1963: 1.3%
1964: 1.3%
1965: 1.6%
1966: 3.0%
1967: 2.8%
1968: 4.3%
1969: 5.5%
1970: 5.8%
1971: 4.3%
1972: 3.3%
1973: 6.2%
1974: 11.0%
1975: 9.1%
1976: 5.8%
1977: 6.5%
1978: 7.6%
1979: 11.3%
1980: 13.5%
1981: 10.3%
1982: 6.1%
1983: 3.2%
1984: 4.3%
1985: 3.6%
1986: 1.9%
1987: 3.7%
1988: 4.1%
1989: 4.8%
1990: 5.4%
1991: 4.2%
1992: 3.0%
1993: 3.0%
1994: 2.6%
1995: 2.8%
1996: 3.0%
1997: 2.3%
1998: 1.6%
1999: 2.2%
2000: 3.4%
2001: 2.8%
2002: 1.6%
2003: 2.3%
2004: 2.7%
2005: 3.4%
2006: 3.2%
2007: 2.9%
2008: 3.8%
2009: -0.4%
2010: 1.6%
2011: 3.2%
2012: 2.1%
2013: 1.5%
2014: 1.6%
2015: 0.1%
2016: 1.3%
2017: 2.1%
2018: 2.4%
2019: 1.8%
2020: 1.2%
2021: 4.7%
2022: 8.0%
2023: 4.1%
2024: 3.4%
2025: 2.8%
1
3
356
Jun 14
Chat GPT had a weirdly extensive response from this prompt:
“Do we measure inflation more favorably or the same now vs years ago? Has methodology of cpi data collection changed”
CPI methodology has changed a lot since the 1950s–1980s, and those changes generally make measured inflation look lower than it would under older methods — especially in earlier decades comparisons. But it’s not a simple “biased now vs then” story; it’s mostly about better measurement of quality and consumption behavior.
⸻
📊 Has CPI measurement changed?
Yes — significantly. The U.S. CPI is now produced by the U.S. Bureau of Labor Statistics (BLS) using a much more refined framework than mid-20th-century versions.
The modern CPI is not just “price tracking”—it adjusts for:
quality improvements
substitution behavior
new goods and services
changing consumption baskets
⸻
🧠 The biggest methodological changes
1. Substitution bias (CPI vs “cost of living”)
Introduced more formally in the 1990s (chain-weighting improvements)
Assumes consumers substitute toward cheaper goods when prices rise
👉 Effect:
Reduces measured inflation vs older fixed-basket methods
⸻
2. Hedonic quality adjustments (big one)
Used heavily since the 1990s–2000s.
Example:
A computer costs the same as 10 years ago but is far more powerful
CPI adjusts downward for “quality improvement”
👉 Effect:
Reported inflation is lower than raw price change
This is especially important for:
electronics
vehicles
medical tech
housing quality adjustments
⸻
3. New goods bias correction
CPI now adds new products (smartphones, streaming, etc.) faster than before
Older CPI lagged in capturing new cheaper innovations
⸻
4. Geometric weighting (1990s onward)
Replaced older arithmetic weighting in many categories
Reflects real-world consumer behavior better
👉 Effect:
dampens inflation compared to older formulas
⸻
5. Housing measurement refinement (OER)
“Owner’s Equivalent Rent” became dominant measure
Instead of tracking house prices directly
👉 This tends to smooth volatility and often reduces short-term inflation spikes
2
104
Jun 14
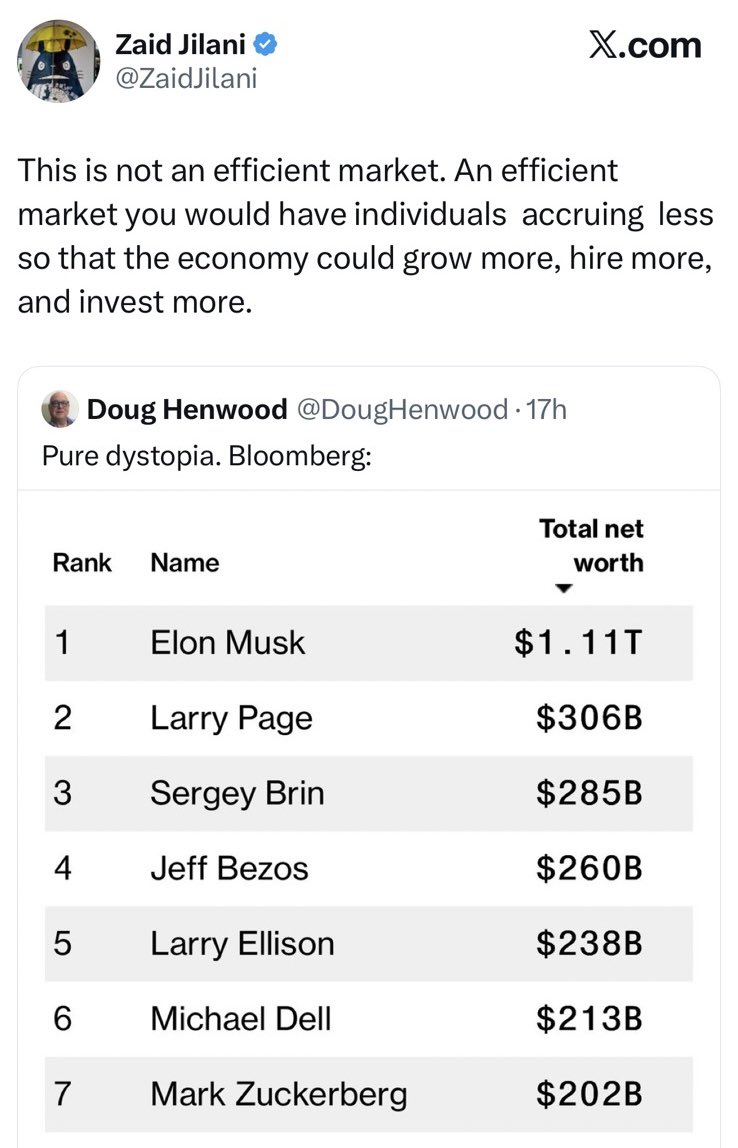
Uh oh, I may become an Elon fan by default because these people are so retarded.
Many leftists are more viscerally enraged by a list of rich (paper-wealthy) people than a list of violent repeat offenders who go on to kill and rape. It is very intriguing.
Many of these business owners have made their lives better and their local economies stronger. Yet instinctively, they have higher regard for a 72 IQ career criminal, who (akin to a feral animal) loves to kill and rape.

1
136
Frothy Assets retweeted

Jun 13
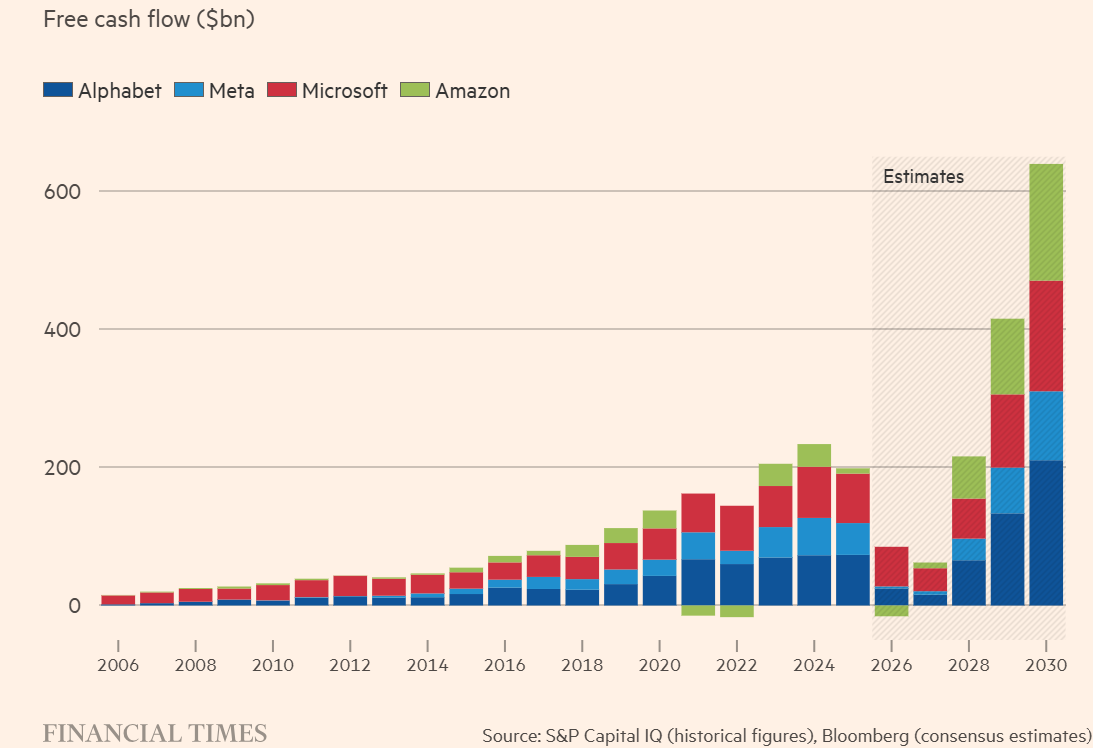
Wall Street consensus estimates for hyperscaler free cash flow. Provides a good snapshot of where the market's head is at, I think:
55
129
870
213,780
Frothy Assets retweeted
Jun 13
Two reads on why analysts see massive FCF leap after 2028. One: they believe that AI will be an all-time great business. Two: they can't get their DCF models to spit out numbers higher than current share prices without putting big numbers into the out years. Some of both?
9
4
100
6,652
Jun 14
$160 million AUM for $CRDU
A 2x long Credo Technology ETF.
A name I’ve barely heard discussed. Crazy impressive how much money/leverage is dumped into everything hot.
2
3
435
Jun 14
Credo Technology has 10,000 watchers on Stocktwits, not many. 63,000 for Atossa Therapitics and 84,000 for Jaguar Health 220,000 for Lucid, 42,000 for Barrick Mining etc. Point is that many obscure names have bigger followings, yet the ETF demand is surprisingly large.
1
159
Jun 14
I have no view on Credo, just very interesting.
An unrelated point: I think shorting dying names with large followings makes for nice counterparties. Seems like retail keeps slowly buying the dip in these dead end companies with a mental anchor to former prices. Stocktwits is pretty lame, but I look there to gauge retail sentiment when something doesn’t make sense.
You will almost never read something insightful there.
Here is what chatGPT estimates for their traffic, I would’ve assumed a sharp 2021 peak but not quite :
130