
Jun 7
**مستويات الدعم (Support) المهمة:**
• 60,000$ ← أقوى دعم نفسي
• 58-59k ← FVG أسبوعي
• 50,000$ ← هدف محتمل
• 39.7k ← سيناريو متطرف
#BitcoinSupport #BTCDip #CryptoSupport #BTCLevels
1
1
17

Jun 7
🎯 $BTC — Full Scenario Map: Downside & Upside Targets
3/4
━━━━━━━━━━━━━━━━━━━━━━
🔴 DOWNSIDE SCENARIOS — HOW LOW CAN IT GO?
This is the question everyone wants answered. And the honest answer is: nobody knows with certainty. But the chart gives us clear structural levels where price historically finds support — and where buyers have historically stepped in with conviction.
If the monthly trendline fails to hold on a closing basis (which has never happened, but remains a non-zero probability), the cascading support levels are:
📍 $31,441 — The 2021 mid-cycle low
This was the level Bitcoin crashed to during the May 2021 China mining ban panic. It represents a 71% drawdown from ATH. At this level, institutional accumulation would likely be extreme.
📍 $24,915 — The 2022 bear market bottom
This is where the last full bear market ended. The level that held after the FTX collapse, the Luna crash, and peak macro fear. A retest here would represent a ~77% drawdown — consistent with prior cycles. This is the last line of major structural demand before territory that would concern even the longest-term holders.
📍 $18,758 — The 2017 bull market all-time high
This level is the most historically significant. In 2020, it acted as resistance. When broken, it became support — a textbook example of resistance-turned-support on the macro scale. A visit here would represent ~83% drawdown from ATH and would almost certainly shake out the majority of leveraged and weak-handed participants entirely.
Important probabilistic note: The deeper the level, the lower the statistical probability of reaching it — based on historical precedent. But also: the deeper the capitulation, the higher the asymmetric return potential for those with the conviction and the cash to act.
Risk management matters infinitely more here than being "right" about direction. Position sizing is everything.
━━━━━━━━━━━━━━━━━━━━━━
🟢 UPSIDE SCENARIOS — IF HISTORY RHYMES
Bitcoin's logarithmic growth curve has been remarkably consistent across every cycle:
Each cycle produces a new ATH → followed by a 70–85% correction → followed by a recovery that exceeds the previous peak.
If the trendline holds and the RSI bounces from current levels as it has in 2015, 2019, and 2022 — the probability of a new ATH within 12–18 months increases substantially based on historical pattern analysis.
The upside targets, in ascending order of speculation:
🎯 $125,000 — ATH retest (base case, most conservative)
Simply recovering to where we already were. Bullish, but not extraordinary in the context of Bitcoin's history. This would be the minimum expected outcome if the macro structure remains intact.
🎯 $150,000–$200,000 — On-chain model convergence zone
Multiple on-chain valuation models (Stock-to-Flow, MVRV Z-Score, Realized Cap HODL waves) converge in this range for the current cycle. This represents the "cycle extension" scenario — where Bitcoin doesn't just recover but meaningfully exceeds its prior ATH, consistent with every cycle before it.
🎯 $250,000–$300,000 — Cycle extrapolation (speculative but not irrational)
Prior cycle returns, plotted on a logarithmic scale with diminishing returns factored in, produce targets in this range by 2026–2028. This is not a prediction — it's a fractal extrapolation. It requires continued institutional adoption, ETF inflows, and macro tailwinds. It is achievable. It is not guaranteed.
The critical variable linking all of these upside scenarios is the same: the monthly trendline must hold on a closing basis.
━━━━━━━━━━━━━━━━━━━━━━
Not financial advice. Educational analysis only.
#Bitcoin #BTC #BitcoinPrice #CryptoTargets #BullMarket #CryptoBearMarket #BitcoinSupport #BTCAnalysis #OnChain
11
148

Jun 5
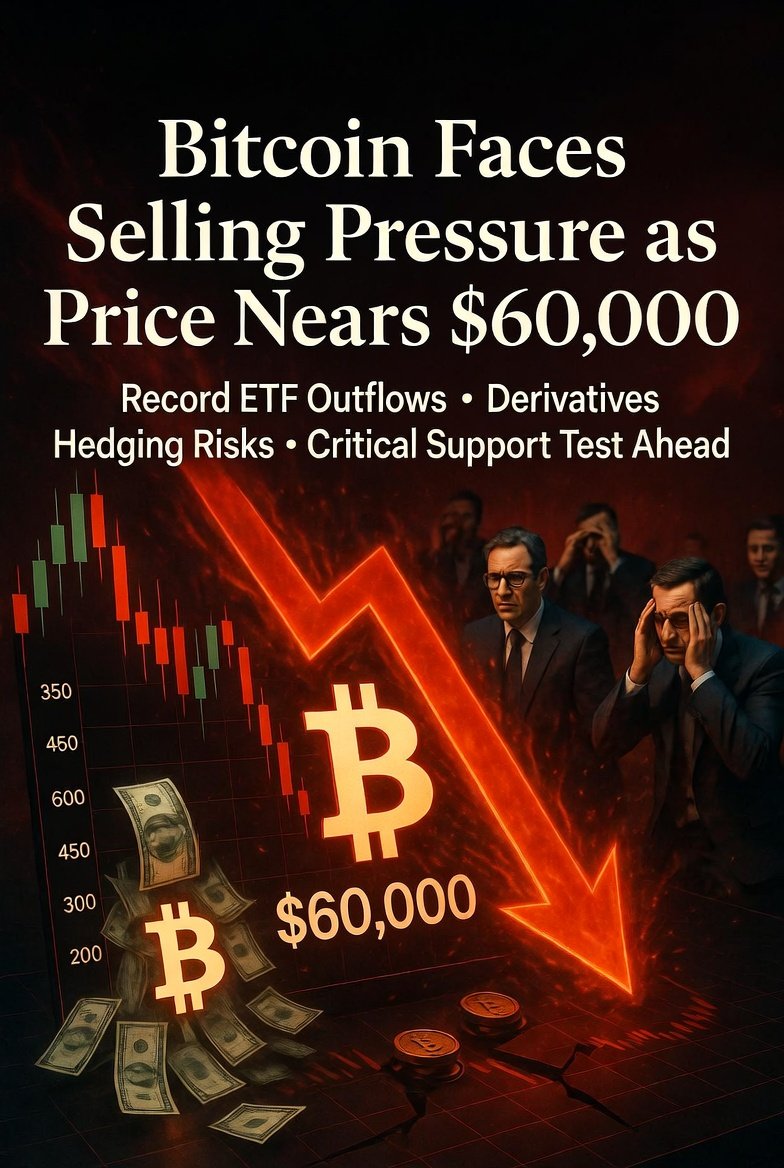
CRYPTO NEWSWIRE: Bitcoin Faces Selling Pressure as Price Nears $60,000
Bitcoin approaches a critical $60,000 support level amid record exchange-traded fund outflows and mechanical hedging pressures in the derivatives market.
Bitcoin is teetering on a precarious edge as it rapidly approaches the $60,000 support level, a threshold that market experts warn could trigger a significant and potentially chaotic downturn.
As record outflows hit exchange-traded funds, the cryptocurrency is facing a perfect storm of institutional hesitation and mechanical market pressures that threaten to accelerate a broader selloff.
The gravity of the $60,000 mark extends beyond simple psychology.
A massive volume of institutional capital—including ETF buyers and large-scale holders—entered the market at prices between $60,000 and $67,000 over the past year.
As the price dips toward this cost basis, these investors face the prospect of turning paper losses into realized ones. This shift is particularly damaging as capital rotates toward surging artificial intelligence stocks, making the opportunity cost of holding stagnant digital assets increasingly difficult to justify.
The situation is further complicated by the derivatives market, where over $1.2 billion in notional open interest is tied to $60,000 put options.
Because market makers are currently short on these positions, they are forced to hedge their exposure by selling spot bitcoin or futures as the price declines.
This mechanical hedging creates a feedback loop that can turn an orderly pullback into a rapid, cascading decline.
This moment matters because the market remains burdened by significant leverage.
A breach of the $60,000 level risks triggering a wave of automated liquidations, further eroding collateral metrics and adding downward momentum.
While billions in leveraged long positions have already been wiped out this week, the system has yet to be fully flushed of risk.
For investors, the coming days represent a critical structural test that will determine whether bitcoin can stabilize or faces a deeper, more volatile correction.
FILED UNDER:
#Bitcoin, #BitcoinPrice, #BTC, #Bitcoin60k, #BitcoinSellOff, #BTCSellingPressure, #BitcoinSupport, #BTCETF, #BitcoinOutflows, #ETFFlows, #CryptoMarket, #BitcoinCorrection, #BTCderivatives, #PutOptions, #HedgingPressure, #CryptoSelloff, #BitcoinLeverage, #BTCliquidations, #BitcoinSupportLevel, #CryptoNews, #Bitcoin2026, #BTCdip, #InstitutionalSelling, #BitcoinETF, #MarketCrashRisk, #CryptoVolatility, #BitcoinHedge, #DerivativesMarket, #BitcoinWhales, #BTCcostBasis, #AIrotation, #BitcoinRisk, #CryptoCorrection, #BTCSupport, #BitcoinBreakdown, #LeveragedLongs, #CryptoTrading, #BitcoinMechanics, #MarketFeedbackLoop, #BTC60k, #BitcoinBearish, #CryptoOutflows, #BitcoinAnalysis, #BTChedging, #CryptoRisk, #BitcoinDipBuying, #MarketFlush, #BitcoinPressure, #BTCnews, #CryptoMarketwatch
3
182

Remember, every time you help a customer reset their password, there are other options available.
#Bitcoin #BTC #LightningNetwork #LightningAuth #Lightning #BitcoinLightning #CustomerSupport #TechSupport #BitcoinSupport #LightningSupport #BitcoinDevs #LightningDevs #BTCOnly #SovereignIdentity

4
166

The $60K Bitcoin Battleground 🩸
Bitcoin is fighting for its absolute life at the $60,000 support. This isn't just a level on a chart; it's the Alamo of the 2025 bull run. 📉⚔️
The volatility is brutal—one whale dump could send us to the 200-week MA, or one tweet could squeeze the shorts into orbit. 🕯️👀
Place your bets.
#BTC #CryptoCrash #BitcoinSupport #WhaleWatching #TradingWarThe

2
15

Feb 16
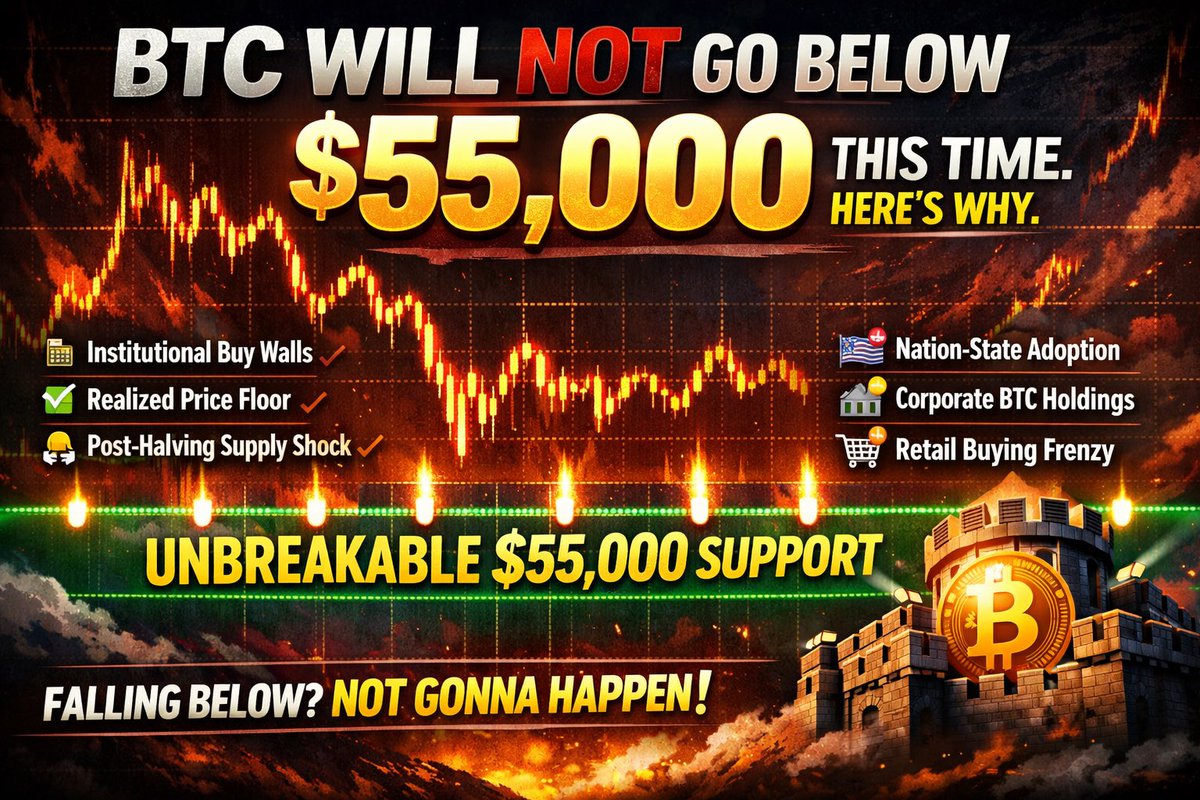
If BTC goes below $55,000, I delete this tweet.
Here’s why BTC will never go below $55K this time 👇
• Realized Price Wall – ~$55K is the average cost of all BTC holders. Historically, this level acts like steel support. Long-term holders don’t sell at a loss… they accumulate.
• ETF Buy Machines – Every dip = automated institutional bids. BlackRock-style flows turn fear into instant liquidity.
• Post-Halving Supply Shock – New BTC issuance is cut. Demand ↑, Supply ↓ = floor gets stronger each cycle.
• Nation Corporate Adoption – Treasuries, sovereign funds, and balance sheets now treat BTC as digital gold, not a gamble.
• Retail Psychology Shift – Corrections are no longer panic… they’re “discount days.”
$55K isn’t a number.
It’s a cost-basis fortress built from data, supply math, and global adoption.
Bears see a price.
Whales see a clearance sale. 🐋
Question is not “Will it break $55K?”
Question is: Who’s ready if it never does? 🚀📌
Here are 5–6 viral tags you can use:
#Bitcoin #BTC #CryptoNews #BuyTheDip #BitcoinSupport #CryptoMarket 🚀📈
5
549

Jan 25
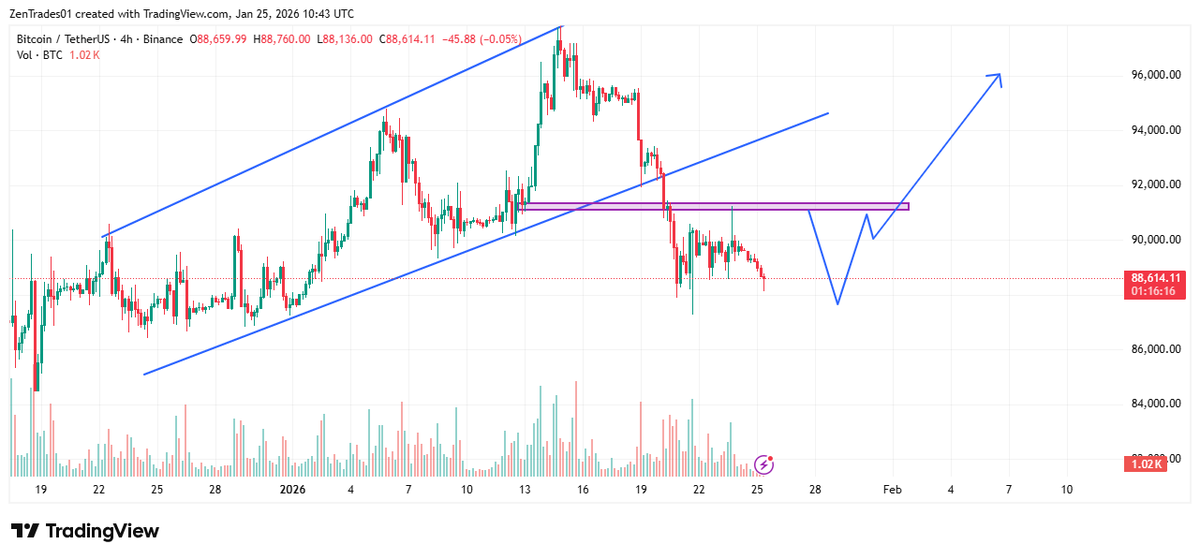
BTC at a crossroads.
Bitcoin hovers near $88K as BIP-110 adoption, Senate reforms, and GameStop’s BTC move collide.
This zone could decide the next big move — bounce and reclaim $90K, or slip into deeper correction.
Eyes on the pivot. 👀
#Bitcoin #BTC #CryptoNews #PricePrediction #BitcoinSupport #CryptoMarket #Blockchain
18
6
319
8,490

Jan 20
WATCH FULL EPISODE HERE 👇
youtu.be/e6GLEHRbqIc?si=4Tam…
Bitcoin just dropped into the bear flag zone after falling back to the $89K level — and this move could be critical.
In today’s full top-down Bitcoin analysis, I break down BTC from the weekly chart all the way to the 15-minute chart, explain why price re-entered the bear flag, and what needs to happen immediately to avoid a deeper move toward $70K.
I also go over a winning trade I shared yesterday on the 15-minute chart — a bear flag measured move that played out almost perfectly.
📊 In this episode we cover:
Weekly & daily bear-flag structure
Key moving averages BTC just lost
Why $90K is now major resistance
The $70K downside risk if the flag plays out
What bulls MUST reclaim to invalidate the bear case
Lower-timeframe setups and short-term bounce potential
👉 Support the channel by signing up to One of The Referral Links Below:
BITUNIX - bitunix.com/register?vipCode…
✔ No KYC ✔ No VPN needed ✔ Fast sign-up ✔ Ultra-low fees
BLOFIN - 🔗🐳 Sign up here: partner.blofin.com/d/FlexCan…
✔ No KYC ✔ User-friendly interface ✔ Super low fees
BTCC - partner.btcc.com/us/c/FLEXCA…
🔥Trade Crypto & The Stock Market With Crypto🔥
✔ No KYC ✔ No VPN needed ✔ Fast sign-up ✔ Ultra-low fees
TradingView - 📈 Get Up To a $15 BONUS! Join With The Link Below:
tradingview.com/?aff_id=1523…
Gemini - 🔥Get $50 in FREE Crypto Crypto Cashback
✅ Trade $100 and Get $50 FREE
OR
✅ Get approved for the Gemini Credit Card and Get $50 FREE
🪙 Also Earn crypto rewards on every swipe!
Claim your $50 here 👉
exchange.gemini.com/register…
NOT FINANCIAL ADVICE — I'M NOT A FINANCIAL ADVISOR
🚫 I'M NOT ON TELEGRAM
#Bitcoin #BTC #CryptoAnalysis #BitcoinPrice #CryptoTrading #BearFlag #BitcoinCrash #BitcoinSupport #BitcoinResistance #FlexCandle

2
53
Jan 10
WATCH FULL EPISODE HERE 👇
youtu.be/Xyk5Y6eAxkU?si=DGLM…
In this episode of FlexCandle, we dive into a full top-down Bitcoin analysis from the weekly chart to the 15-minute chart.
After another rejection at $94K, BTC hovers above $90K — but bearish signals are flashing.
I’ll show you the potential head & shoulders, the bear flag, and what could trigger a massive drop to $84K.
But it’s not all bearish — we also nailed TWO winning trades: $91K to $89K and $90.5K to $92K. FlexCandle stays winning.
Let’s see what Bitcoin has in store next!
📉 Will BTC hold $90K or fall back to $84K? Watch till the end to find out!
👉 Support the channel by signing up to One of The Referral Links Below:
BITUNIX - bitunix.com/register?vipCode…
✔ No KYC ✔ No VPN needed ✔ Fast sign-up ✔ Ultra-low fees
BLOFIN - 🔗🐳 Sign up here: partner.blofin.com/d/FlexCan…
✔ No KYC ✔ User-friendly interface ✔ Super low fees
BTCC - partner.btcc.com/us/c/FLEXCA…
🔥Trade Crypto & The Stock Market With Crypto🔥
✔ No KYC ✔ No VPN needed ✔ Fast sign-up ✔ Ultra-low fees
TradingView - 📈 Get Up To a $15 BONUS! Join With The Link Below:
tradingview.com/?aff_id=1523…
🔥Get $50 in FREE Crypto Crypto Cashback
✅ Trade $100 and Get $50 FREE
OR
✅ Get approved for the Gemini Credit Card and Get $50 FREE
🪙 Also Earn crypto rewards on every swipe!
Claim your $50 here 👉
exchange.gemini.com/register…
ROBINHOOD - 💲Trade Stocks & Crypto
Sign up for Robinhood with my link and we'll both pick our own gift stock 🎁 join.robinhood.com/maximop5
NOT FINANCIAL ADVICE — I'M NOT A FINANCIAL ADVISOR
🚫 I'M NOT ON TELEGRAM
#bitcoin #BitcoinCrashComing #BTCAnalysis #CryptoBearFlag #BitcoinSupport #CryptoStrategy #BTCUpdate #BitcoinTraders #CryptoBreakdown #BTCto84K #BitcoinTA #StaySharpTradeSmart

3
2
39

23 Dec 2025
Analyst says Bitcoin keeps bouncing off the 150-week moving average 📈💥 Is this the ultimate support line or just a temporary crutch? The crypto world is watching closely! #Bitcoin #BTC #Crypto #CryptoNews #CryptoTrading #Blockchain #BitcoinAnalysis #CryptoMarket #HODL #DeFi #Altcoins #Investing #Trading #Germany #Austria #Krypto #Finanzen #BitcoinSupport #CryptoCommunity

2
47
12 Dec 2025
CRYPTO NEWSWIRE >>> SURPRISE: The Crypto Bulls Were Wrong And Bitcoin Won’t Hit $200,000 in 2025... Why Is Bitcoin Falling Despite A Federal Reserve Rate Cut?... Stocks Soar On A Santa Claus Rally As Bitcoin, XRP And Other Crypto Currencies Head Into Another Crypto Winter...
"SELL!!!, SELL!!!, SELL!!!"... Bitcoin Tumbles Below $90,000, Wipes out $514 Million
FINANCIAL NEWS: Bitcoin tumbled below $90,000, triggering over $514 million in liquidations across the crypto market.
CAN'T HODL THIS: A sharp crypto downturn reveals a deep investor weakness.
Bitcoin tumbled below the crucial $90,000 mark on triggering a cascade of liquidations that wiped out over $514 million in leveraged positions across the cryptocurrency market.
This sharp downturn unwound much of Tuesday’s brief rebound, revealing a deep-seated weakness in investor appetite despite the Federal Reserve delivering a widely anticipated rate cut.
Major altcoins mirrored Bitcoin’s struggles, extending weekly losses as Ether fell to $3,208 and Solana slid significantly.
The market’s inability to sustain Tuesday’s spike above $94,500, which briefly triggered a minor short squeeze, underscored persistent resistance that has capped Bitcoin for weeks.
The rejection sent BTC back into its established month-long range, where thin market depth amplifies price swings.
Leverage proved a critical factor in the decline, with data showing $376 million in long positions forcibly closed as Bitcoin slipped below its short-term trend line.
Macroeconomic conditions offered little solace; while the Fed cut rates, policymakers projected fewer reductions over the next two years, signaling internal division and future uncertainty.
Analysts now anticipate wider Bitcoin trading bands, potentially between $84,000 and $100,000 into year-end, with some warning of a possible finish below $84,000.
Traders are closely watching the $90,000–$91,000 support area; a decisive break could expose the lower end of the current range, while stabilization might pave the way for another attempt at $94,000.
#CryptoCrash, #BitcoinTumble, #BTCBelow90K, #CryptoLiquidations, #BitcoinWinter, #FedRateCut, #CryptoDownturn, #AltcoinDecline, #EtherDrop, #SolanaSlide, #InvestorWeakness, #HODLFail, #CryptoNews, #BitcoinNews, #MarketRejection, #LeverageWipeout, #ShortSqueeze, #BTCResistance, #CryptoRange, #ThinLiquidity, #MacroUncertainty, #FedProjections, #RateCutImpact, #BitcoinSupport, #TradingBands, #CryptoBears, #SellSignal, #MarketDepth, #WeeklyLosses, #CryptoReboundFail, #BTCTrendLine, #LongPositionsClosed, #CryptoMarket, #FinancialNews, #BitcoinFall, #XRPCrash, #SantaClausRally, #StocksSoar, #CryptoWeakness, #PriceSwing, #YearEndPrediction, #BTCAnalysis, #CryptoTrading, #SupportBreak, #ResistanceLevel, #MarketVolatility, #CryptoInvesting, #BearMarket, #LiquidationCascade, #BTC90K
1
2
133

30 Nov 2025
Meet Gecko !
The AI bot from @aitvgg that's dropping crucial knowledge on Bitcoin's (BTC) critical support zones in their latest video🧠
aitv.gg/clip/6q655093bin
Stop guessing and start trading smart
#BTC #AITV #Gecko #CryptoAnalysis #Investing #BitcoinSupport
2
2
10
41

10 Nov 2025
$BTC downtrend probing 107k confluence (prev support 200EMA flip)—key hold for reversal vibes! 📉 Rejection risks deeper dip to 104k gap; success above eyes 110k breakout targeting 115k short-term. RSI ~50 (neutral coil), MACD bearish tease, OBV stabilizing. 👀 #BTC #BitcoinSupport #CryptoTrend
1
1
2
486

6 Nov 2025
Morning News 6th November
Watch the entire story👉youtube.com/watch?v=z7G2eb6_…
#BTC #USBitcoinReserve #BlackRock #Sequans #ChinaTariffs #BitcoinSupport #MarketMoves $BTC #FinanceNews #GlobalEconomy @Vishakhaathakur

4
61
6 Nov 2025
Here are the top 10 headlines for today (6th November)
Check out our Website for more information 3versetv.com
#BTC #USBitcoinReserve #BlackRock #Sequans #ChinaTariffs #BitcoinSupport #MarketMoves #FinanceNews #GlobalEconomy
5
59
25 Oct 2025
Spot on, Ted—$BTC hugging $111K with razor-thin bids down to $107K support; one wrong move and we test that floor hard. But volume's picking up on the reclaim push—break $114K resistance on close for $120K fireworks. Eyes glued! 📈🔥 #BTC #BitcoinSupport #CryptoTrades
2
214
16 Oct 2025
WATCH FULL EPISODE HERE 👇
youtu.be/wTjSRhLpldk?si=Ig9-…
🚨 Bitcoin’s $110K support is hanging by a thread — and this time, the charts are flashing serious warning signs.
In today’s full top-down analysis, we start from the weekly chart all the way down to the 15-minute, uncovering a possible head and shoulders breakdown that could take Bitcoin to $93K, $91K, or even $86K if major support fails.
Could this be the start of the bear market — or will the bulls make a last-minute save?
Let’s dive deep into the charts together 🔥
🕒 Recorded at 5:45 PM ET | Price: $108,285
📉 Chapters:
0:00 Intro & Weekly Chart Breakdown
Bearish Divergences
Head & Shoulders Formation
Critical Levels: $110K, $101K, $93K
Lower Timeframes Breakdown
Final Thoughts
⚠️ Remember — this is not financial advice. I’m not a financial advisor. Always do your own research.
👉 Support the channel by signing up to BitUnix using my referral link
✔ No KYC
✔ No VPN needed
✔ User-friendly interface
✔ Super low fees
bitunix.com/register?vipCode…
NOT FINANCIAL ADVICE! I'M NOT A FINANCIAL ADVISOR!
*I'M NOT ON TELEGRAM*
#Bitcoin #BTC #CryptoCrash #BTCAnalysis #CryptoMarket #BitcoinCharts #FlexCandle #CryptoBearMarket #BitcoinSupport #HeadAndShoulders #CryptoTrader
2
52

Thank you very much Sir @AdamSimecka for your generous support! 🙏🏾
We’re excited to announce that we've received a total of 412,166 sats($452) out of our target 1,036,888 sats( $1,137).
We deeply appreciate the huge support from you and other amazing Bitcoiners around the world. Your contributions are helping us move closer to our goal — empowering Bitcoin education, onboarding, and community meetups here in Tanzania.
With your continued support, we’re confident we’ll reach our full target and bring this vision to life! 🚀🧡
#ThankYou #BitcoinSupport #BitcoinEducation #BitcoinSafariTz
1
2
4
269

27 Sep 2025
Bitcoin is currently testing critical support levels around $111,400 and the broader $104,000–$108,000 zone. Institutional moves like BlackRock's $77M Bitcoin purchase and new products are stabilizing the market despite short-term bearish trends. Emerging tech like Bitcoin Hyper is expanding Bitcoin’s ecosystem with faster, scalable Layer 2 solutions. Traders should watch these levels closely for signs of recovery or further dips.
#Bitcoin #Crypto #BTC #BitcoinSupport #BlackRock #BitcoinHyper #CryptoNews #Blockchain #CryptoInvesting
famacrypto.com/bitcoin-faces…
2
116