
🎥 Polynomial Regression Channels (PRC) in cTrader
In this video, we explore the Polynomial Regression Channels (PRC) in cTrader - an indicator that fits a polynomial regression line to recent price data and creates a channel around it to help identify market direction and potential dynamic support and resistance levels.
You’ll learn where to find the PRC in cTrader, how to adjust its settings and appearance, and how the indicator plots a curved, non-linear channel based on recent price data.
We also look at how traders use the PRC to interpret different market conditions. The video shows how the indicator can help identify bullish, bearish and ranging markets, spot overbought and oversold conditions when price moves outside the channel, and analyse pullbacks in trending conditions when price retraces towards the opposite band.
The walkthrough also includes a breakout example, showing how traders may watch for a shift in the channel direction together with price breaking above a prior high.
📍 Timecodes
00:09 – Introduction: what are Polynomial Regression Channels (PRC)
02:00 – Where to find the PRC in cTrader and how to customise its settings
02:27 – Using the PRC to identify bullish, bearish and ranging market conditions
03:07 – Spotting overbought and oversold conditions with the PRC
03:56 – Using the PRC to analyse pullbacks in trending markets
04:30 – Reviewing a breakout example with the PRC
- Learn more about the Polynomial Regression Channels - help.ctrader.com/knowledge-b…
- Join Discord - go.spotware.com/discordX
Don’t forget to like and share your thoughts in the comments!
_____________________________________
👉 Start Trading with cTrader - sptwr.link/aog01TI 👈
23
376
147
8,919

FDA Clears #AI Powered Software for Improving Low-Contrast CT Detection
diagnosticimaging.com/view/f…
@RadiologyACR @ARRS_Radiology @RSNA @thoracicrad @SNM_MI @SubtleMedical
#radiology #RadRes #CTRad
1
142

Air pollution may be doing more harm to the heart than we once thought. A large, decade-long study using cardiac CT found that long-term exposure to common urban pollutants at even "moderate" levels is linked to more advanced coronary artery disease, including greater plaque buildup and higher likelihood of obstructive disease. As imaging continues to reveal the hidden impact of environmental exposures, improving air quality could play a critical role in preventing heart disease. Read more: bit.ly/49QmA8d
#CTRad #CVRad #AirPollution

1
3
562

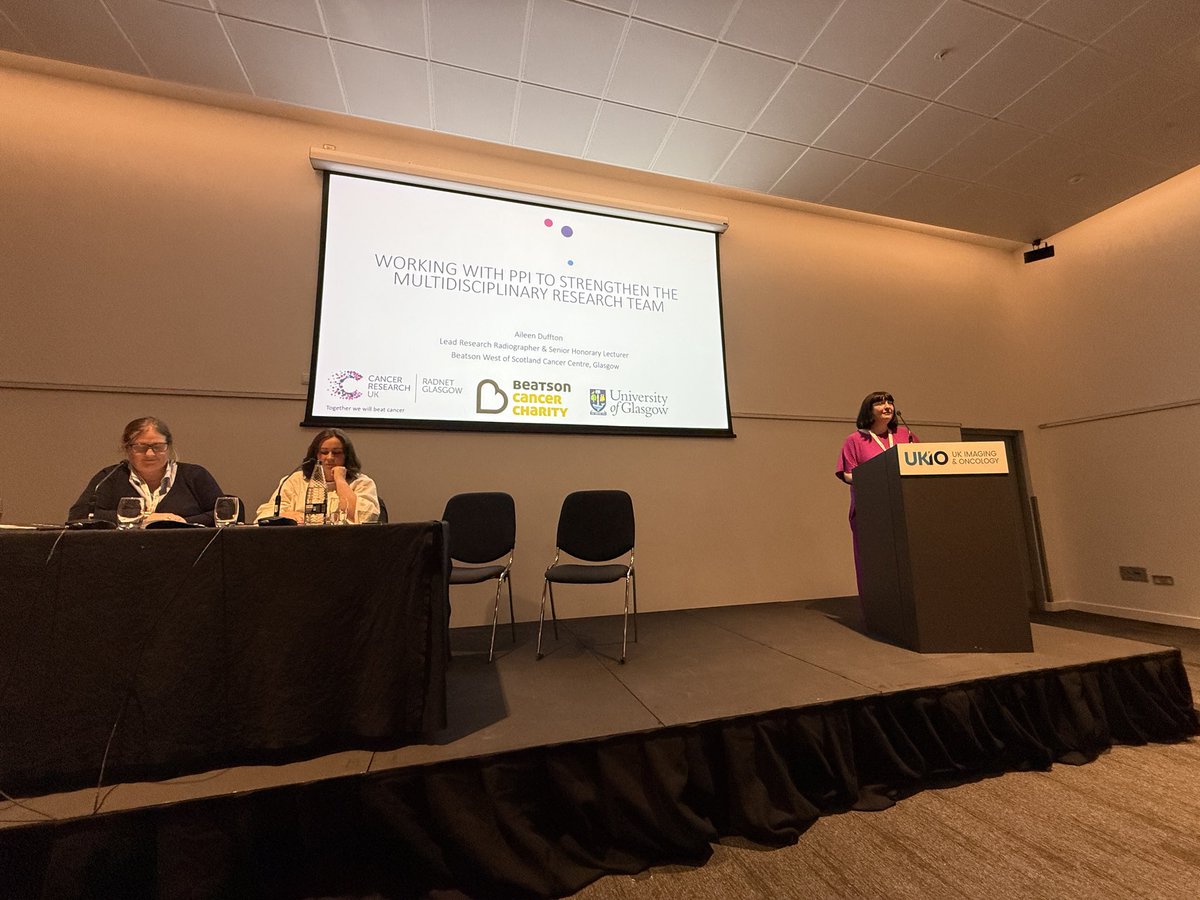
A fantastic few days at #UKIO2026 in #Liverpool! Thanks for inviting me to speak about patient-centred care and #equity of access to radiotherapy services & research alongside the wonderful @aileen_duffton and a very inspiring patient advocate! @royalmarsdenNHS #CTRad #ICR


1
39
Can #AI Assessment of CT Attenuation Correction Mapping Be a Viable Alternative for CAC Risk Stratification?
diagnosticimaging.com/view/a…
@RadiologyACR @ARRS_Radiology @RSNA @Heart_SCCT @SNM_MI
#radiology #RadRes #CTRad #SNMMI26

1
2
180
Emerging CT Research Suggests Possible Correlation Between Subclinical #Emphysema and Vertebral Bone Loss
diagnosticimaging.com/view/c…
@RadiologyACR @ARRS_Radiology @RSNA @Hopkins_Rad
#radiology #RadRes #CTRad
2
261
CT scans already contain rich body composition data. AI can help unlock it at scale. A Penn Medicine team used deep learning to segment muscle and fat in 7,500 abdominal CTs, establishing population reference patterns and exploring links to metabolic disease and frailty. The goal: make sarcopenia easier to identify, quantify and act on, potentially enabling earlier interventions that improve quality of life. Read more: bit.ly/4ttamJr
#AbdRad #CTRad #Sarcopenia

1
1
4
1,030
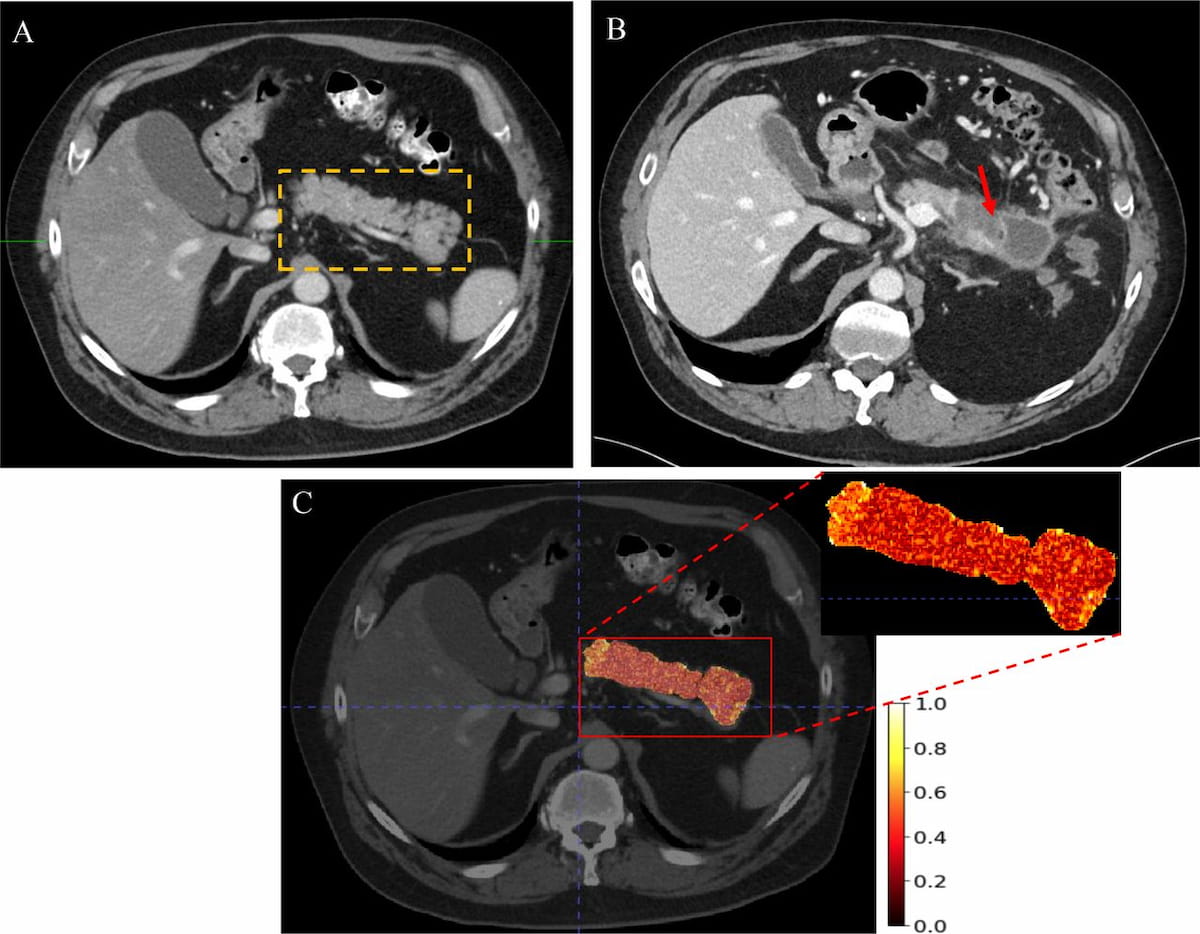
Can a Radiomic #AI Model Facilitate Earlier CT Detection of Pancreatic Ductal Adenocarcinoma?
diagnosticimaging.com/view/r…
@RadiologyACR @ARRS_Radiology @RSNA @SocietyAbdRad
#radiology #RadRes #CTRad
1
2
3,914
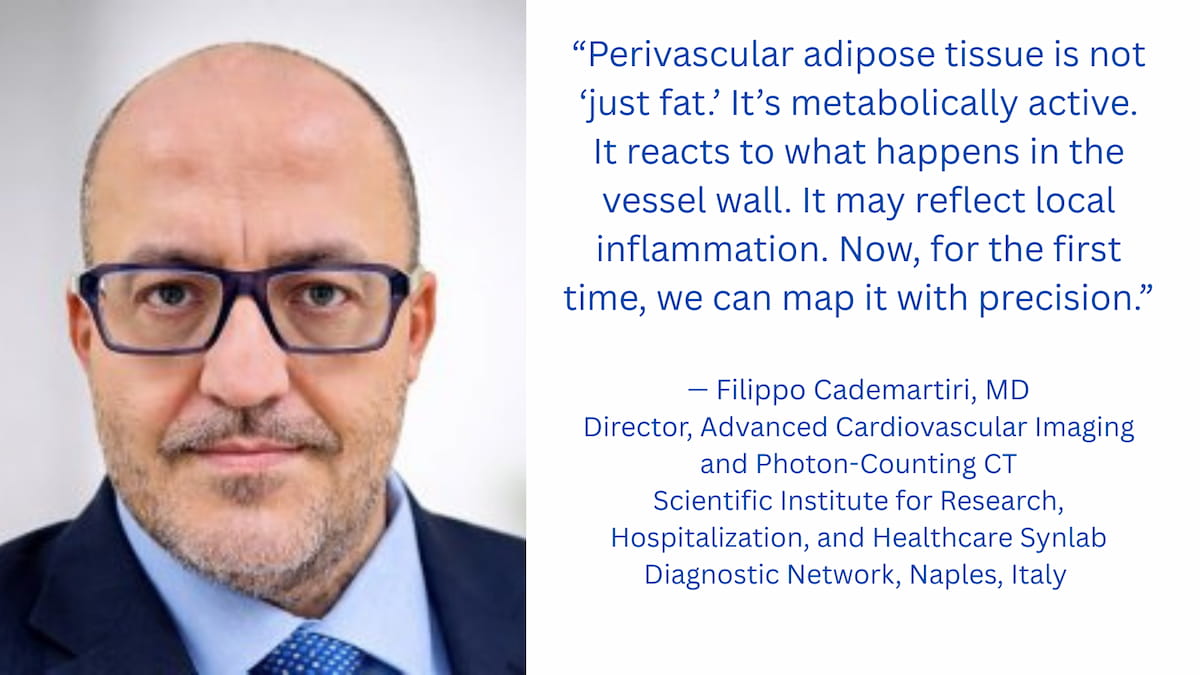
Blog: @FCademartiri discusses what PCCT reveals about carotid perivascular adipose tissue
diagnosticimaging.com/view/p…
@RadiologyACR @ARRS_Radiology @RSNA @UCSFimaging @Heart_SCCT @UofURadiology @UWRadiology @RadiologyUSC @StanfordRad @UNMRadiology
#radiology #RadRes #CTRad
3
3
366
CCTA plaque quantification improves risk assessment in women with stable chest pain. Risk may emerge at lower plaque burden, and noncalcified plaque predicts MACE. Don’t dismiss “modest” plaque as benign. Jan Brendel, MD, won the 2025 RSNA Trainee Research Prize for this work.
#CTRad #CVRad #WomensHealth
1
4
1,190
Is It Time to Revisit Low-Dose CT Screening Protocols in Patients at High Risk for #LungCancer?
diagnosticimaging.com/view/i…
@RadiologyACR @ARRS_Radiology @RSNA @thoracicrad @UNCRadiology @PennRadiology @Hopkins_Rad @WCMRadiology @YaleRadiology
#radiology #RadRes #CTRad
1
103
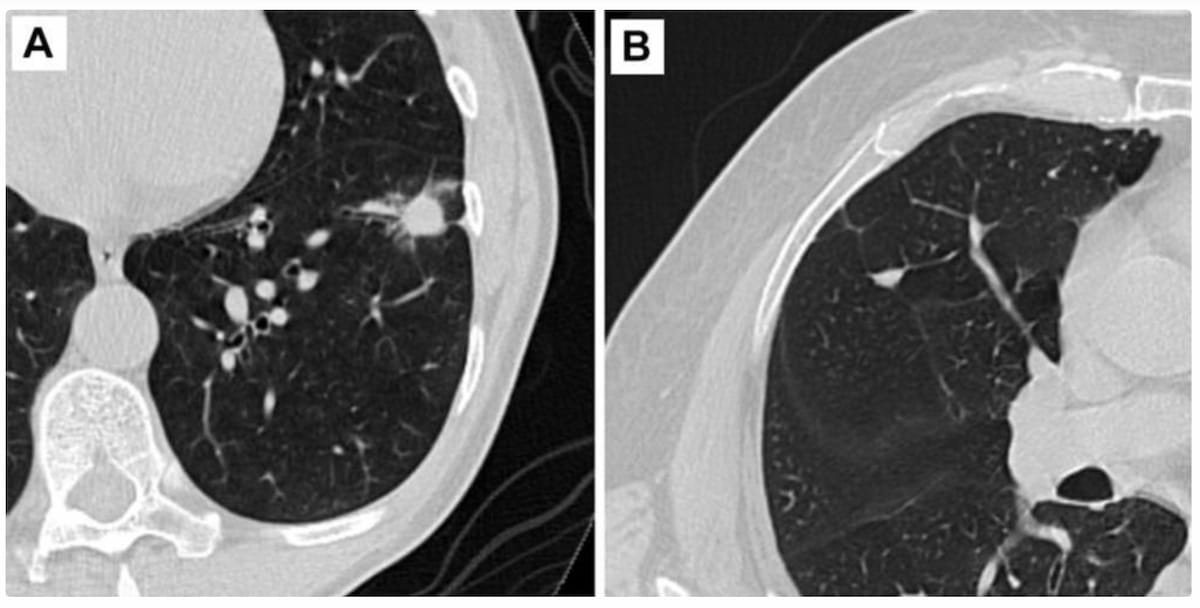
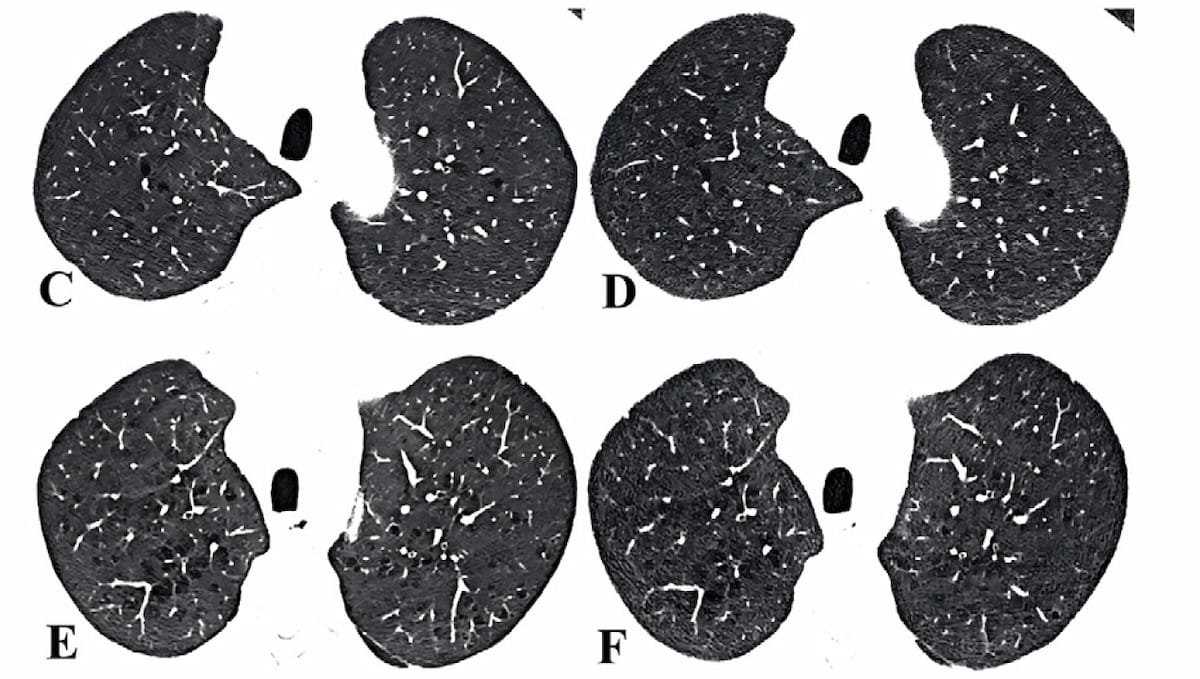
Study Examines Key CT Features for Differentiating Fibrotic Interstitial #LungDisease
diagnosticimaging.com/view/s…
@RadiologyACR @ARRS_Radiology @RSNA @thoracicrad @YaleRadiology @PennRadiology @Hopkins_Rad @UVARadiology @DukeRadiology @NYUImaging
#radiology #RadRes #CTRad
2
204
Study: PCCT Facilitates Superior SNR and CNR in Lung Cancer Imaging with 55 Percent Reduction in Radiation Dosing
diagnosticimaging.com/view/s…
@RadiologyACR @ARRS_Radiology @RSNA @thoracicrad @PennRadiology @WCMRadiology @BrighamRad @DukeRadiology
#radiology #RadRes #CTRad
2
122
FDA Issues 510(k) Clearance for #AI Powered #LungCancer Detection on Low-Dose CT Scans
diagnosticimaging.com/view/f…
@RadiologyACR @ARRS_Radiology @thoracicrad @UCSFimaging @OHSURadiology @MayoRadiology @UWRadiology @UCSDRadMed @uciradiology @MEDIANTechno
#radiology #RadRes #CTRad

3
123
FDA Issues 510(k) Clearance for #AI Powered #LungCancer Detection on Low-Dose CT Scans
diagnosticimaging.com/view/f…
@RadiologyACR @ARRS_Radiology @RSNA @thoracicrad @PennRadiology @Hopkins_Rad @YaleRadiology @DukeRadiology @OSURadiology @MEDIANTechno
#radiology #RadRes #CTRad
2
2
186
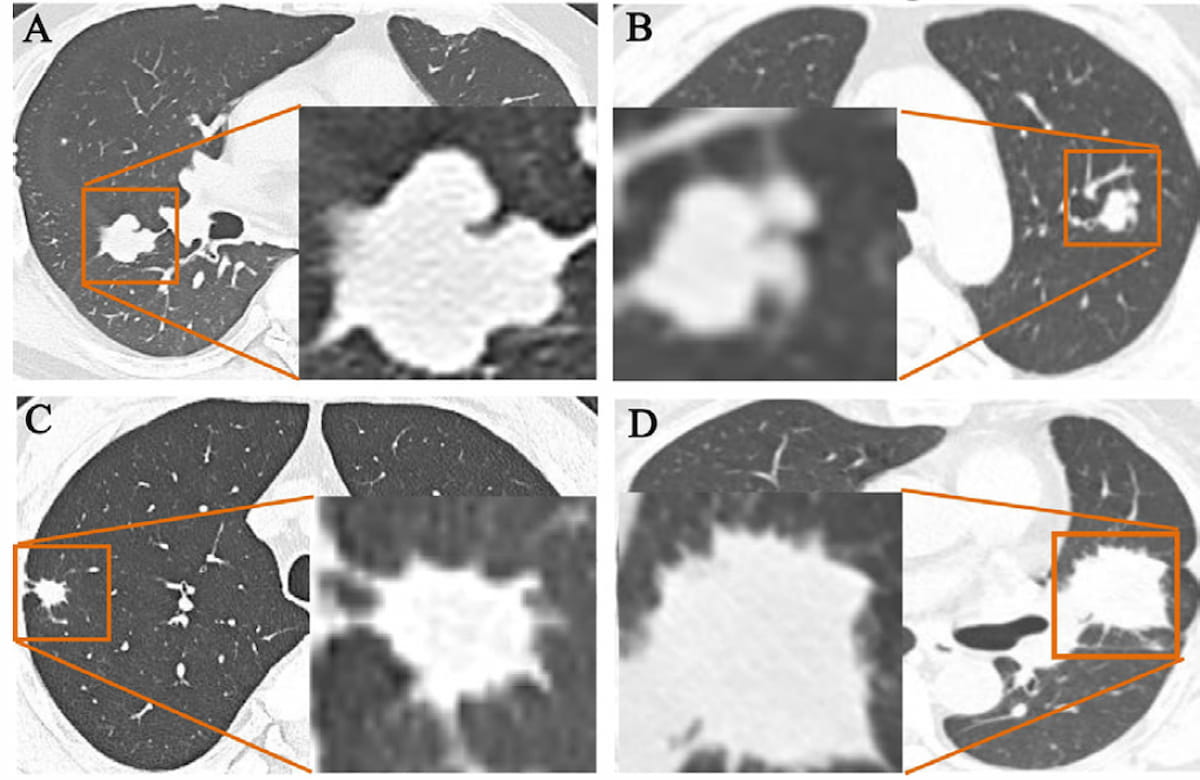
Study Shows Photon-Counting CT Reduces Radiation Exposure by 66 Percent for Patients with #LungCancer
diagnosticimaging.com/view/s…
@RadiologyACR @ARRS_Radiology @RSNA @thoracicrad @UCSFimaging @MayoRadiology @OHSURadiology @UofURadiology @RadiologyUSC
#radiology #RadRes #CTRad

3
155
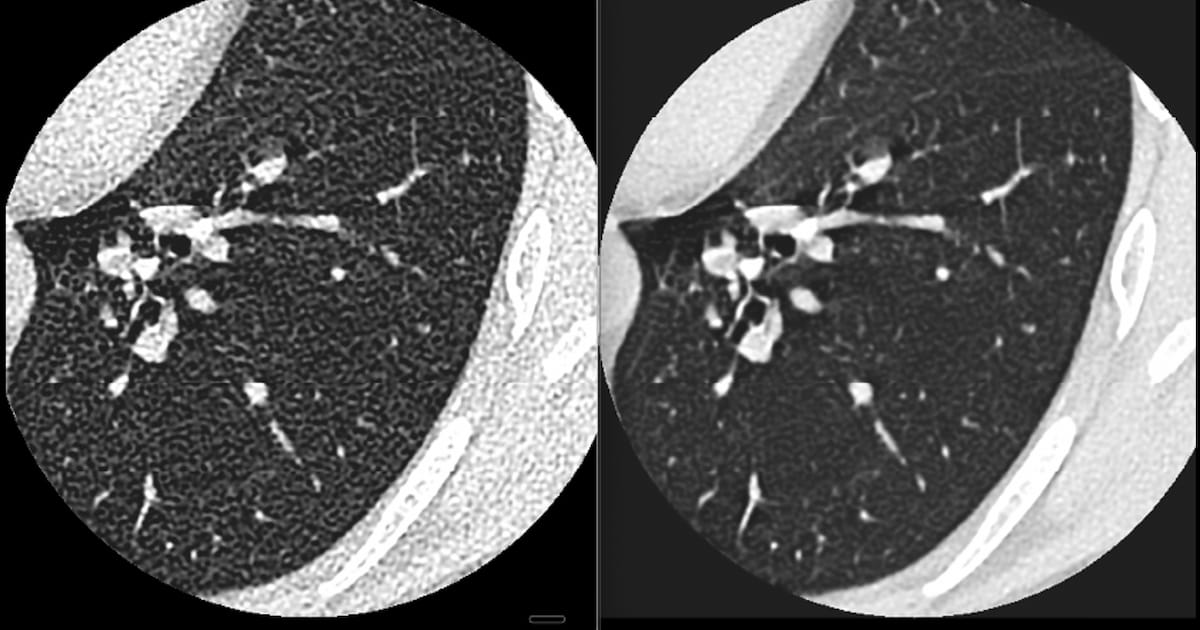
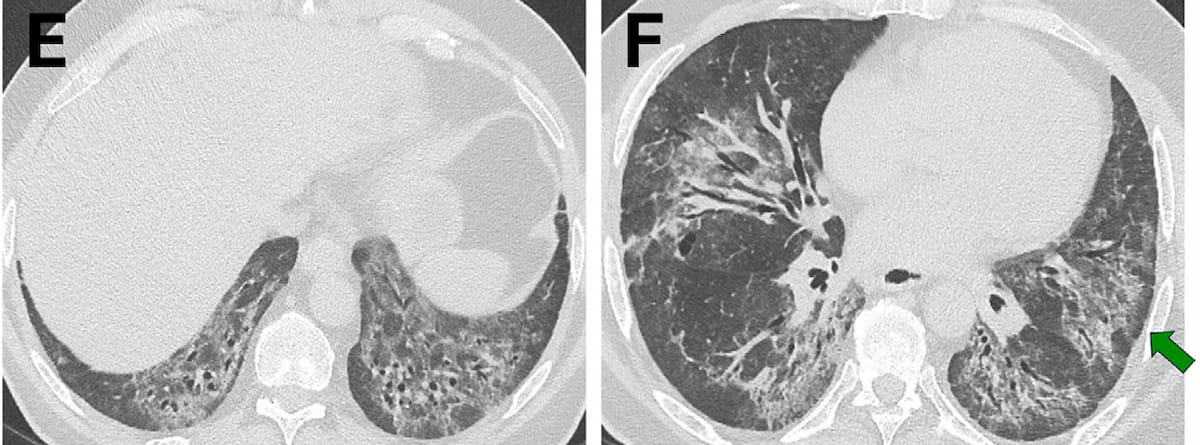
Photon-Counting CT Facilitates 87 Percent Reduction in Radiation Dosing for #Emphysema Assessment
diagnosticimaging.com/view/p…
@RadiologyACR @ARRS_Radiology @RSNA @thoracicrad @UofURadiology @OHSURadiology @MayoRadiology @UWRadiology @UCSFimaging @UCSDRadMed
#radiology #RadRes #CTRad

1
2
126
Photon-Counting CT Facilitates 87 Percent Reduction in Radiation Dosing for #Emphysema Assessment
diagnosticimaging.com/view/p…
@RadiologyACR @ARRS_Radiology @RSNA @thoracicrad @UCSFimaging @OHSURadiology @MayoRadiology @UWRadiology @StanfordRad @RadiologyUSC
#radiology #RadRes #CTRad
1
1
137
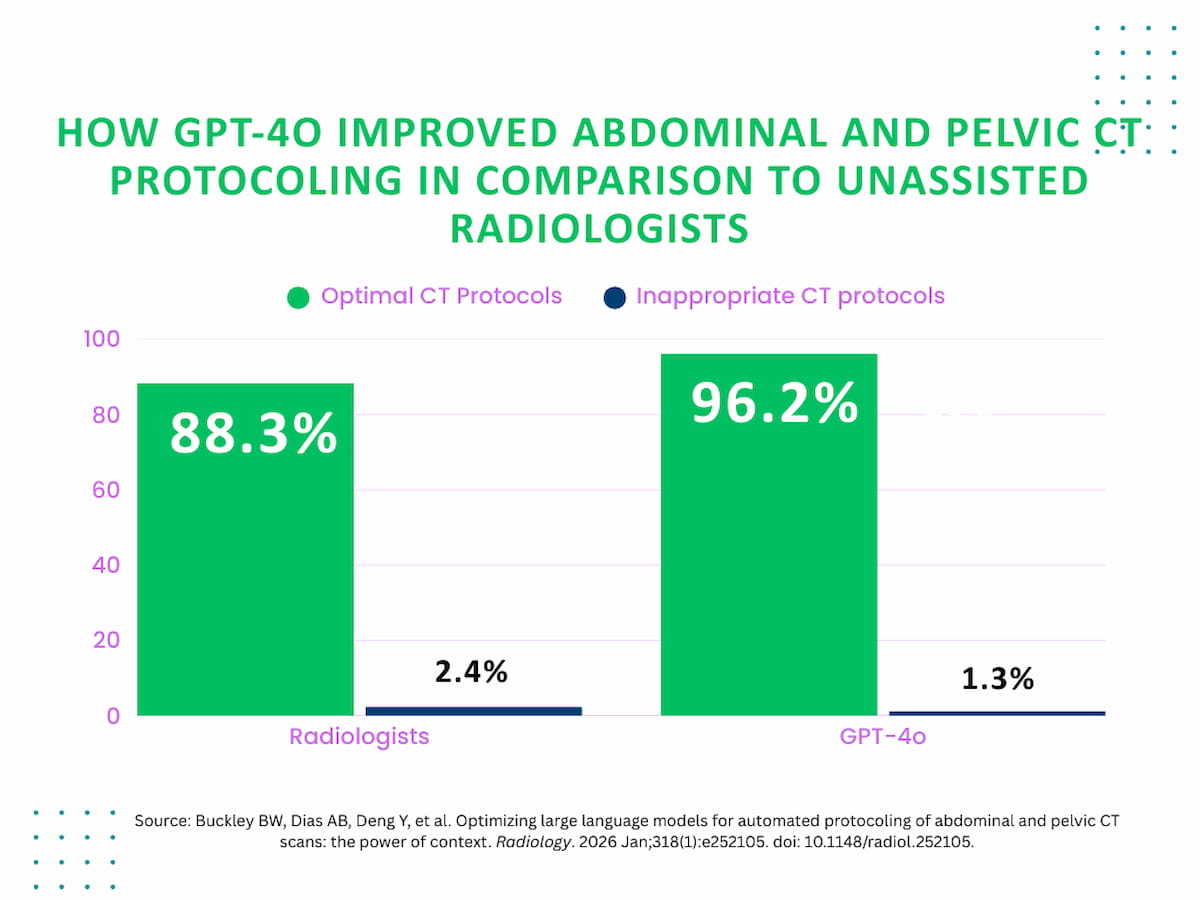
Could LLMs Enhance Protocoling Efficiency for Abdominal and Pelvic CTs?
diagnosticimaging.com/view/l…
@RadiologyACR @ARRS_Radiology @RSNA @SocietyAbdRad @PennRadiology @Hopkins_Rad @YaleRadiology @imagingtoronto @DukeRadiology @MontefioreRAD @RajeshBhayana_
#radiology #RadRes #CTRad
2
155

23 Dec 2025
El pasado domingo, el profesor don José Miguel Gambra (de 75 años), presidente de la CTrad (@lactrad), y su familia fueron hostigados a la salida de Misa por Carmen Palomares Mañas, David de Andrés Mendiguren y otras personas en nombre de un grupúsculo denominado «JVC»
22 Dec 2025

😡 Condena de la hostigación matonil de @juvcarlistas contra José Miguel Gambra, Presidente de la Candidatura Tradicionalista @lactrad
🧵👇
20
46
2,937