

Apr 29
Create Line Charts in PowerPoint
Learn how to build clean and effective line charts in PowerPoint.
slidestack.com/blog/how-to-m…
#LineChart #PowerPoint #DataVisualization #PresentationDesign #SlideDesign #BusinessPresentation #ChartDesign #PresentationTips #Infographics
10

Apr 20
A lot of people think AI tools are only for writing, but they’re also great for images, tables, and presentations. Give clear input, and it can give you a version ready to use. @canva @OnvaEr33698 @NotionHQ #PresentationScreen #PresentationDeck #AiTools #ChartDesign
3

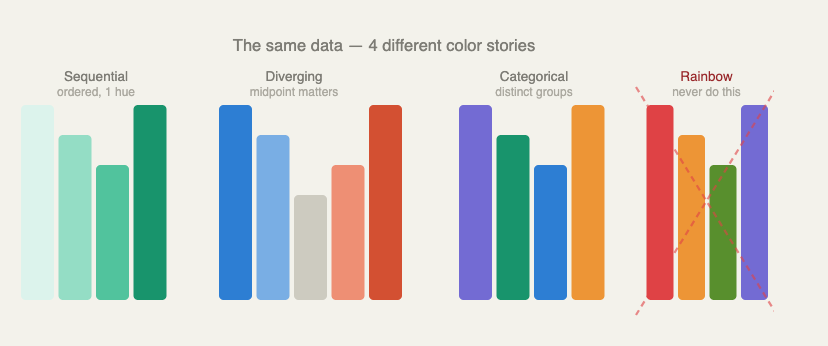
Color 🎨 is the most misused element in data visualization.
And the 4 types every analyst should know:
- Sequential: one hue, ordered intensity → for "more/less" data
- Diverging: two hues, neutral midpoint → for "above/below zero"
- Categorical: distinct hues → for unordered groups
- Rainbow: never. ever. use this. ⚠️
Why not rainbow? It has no perceptual order.
Two people with different color vision see completely different stories. Color should encode meaning. Not signal effort.
#DataViz #ColorTheory #DataDesign #Accessibility #ChartDesign #DataScience #30daychartchallenge
36
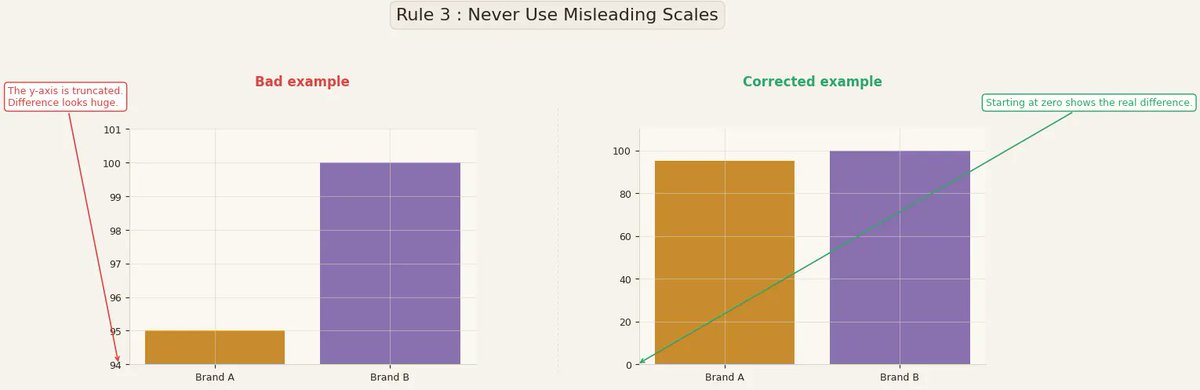
You know the rule:
"start your bar chart axis at zero."
But do you know WHY?
A 2025 Annual Review of Vision Science paper lays it out precisely:
Humans don't read charts.
They extract relative magnitudes using preattentive visual systems built for survival, not statistics.
When you truncate the axis, you weaponize those systems against your reader.
They feel a 5% difference as a 50% difference.
And they will make decisions accordingly.
Design is not neutral. It is always a claim about what matters.
Paper: annualreviews.org/content/jo…
#DataViz #Visualization #CognitiveBias #DataDesign #ChartDesign #DataLiteracy
1
22

Apr 5
📺 プログラミングニュース 2026年第14週を公開
Chart Designでは、プログラミング・Web開発の最新ニュースを毎週動画でお届けしています。
今週のハイライト:
・Swift 6.3 / C# 15 正式リリース
・Next.js v16.2.2 安定版
・FastAPI v0.135.3 app.vibe() 追加
・Ollama v0.20.0 Gemma 4 対応
・Lodash セキュリティ修正
チャンネル登録よろしくお願いします👇
youtu.be/MsGV2fwi7Hg
#プログラミング #Web開発 #エンジニア #YouTube #AI #chartdesign

88
Mar 29
📺 YouTubeチャンネル始めました
プログラミング・Web開発の最新ニュースを毎週お届けします。
初回は「2026年第13週」のニュースをまとめました。
チャンネル登録よろしくお願いします👇
youtu.be/xyXJTstNnsI?si=JTEk…
#プログラミング #Web開発 #エンジニア #YouTube #chartdesign
2
37

Feb 16
Build nested rectangle charts that expose hidden patterns in layered datasets. Discover techniques for hierarchical analysis. Learn more!
#TreemapinExcel #ExcelTreemap #TreemapChart #ExcelCharts #ExcelGraph #DataAnalysis #ChartDesign
chartexpo.com/blog/treemap-i…
6

24 Nov 2025
✍️12 Chart Design Tips Every Developer Needs to Know!
Designing charts isn’t just about visuals, it’s about clarity and impact! Discover how to make your charts stand out and communicate insights effectively.
🛠️ Choose the right chart type – Match your data with the most suitable visualization.
🎨 Use color wisely – Enhance readability without overwhelming the viewer.
🏷️ Label clearly – Ensure axis labels and legends are easy to understand.
✅ Optimize for responsiveness – Make charts look great on all devices.
🔗 Full blog: syncfusion.com/blogs/post/ch…
#DataVisualization #DotNetMAUI #ChartDesign #DataViz #Dashboard #Syncfusion

74

23 Nov 2025
Graphics design.
Stunning high-fidelity graphs and charts for a veteran technology startup's funding presentation.
#datadesign #chartdesign #graphicsdesign #statdesign
1
26

11 Nov 2025
อีนนี้จริงมากและองค์ประกอบแต่ละอัน Introproject, Zoning, Diagram, Site, Concept, Layout, Plan, Elevation, Section, Perspective, 3D model, Final Model, Presentation, Chartdesign all Project , , ถึงทำเรื่อยๆบริหารเวลาดี เราก็ยังทำถึงนาทีสุดท้าย เพราะมันดีได้อีกในแต่ละอย่าง
1
1
6
1,410
11 Nov 2025
Introproject, Zoning, Diagram, Site, Concept, Layout, Plan, Elevation, Section, Perspective, 3D model, Final Model, Presentation, Chartdesign all Project - ลองเอาแต่ละองค์ประกอบที่ต้องส่งไปหาดู เพราะถึงทำเรื่อยๆบริหารเวลาเราก็จะอยากทำจนวินาทีสุดท้ายจริงๆ
1
279

9 Nov 2025
A small UI/UX project for a multichannel sales SaaS
featuring custom AI-driven charts & dashboard components.
Focused on clarity, speed, and conversion.
#saas #startupdesign #uxdesign #productdesign #aiux #uidesign #dashboarddesign #chartdesign #framer #designsystems
4
3
7
141

3 Nov 2025
(4/12)
Choose the right chart 🧩
Wrong chart = wrong insight.
📊 Bars → comparisons
📈 Lines → trends
🟣 Scatter → correlations
🔥 Heatmaps → patterns
#ChartDesign #DataScience
15

24 Sep 2025
Master the humble pie chart! 🥧📊 Our guide reveals the simple do's and don'ts for clear, impactful visuals. Stop confusing your audience. Start communicating effectively.
ow.ly/stcq50X1ylY
#DataViz #MakeOffer #ChartDesign #PieChart #Business #Theo #Domain

9

9 Sep 2025
OMG , after 3-4hours finally I finished this #chartdesign with #dataanalysis , crazy final #exam for this #MBAclass. By #HellenTang
1
1
3
109

18 Aug 2025
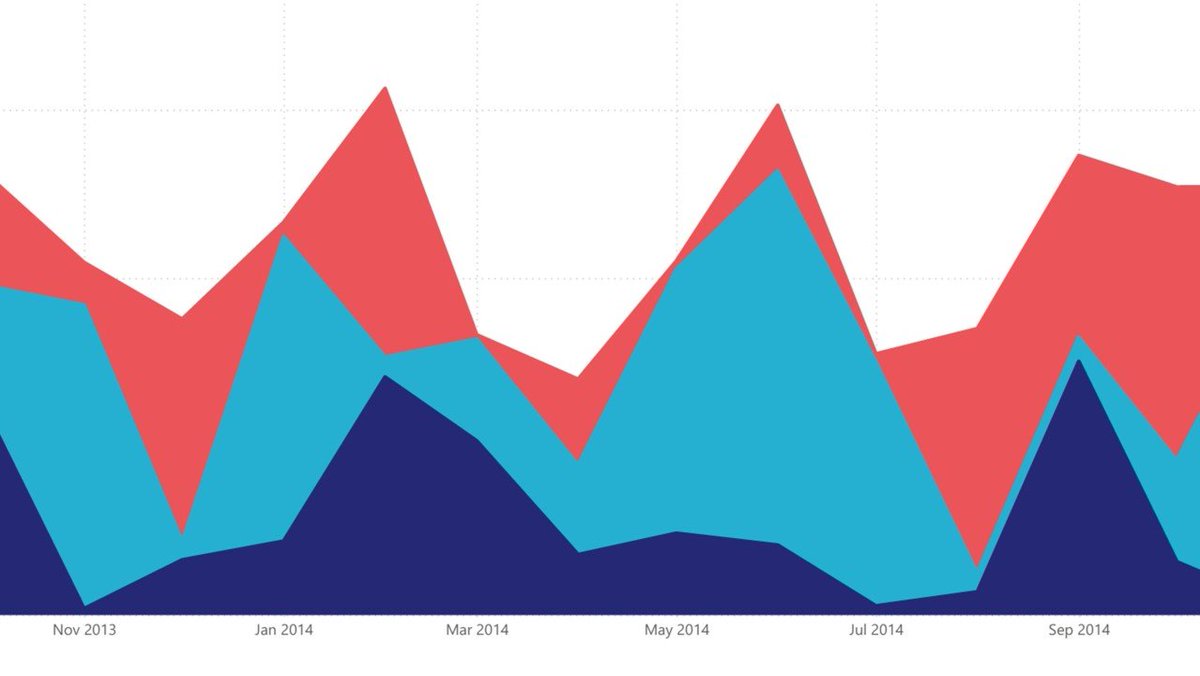
"An area chart tells not just what changed, but how much it mattered, visually amplifying the story of growth, decline, and contribution."
Let's dive into 'Area Charts in Focus' linkedin.com/pulse/area-char…
#AreaChart #ChartsInFocus #Data #DataVisualization #DataViz #Viz #Analytics #PowerBI #BusinessIntelligence #DataStorytelling #VisualizationTips #ChartDesign
3
62

25 Jul 2025
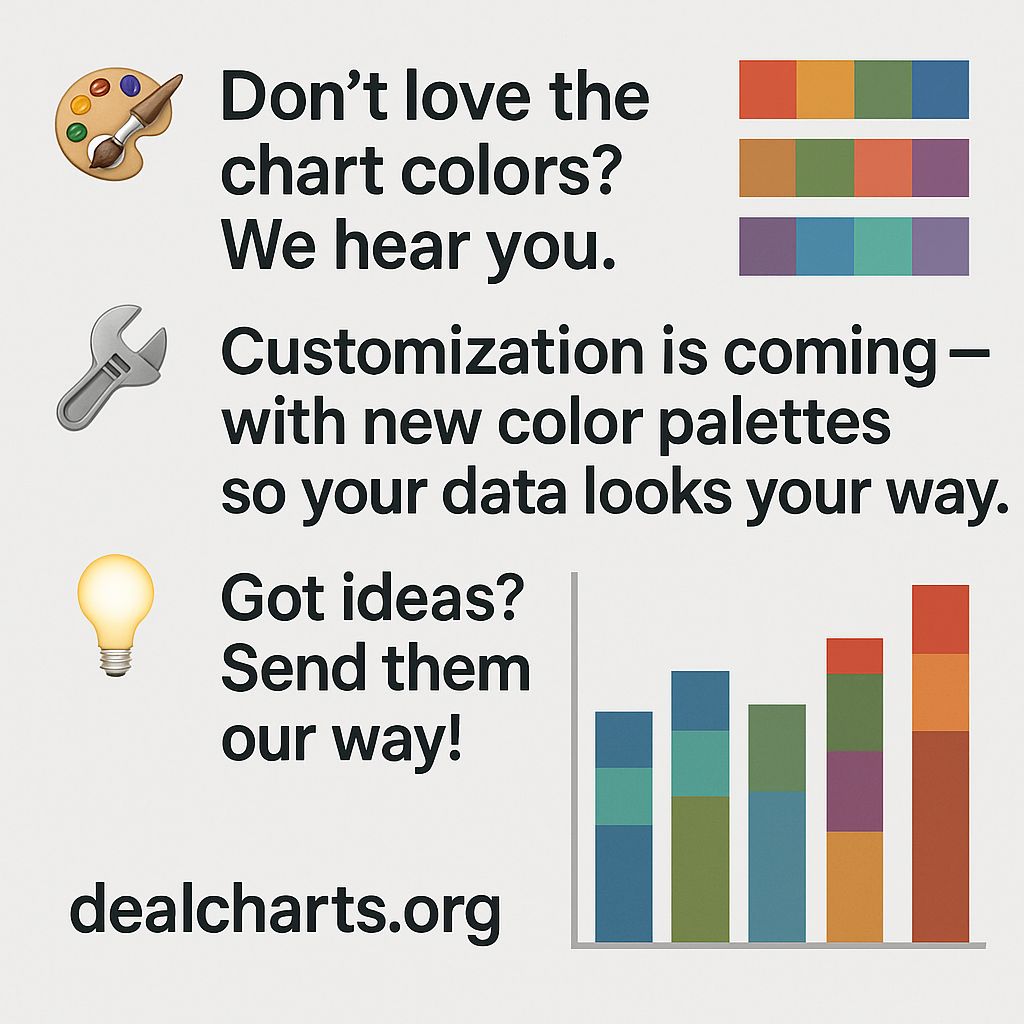
🎨 Don’t love the chart colors? We hear you.
🛠️ Customization is coming — with new color palettes so your data looks your way.
💡 Got ideas? Send them our way!
🔗 dealcharts.org
#DealCharts #DataViz #CmdRvl #ChartDesign
3

11 Jul 2025
📊New data wizard – FlowcastGPT🤖
Transform your data into beautiful charts without touching a design tool!
📌From pitch decks to trend analysis
💡Just type it… and watch the AI do the magic.
🚀Get started FREE!
#AIDiagram #AIChartGenerator #InfographicsTools #ChartDesign

4
17

9 Jul 2025
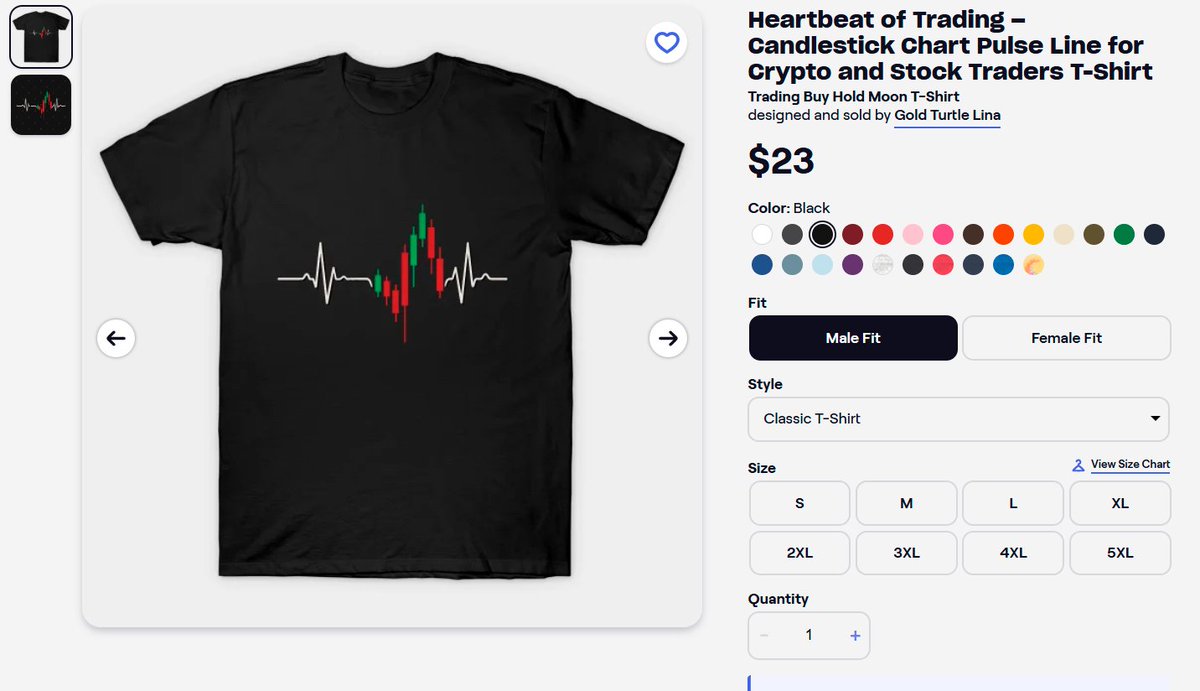
Heartbeat of Trading – Candlestick Chart Pulse Line for Crypto and Stock Traders T-Shirt
@TeePublic
teepublic.com/user/gold-turt…
Feel the pulse of the market with this striking trading-inspired artwork. Combining a heartbeat line with a classic candlestick chart, this design perfectly captures the adrenaline rush and emotional highs of every trader’s journey. It’s more than a graphic — it’s a symbol of your passion for the markets, your drive, and your connection to the rhythm of price action. Whether you're into crypto, stocks, or forex, this minimalist print makes a bold statement and keeps you focused on the beat of the trade. #traderart, #candlestickchart, #cryptowallart, #stockmarketart, #forextrading, #priceaction, #minimalisttrader, #heartbeatdesign, #cryptoart, #daytraderlife, #financialfreedom, #tradingpassion, #cryptotrader, #chartdesign, #tradingdecor, #BTCUSDT #ETH #Ethereum #btc
1
25