
18 Aug 2025
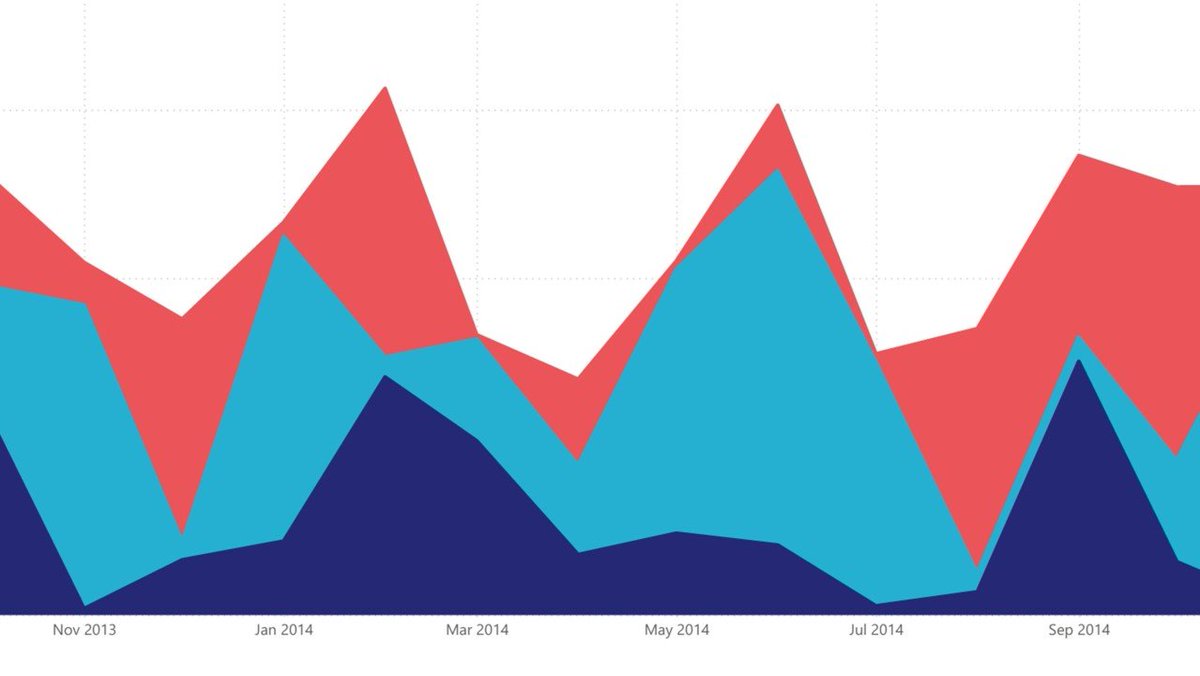
"An area chart tells not just what changed, but how much it mattered, visually amplifying the story of growth, decline, and contribution."
Let's dive into 'Area Charts in Focus' linkedin.com/pulse/area-char…
#AreaChart #ChartsInFocus #Data #DataVisualization #DataViz #Viz #Analytics #PowerBI #BusinessIntelligence #DataStorytelling #VisualizationTips #ChartDesign
3
62
8 Jun 2025
Waterfall charts are powerful tools for visualizing step-by-step changes in values, helping you understand how individual factors contribute to a final result. In this article, I explore the essentials of waterfall charts and introduce variations like traditional waterfall, breakdown waterfall, positive-only waterfall and horizontal waterfall charts. Whether you are working in finance, operations, or analytics, this "Waterfall in Focus" guide will help you communicate cumulative change with clarity and impact 💡⚡
linkedin.com/pulse/waterfall…
#WaterfallInFocus #Data #DataVisualization #DataViz #Viz #Analytics #PowerBI 💛 #BusinessIntelligence #DataStorytelling #VisualizationTips #ChartDesign

2
37
22 Feb 2025
Scatter plots are a vital visual for uncovering relationships and correlations between variables 🔍 In this article, I delve into the core principles of scatter plots and explore advanced variations such as bubble, categorical scatter, quadrant, and volcano charts. If you are passionate about data 💡 this "Scatter in Focus" guide will take you on a quick journey through the world of scatter visualization!
Let's Focus linkedin.com/pulse/scatter-c…
#ChartsInFocus #ScatterInFocus #Data #DataVisualization #DataViz #ScatterPlots #Analytics #DataScience 🧪 #BusinessIntelligence 💡 #DataStorytelling #VisualizationTips ⚡ #PowerBI 💛

2
59

24 Nov 2024
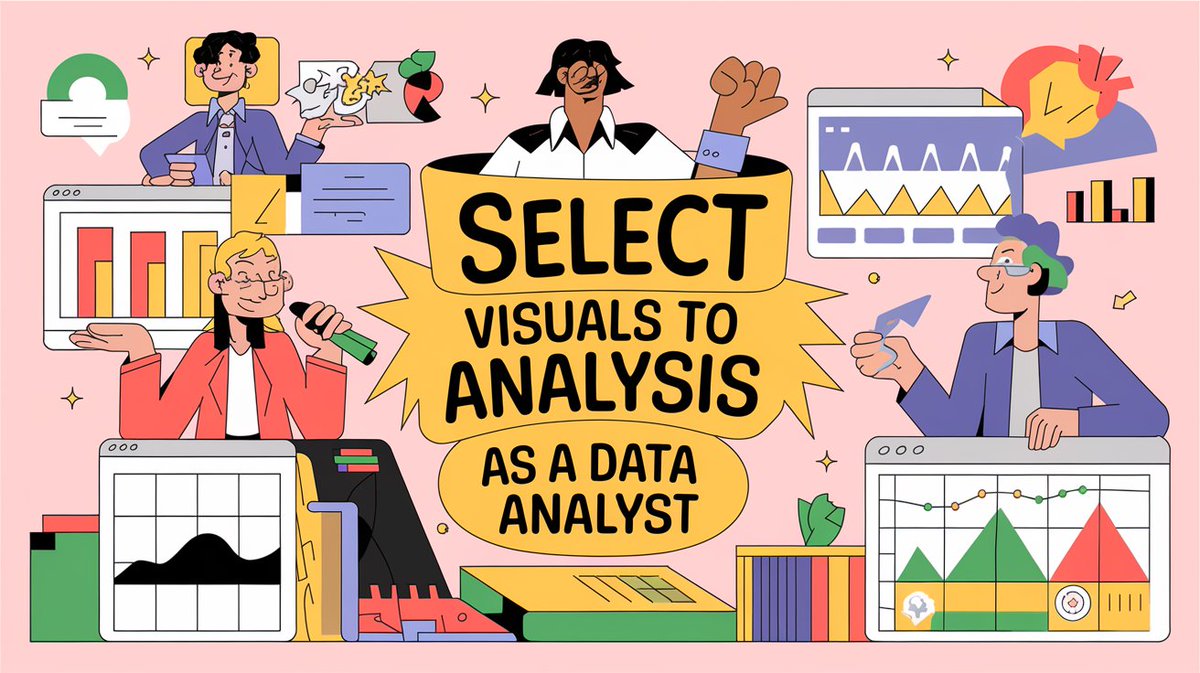
When you create visuals as a data analyst, focus on your data and the type of analysis you are performing.
• Are you comparing sales with the previous year or quarter?
• Do you want to see sales trends across months?
• Do you want to see data density?
• And much more.
You have different visuals for different kinds of analysis.
𝗙𝗼𝗿 𝗲𝘅𝗮𝗺𝗽𝗹𝗲:
• Side by Side bar charts for comparison.
• Line charts for trends.
• Heat maps for data density.
• Scatterplots for a lot of data points.
So, as a data analyst, first, figure out the kind of analysis that you are performing and then decide visuals according to that.
Have you ever encountered a problem in deciding which visual to use?
Mention them in the comments!
Enjoy. Follow for more.
#DataVisualization #DataAnalytics #DataAnalysis #DataAnalyst #AnalyticsTips #BusinessIntelligence #DataStorytelling #VisualizationTips #AnalyticsCommunity #EffectiveVisuals #USADataAnalytics #UKDataAnalyst #EuropeAnalytics #SingaporeDataAnalyst #GlobalDataCommunity #DataVisualizationWorldwide
#AnalyticsInUSA #AnalyticsInUK #AnalyticsInEurope #AnalyticsInSingapore #VisualizeData #DataPresentation #BusinessDashboards #TrendsAnalysis #DataDensity #AnalyticsDesign #ActionableInsights #VisualizationBestPractices
#DataDrivenDecisions #AnalyticsCareerTips
2
21
26 Aug 2024
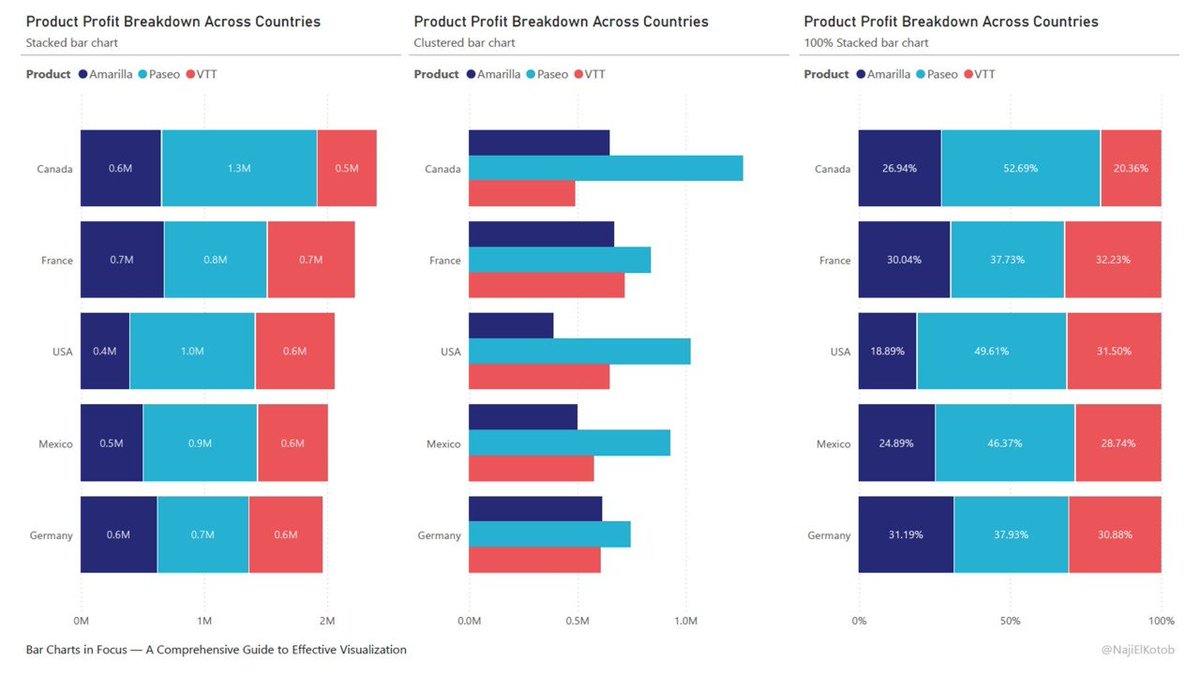
Bar Charts in Focus — From their historical origins to modern applications, bar charts remain fundamental tools in data visualization. In this article, I explore stacked, clustered, and 100% stacked bar charts, sharing key dos and don'ts for crafting effective visuals. Whether you are a data enthusiast or a seasoned professional, this comprehensive guide and curated references 🔍 will elevate your data visualization skills. Enjoy the journey into the world of data!
➡ linkedin.com/pulse/bar-chart…
#Data #DataVisualization #DataViz #BarCharts #Analytics #DataScience 🧪 #BusinessIntelligence 💡 #DataStorytelling #VisualizationTips ⚡ #PowerBI 💛
2
134

17 May 2024
🌟 The Power of Visualization: Manifesting Your Ideal Life 🌟
Welcome to Wellness Mindset Hub! In this captivating video, we dive deep into the transformative power of visualization and how it can help you manifest your ideal life. 🌈✨
Visualization is more than just imagining—it's about creating a detailed mental image of your desired outcomes. By visualizing your goals with clarity and emotion, you activate the subconscious mind and set the stage for manifestation. 🧠💭
Join us as we uncover the science behind visualization, explore effective techniques, and share real-world examples of how visualization can turn dreams into reality. 🌟🚀
Discover how to integrate visualization into your daily routine, take inspired action towards your goals, and manifest the life you've always dreamed of. Whether you're seeking success, abundance, or fulfillment, this video will empower you to unlock the limitless potential of your mind and create the life you desire. 💫🏆
Subscribe to Wellness Mindset Hub for more videos on manifestation, meditation, and personal growth. Together, let's harness the power of visualization and manifest our dreams into reality. 🌍💖
#visualization #manifesting #idealife #lawofattraction #meditation #mindfulness #personaldevelopment #selfgrowth #positivemindset #success #goalsetting #visualizationtips #manifestation #selfimprovement #mindset #positivity #lawofattractionmanifestation #manifestyourdreams #visualizationworks #visualizationpower
🌟✨ visualization, manifesting, ideal life, law of attraction, meditation, mindfulness, personal growth, self-improvement, positive mindset, success, achieving goals, visualization techniques, manifestation practices, visualization exercises, manifesting dreams, visualization benefits, visualization tips, visualization meditation, visualization success, visualization techniques for success. 🌟✨
Watch now: youtu.be/RIsp7FYTFjo
1
1
25

14 Mar 2023
Hey anon! Want to transform your data into captivating insights?💡📊
You should learn the best practices for data visualization and create impactful visual representations that will help others easily understand your data. 🤓👀
🧵👇 #visualizationtips
1
1
2
61
