
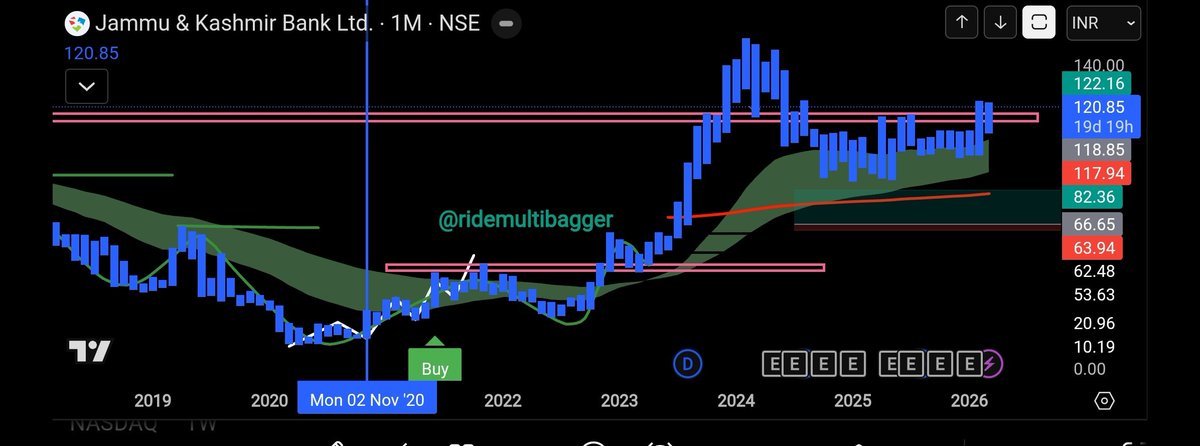
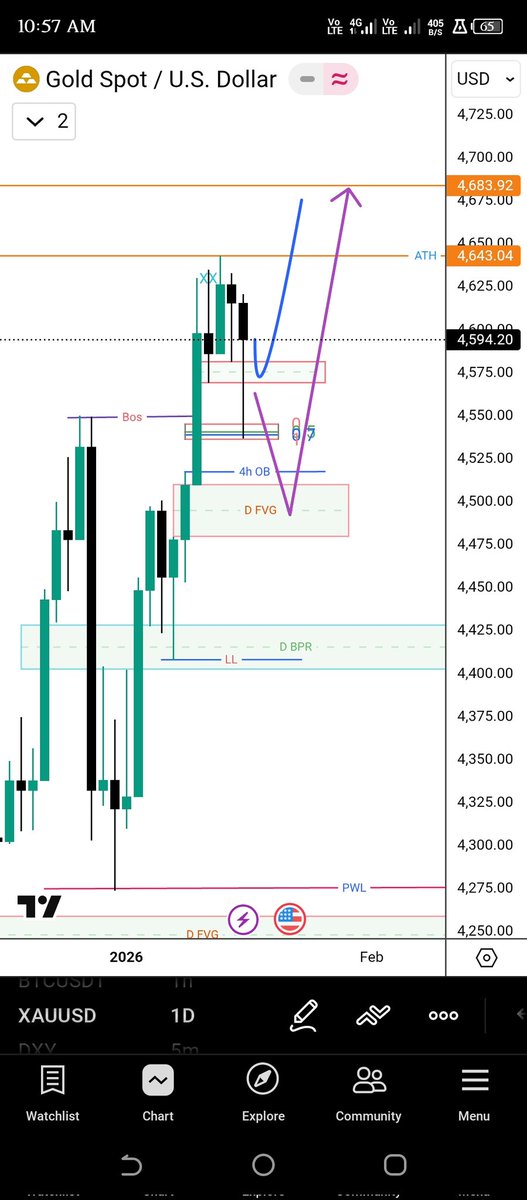
Breaking into a new 52-week high, #JKBank highlights how price structure and momentum phases unfold in real time.
Consistent chart study helps decode these behaviors — not through predictions, but through understanding how trends evolve, pause, and continue.
At #RMB, the focus remains on structured learning of swing trading — process over tips, clarity over noise.
Because in markets, observation builds conviction — not shortcuts.
Explore more: ridemultibagger.com
#MarketStructure #SwingTrading #ChartStudy #TechnicalEducation #PriceAction

📊 When a market revisits a long-standing reaction zone years after a base formation, it often highlights how price memory develops over time.
Current Structure Context
The monthly chart of Jammu & Kashmir Bank Ltd. shows a prolonged decline between 2018–2020 followed by a base formation where price began stabilizing after repeated tests of lower levels.
From this base, price transitioned into a steady upward phase, creating a series of higher swing structures that eventually led to a sharp expansion during 2023–2024.
After that expansion, price moved into a corrective consolidation and is now again interacting with the horizontal reaction band near the earlier peak region.
Technical Study Notes
Two clear horizontal zones are visible on the chart.
The lower zone marks the structural transition area where price moved from base formation into expansion, while the upper zone reflects the region where the earlier rally lost momentum.
During the consolidation phase after the 2024 peak, price swings narrowed and repeatedly interacted with the mid-range moving average band. This indicates a period where momentum slowed and the market shifted toward equilibrium behavior.
The longer-term moving average remains positioned below the price structure with a gradual upward slope, while recent candles show price approaching the same reaction band that previously acted as a ceiling.
Risk Consideration
Reaction zones do not guarantee persistent influence.
Price structures can transform if market participation, liquidity conditions, or broader financial sector sentiment change.
Even long-standing consolidation ranges can evolve into new structural patterns over time.
Neutral Fundamental Snapshot
Jammu & Kashmir Bank operates as a regional banking institution with strong exposure to retail and government-linked banking activity in Jammu & Kashmir and nearby regions.
In recent years, the bank has focused on improving asset quality and stabilizing profitability following earlier periods of elevated non-performing assets, with financial performance showing gradual recovery in recent reporting cycles.
Educational Closing
Long-term charts often reveal how markets repeatedly interact with the same zones across different phases of a trend.
What does this repeated return to earlier reaction areas teach about how markets build and revisit structural memory?
Disclaimer: This chart discussion is for educational purposes only and does not constitute investment advice.
#MarketStructure #ChartStudy #JKbank #TechnicalEducation #RiskAwareness
2
1,086

Mar 13
Disappear, learn price action, control emotions, master risk, and return to the market as a disciplined trader ready for consistency. #kukjanostenfx #forex #cryptotrading #tradingmindset #chartstudy #discipline #proptrading #success
4
1
2
16

Feb 21
ನೀವು ಸ್ಟಾಕ್ ಮಾರ್ಕೆಟ್ ಅಲ್ಲಿ ಹಣ ಹೂಡಿಕೆ ಮಾಡಿದ್ದರೆ ಚಾರ್ಟ್ ಗಳನ್ನು ನೋಡುವುದನ್ನು ಕಲಿಯಿರಿ.
ಇದು Technical Analysis ನ ಮೊದಲ ಹೆಜ್ಜೆ.
ನಿಮ್ಮ ಡಿಮ್ಯಾಟ್ ಅಕೌಂಟ್ ಮೂಲಕ ನೀವು Buy ಮಾಡಿರುವ ಸ್ಟಾಕ್ ಗಳ Trend 📈📉 ನೋಡಿ.
ಇದು ಅತಿ ಸರಳ.
ಒಂದು ದಿನದ ಅಥವಾ 1 ವಾರದ ಚಾರ್ಟ್ ಹಾಕಿಕೊಂಡು ಬಹಳ ಸರಳವಾಗಿ ಒಟ್ಟಾರೆ ಟ್ರೆಂಡ್ ನೋಡಿ.
Timeframe-
ನೀವು ಯಾವ ಅವಧಿಯಲ್ಲಿ ಸ್ಟಾಕ್ನ ಚಲನೆಯನ್ನು ನೋಡಲು ಬಯಸುತ್ತೀರಿ ಎಂಬುದನ್ನು ಆಯ್ಕೆ ಮಾಡಿ.
ಚಾರ್ಟ್ ಗಳು ಒಂದು ನಿರ್ದಿಷ್ಟ ಸಮಯದಲ್ಲಿ ನಡೆಯುವ ವ್ಯಾಪಾರ ವಹಿವಾಟು ತೋರಿಸುತ್ತವೆ..
ಇಲ್ಲಿ ಸಮಯ ಅಂದ್ರೆ 1 minute,5 minute,15 minute,30 minute,1 ತಾಸು,1 ದಿನ,1 ವಾರ,1 ತಿಂಗಳು ಒಳಗೊಂಡಿರುತ್ತದೆ..
⏱️-Charts show every move -from 1 min to 1 month!
ಇಲ್ಲಿ ಪ್ರತಿ ನಿರ್ದಿಷ್ಟ ಸಮಯ ಹಲವಾರು data points ಒಳಗೊಂಡಿರುತ್ತದೆ..ಷೇರಿನ ಬೆಲೆ, ಅದರ ಏರಿಕೆ,ಇಳಿಕೆ ಒಳಗೊಂಡಿರುತ್ತದೆ..
Each period consists of several data points, including the opening, high, low, and/or closing prices...
1. ಒಂದು ದಿನದ ಚಾರ್ಟ್ (1 Day Chart): ಸ್ಟಾಕ್ನ ಅಲ್ಪಾವಧಿಯ (Short-term) ಚಲನೆಯನ್ನು ನೋಡಲು.
For Short term trends.
2. ವಾರದ ಚಾರ್ಟ್ (1 Week Chart): ಸ್ಟಾಕ್ನ ಸ್ವಲ್ಪ ದೀರ್ಘಾವಧಿಯ (Medium-term) ಚಲನೆಯನ್ನು ನೋಡಲು.
For Medium to Long term trends.
ಇದು ನೀವು ನೋಡಿದ ಕೂಡಲೇ ಸುಲಭವಾಗಿ ಅರ್ಥ ಆಗುತ್ತೆ.
ಸ್ವಲ್ಪ ದಿನಗಳ ಕಾಲ ಅಭ್ಯಾಸ ಮಾಡಿ.ಇದಕ್ಕೆ ಯಾವುದೇ ರೀತಿಯ Technical Analysis or Fundamental Analysis ಬೇಕಾಗಿಲ್ಲ.
Candlestick ಚಾರ್ಟ್ ಮೂಲಕ ನೋಡಿ.
ಈ ಸರಳವಾದ ಟ್ರೆಂಡ್ ನೋಡುವ ವಿಧಾನವನ್ನು ನೀವು ಕನಿಷ್ಠ ಆರು ತಿಂಗಳ ಕಾಲ ಪ್ರತಿದಿನ ಅಭ್ಯಾಸ ಮಾಡಿ. ಇದು ನಿಮ್ಮ ಕಣ್ಣುಗಳಿಗೆ ಚಾರ್ಟ್ಗಳನ್ನು ಅರ್ಥಮಾಡಿಕೊಳ್ಳಲು ತರಬೇತಿ ನೀಡುತ್ತದೆ.
📊 ಷೇರಿನ Charts ಓದುವುದು ಒಂದು ಕಲೆ..
Charting is a visual language of the market!
ಯಾವುದೇ ಕಂಪನಿಯ ಷೇರಿನ ಬೆಲೆಯನ್ನು ನಾವು Charts ಮೂಲಕ ತಿಳಿದುಕೊಳ್ಳಬಹುದು..
Charting is a visual exercise.
ನೂರಾರು ಕಂಪನಿಯ charts 📈 📉 ಅಭ್ಯಾಸ ಮಾಡುವುದರ ಮೂಲಕ ನೀವು ಟ್ರೇಡಿಂಗ್ & ಹೂಡಿಕೆ ಮಾಡುವುದನ್ನು ಕಲಿಯಬಹುದು..
ಒಂದು ಕಂಪನಿಯಲ್ಲಿ ಆಗುವ ಎಲ್ಲ ಆಗು ಹೋಗುಗಳ ಬಗ್ಗೆ, ಆ ಕಂಪನಿಯಲ್ಲಿ ಆಗುತ್ತಿರುವ ಬದಲಾವಣೆಗಳನ್ನು ನಾವು ಗುರುತಿಸಬಹುದು..
➤ ನೂರಾರು ಚಾರ್ಟ್ಗಳನ್ನು ಅಭ್ಯಾಸ ಮಾಡಿ
➤ ಟ್ರೆಂಡ್, ಬದಲಾವಣೆ, ಬೆಲೆ ಚಲನೆ (Price Action) ಗುರುತಿಸಿ
➤ Technical Analysis ನ ಮೊದಲ ಹೆಜ್ಜೆ ಇದೆ
⏱️ Charts show every move -from 1 min to 1 month!
ಇದು ಅತ್ಯಂತ ಸರಳವಾದ ವಿಧಾನ.. ಓಮ್ಮೆ ಪ್ರಯತ್ನಿಸಿ..
Keep Trading and Investment very Simple.
ಇದು ಎಲ್ಲರಿಗೂ ತಲುಪಲಿ..
Like, Share, and Retweet! 🔁💬❤️
#StockMarket #TechnicalAnalysis #KannadaInvestors #ChartStudy
Feb 21

✅Start watching and reading simple plain Charts of Stocks and Indices.
✅Don't use any indicators, don't focus on candlestick patterns.
Simple plain Charts.
✅Start a habit of tracking 50 charts on Daily Basis.
I guarantee you will learn a lot of things.
Simple but very effective strategy.
Keep it simple.
Less is more in the Stock Market.
3
3
29
1,049


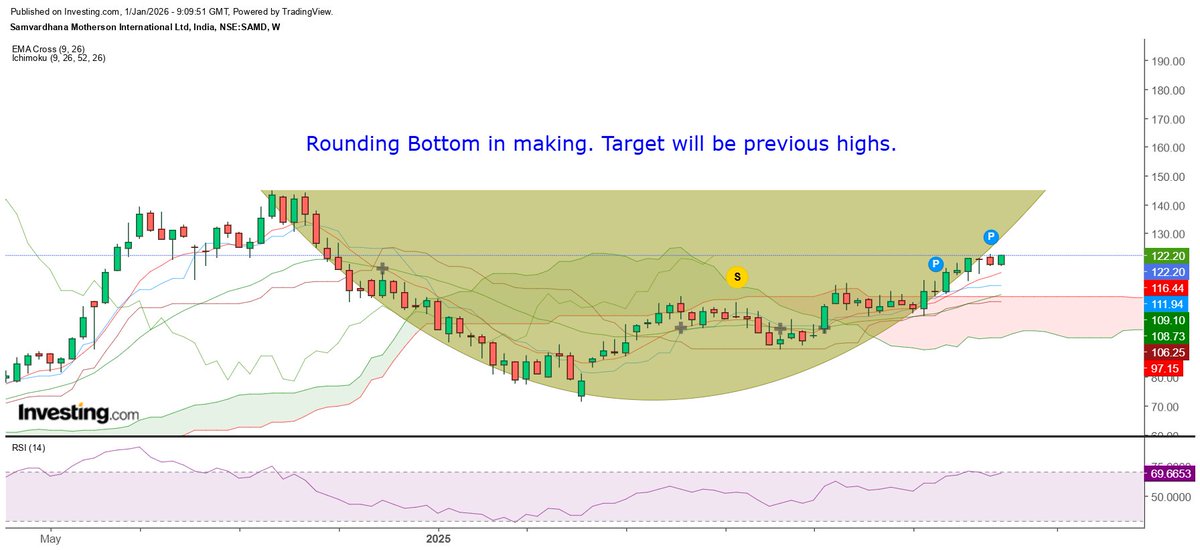
#StockMarketIndia #TechnicalAnalysis #motherson #SMCL #RoundingBottom #StockToWatch Towards completing rounding bottom. Have a look at chart. #ChartStudy
2,336
12 Dec 2025
✅ನೀವು ಸ್ಟಾಕ್ ಮಾರ್ಕೆಟ್ ಅಲ್ಲಿ ಹಣ ಹೂಡಿಕೆ ಮಾಡಿದ್ದರೆ ಚಾರ್ಟ್ ಗಳನ್ನು ನೋಡುವುದನ್ನು ಕಲಿಯಿರಿ.
ಇದು Technical Analysis ನ ಮೊದಲ ಹೆಜ್ಜೆ.
ನಿಮ್ಮ ಡಿಮ್ಯಾಟ್ ಅಕೌಂಟ್ ಮೂಲಕ ನೀವು Buy ಮಾಡಿರುವ ಸ್ಟಾಕ್ ಗಳ Trend 📈📉 ನೋಡಿ.
ಇದು ಅತಿ ಸರಳ.
ಒಂದು ದಿನದ ಅಥವಾ 1 ವಾರದ ಚಾರ್ಟ್ ಹಾಕಿಕೊಂಡು ಬಹಳ ಸರಳವಾಗಿ ಒಟ್ಟಾರೆ ಟ್ರೆಂಡ್ ನೋಡಿ.
Timeframe-
ನೀವು ಯಾವ ಅವಧಿಯಲ್ಲಿ ಸ್ಟಾಕ್ನ ಚಲನೆಯನ್ನು ನೋಡಲು ಬಯಸುತ್ತೀರಿ ಎಂಬುದನ್ನು ಆಯ್ಕೆ ಮಾಡಿ.
ಚಾರ್ಟ್ ಗಳು ಒಂದು ನಿರ್ದಿಷ್ಟ ಸಮಯದಲ್ಲಿ ನಡೆಯುವ ವ್ಯಾಪಾರ ವಹಿವಾಟು ತೋರಿಸುತ್ತವೆ..
ಇಲ್ಲಿ ಸಮಯ ಅಂದ್ರೆ 1 minute,5 minute,15 minute,30 minute,1 ತಾಸು,1 ದಿನ,1 ವಾರ,1 ತಿಂಗಳು ಒಳಗೊಂಡಿರುತ್ತದೆ..
⏱️-Charts show every move -from 1 min to 1 month!
ಇಲ್ಲಿ ಪ್ರತಿ ನಿರ್ದಿಷ್ಟ ಸಮಯ ಹಲವಾರು data points ಒಳಗೊಂಡಿರುತ್ತದೆ..ಷೇರಿನ ಬೆಲೆ,ಅದರ ಏರಿಕೆ,ಇಳಿಕೆ ಒಳಗೊಂಡಿರುತ್ತದೆ..
Each period consists of several data points, including the opening, high, low, and/or closing prices...
1. ಒಂದು ದಿನದ ಚಾರ್ಟ್ (1 Day Chart): ಸ್ಟಾಕ್ನ ಅಲ್ಪಾವಧಿಯ (Short-term) ಚಲನೆಯನ್ನು ನೋಡಲು.
For Short term trends.
2. ವಾರದ ಚಾರ್ಟ್ (1 Week Chart): ಸ್ಟಾಕ್ನ ಸ್ವಲ್ಪ ದೀರ್ಘಾವಧಿಯ (Medium-term) ಚಲನೆಯನ್ನು ನೋಡಲು.
For Medium to Long term trends.
ಇದು ನೀವು ನೋಡಿದ ಕೂಡಲೇ ಸುಲಭವಾಗಿ ಅರ್ಥ ಆಗುತ್ತೆ.
ಸ್ವಲ್ಪ ದಿನಗಳ ಕಾಲ ಅಭ್ಯಾಸ ಮಾಡಿ.ಇದಕ್ಕೆ ಯಾವುದೇ ರೀತಿಯ Technical Analysis or Fundamental Analysis ಬೇಕಾಗಿಲ್ಲ.
Candlestick ಚಾರ್ಟ್ ಮೂಲಕ ನೋಡಿ.
ಈ ಸರಳವಾದ ಟ್ರೆಂಡ್ ನೋಡುವ ವಿಧಾನವನ್ನು ನೀವು ಕನಿಷ್ಠ ಆರು ತಿಂಗಳ ಕಾಲ ಪ್ರತಿದಿನ ಅಭ್ಯಾಸ ಮಾಡಿ. ಇದು ನಿಮ್ಮ ಕಣ್ಣುಗಳಿಗೆ ಚಾರ್ಟ್ಗಳನ್ನು ಅರ್ಥಮಾಡಿಕೊಳ್ಳಲು ತರಬೇತಿ ನೀಡುತ್ತದೆ.
📊 ಷೇರಿನ Charts ಓದುವುದು ಒಂದು ಕಲೆ..
Charting is a visual language of the market!
ಯಾವುದೇ ಕಂಪನಿಯ ಷೇರಿನ ಬೆಲೆಯನ್ನು ನಾವು Charts ಮೂಲಕ ತಿಳಿದುಕೊಳ್ಳಬಹುದು..
Charting is a visual exercise.
ನೂರಾರು ಕಂಪನಿಯ charts 📈 📉 ಅಭ್ಯಾಸ ಮಾಡುವುದರ ಮೂಲಕ ನೀವು ಟ್ರೇಡಿಂಗ್ & ಹೂಡಿಕೆ ಮಾಡುವುದನ್ನು ಕಲಿಯಬಹುದು.
ಒಂದು ಕಂಪನಿಯಲ್ಲಿ ಆಗುವ ಎಲ್ಲ ಆಗು ಹೋಗುಗಳ ಬಗ್ಗೆ, ಆ ಕಂಪನಿಯಲ್ಲಿ ಆಗುತ್ತಿರುವ ಬದಲಾವಣೆಗಳನ್ನು ನಾವು ಗುರುತಿಸಬಹುದು..
➤ ನೂರಾರು ಚಾರ್ಟ್ಗಳನ್ನು ಅಭ್ಯಾಸ ಮಾಡಿ
➤ ಟ್ರೆಂಡ್, ಬದಲಾವಣೆ, ಬೆಲೆ ಚಲನೆ (Price Action) ಗುರುತಿಸಿ
➤ Technical Analysis ನ ಮೊದಲ ಹೆಜ್ಜೆ ಇದೆ.
⏱️ Charts show every move -from 1 min to 1 month!
ಇದು ಅಂತ್ಯಂತ ಸರಳವಾದ ವಿಧಾನ.. ಓಮ್ಮೆ ಪ್ರಯತ್ನಿಸಿ..
Keep Trading and Investment very Simple.
ಇದು ಎಲ್ಲರಿಗೂ ತಲುಪಲಿ..
Like, Share, and Retweet! 🔁💬❤️
#StockMarket #TechnicalAnalysis #KannadaInvestors #ChartStudy


3
6
35
3,213

1 Dec 2025
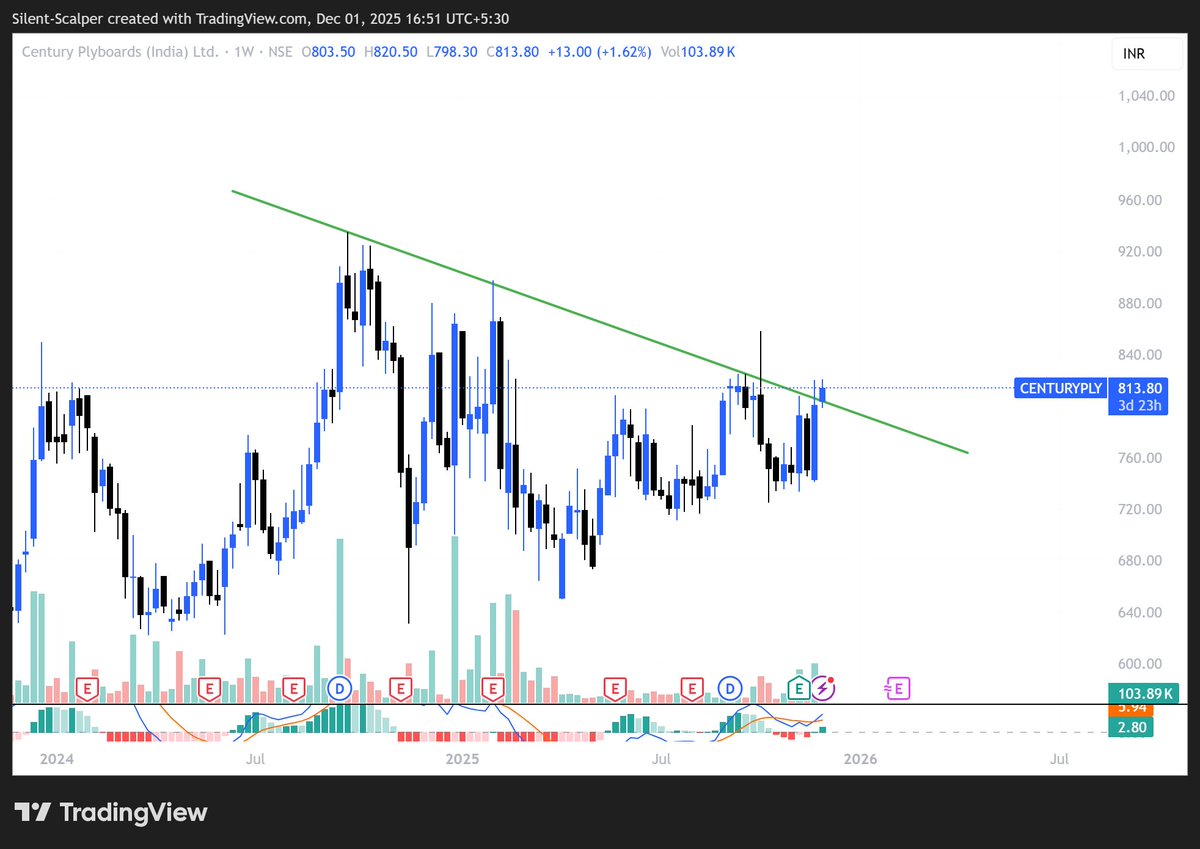
CENTURYPLY $CENTURYPLY
1) Price approaching a long-term descending trendline on the weekly chart.
Study the chart.
Disclaimer: For educational purpose only.
#CENTURYPLY #TechnicalAnalysis #PriceAction #NSE #ChartStudy
2
25

23 Nov 2025
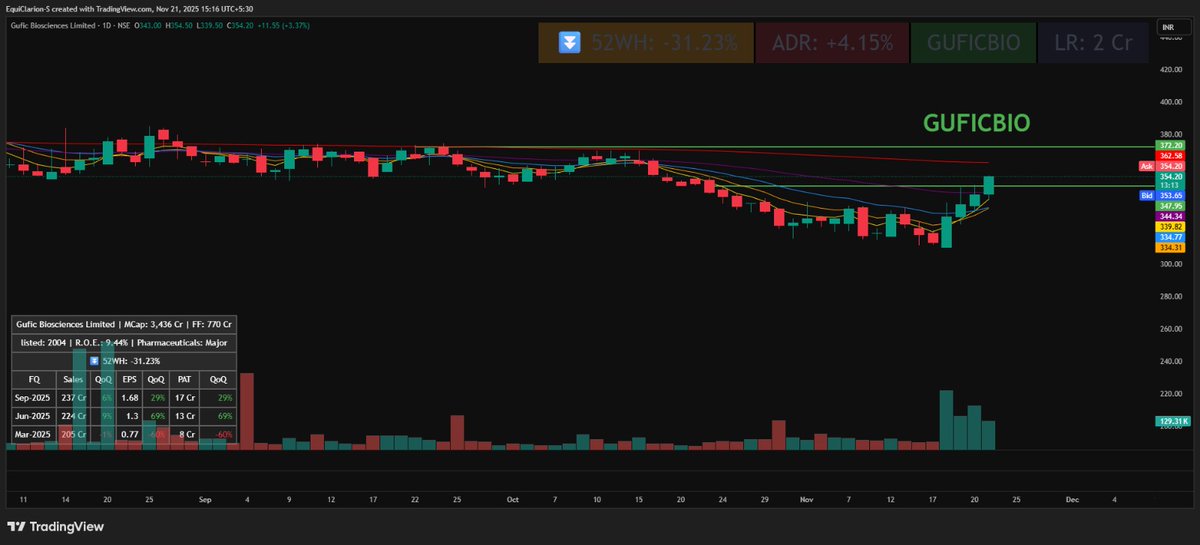
Gufic Biosciences (GUFICBIO) showing strong momentum with a clean breakout attempt after prolonged consolidation. Price reclaiming key EMAs with improving volume is a positive signal.
Watching for sustained closing above the resistance zone for trend continuation. 📈
#GUFICBIO #StockMarketIndia #NSE #TechnicalAnalysis #BreakoutStocks #PriceAction #TradingView #SwingTrading #BTST #PharmaStocks #MarketAnalysis #IndianStocks #ChartStudy #VolumeAnalysis #TrendReversal
2
418

18 Nov 2025
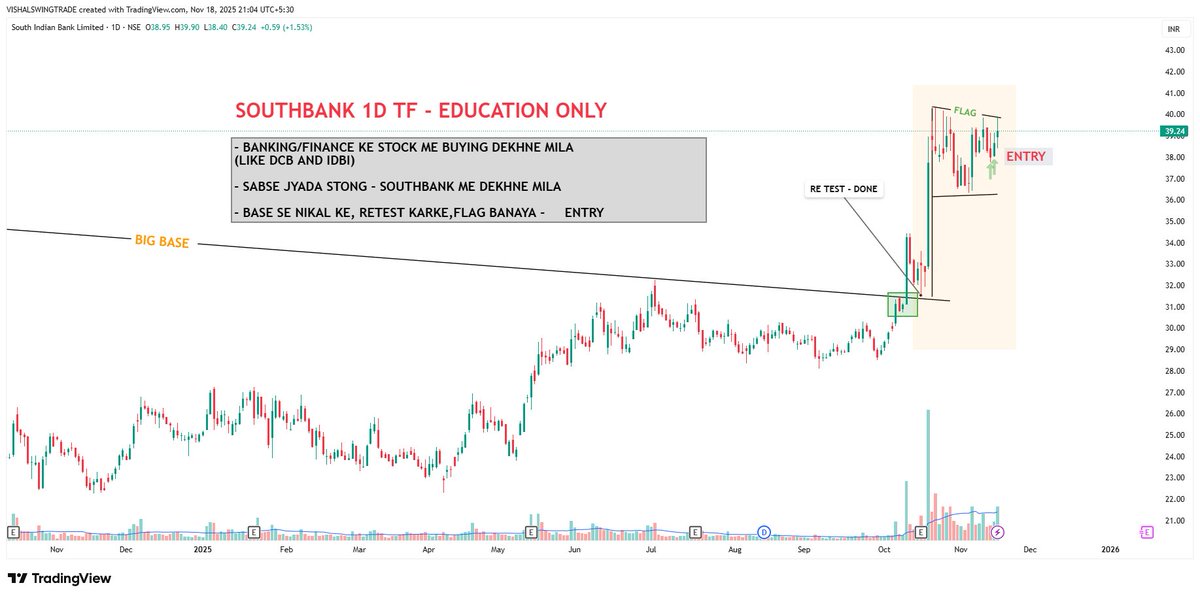
📊 SOUTHBANK 1D TF – EDUCATION ONLY
🔸 Sector Strength Visible
Banking/Finance stocks me buying dikh rahi thi (DCB, IDBI type moves).
Sector strong = individual stocks me momentum.
🔸 Strongest Name: SouthBank
Price action ne clearly strength show ki — base se clean breakout.
🔸 BIG BASE → BREAKOUT → RETEST
Stock bade base se nikla, retest kiya, buyers active mile.
🔸 FLAG PATTERN FORMATION = ENTRY ZONE
Breakout ke baad price ne ek perfect bullish flag banaya —
yehi high-probability entry area hota hai.
#PriceAction #TechnicalAnalysis #BreakoutTrading #FlagPattern #RetestTrade #BankingStocks #SectorStrength #ChartStudy #SwingTrading #StockMarketEducation #SouthBank #TradingInsights #LearnTrading #PriceActionTrading #NSEStocks #TraderCommunity #MarketEducation #CandlestickAnalysis
3
774
18 Nov 2025
📊 MAZAGON DOCK – PRICE ACTION EDUCATION (FOR EDUCATION)
🔸 BIG BASE TIGHTNESS
Stock ne lambe time tak ek tight range me base banaya — strong buildup.
🔸 V-SHAPE RECOVERY
Niche se sharp reversal… buyers ka clean dominance.
🔸 SPEED DOWN → SPEED UP = BIG MOVE
Jab stock tezi se niche jaake utni hi tezi se recover karta hai,
trend continuation ka high probability setup banta hai.
🔸 BASE BREAKOUT → ~34% MOVE
Strong breakout volume = momentum confirmation.
🔸 DESCENDING TRENDLINE BREAK
Long-term trendline breakout ne rally ko fuel diya.
#PriceAction #ChartReading #BreakoutTrading #TechnicalAnalysis #StockMarketEducation #VShapeRecovery #BaseTightness #TrendlineBreakout #SwingTrading #TradingSetups #NSEStocks #MazagonDock #TraderCommunity #LearnToTrade #ChartStudy #PriceActionTrading #MarketEducation #CandlestickAnalysis #StockMarketIndia #TradingInsights
1
4
352

13 Nov 2025
4. Hindustan Zinc (HINDZINC.NS)
12-week Cup & Handle pattern as zinc prices hit multi-year highs.
Cup depth 28% (~₹140)
Handle drift 12%
Breakout above ₹480 on 1.8× volume.
Pattern projection: ~₹580 if momentum continues.
#HindustanZinc #CupandHandle #Metals #ChartStudy
1
2
539

5 Nov 2025
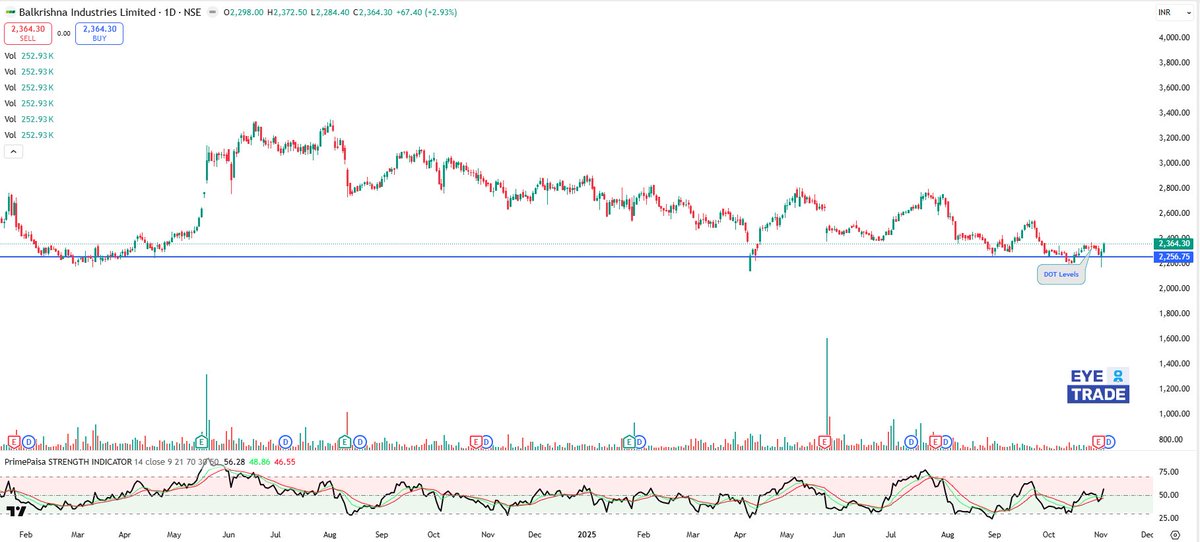
📊 Chart View: Balkrishna Industries Ltd (NSE | Daily)
Price has been hovering near its key horizontal support zone around ₹2,250–₹2,280.
The structure shows multiple bounces from this base level, reflecting price stability and demand absorption.
Momentum indicator (PrimePaisa Strength Indicator) has turned upward near the 55–56 zone, indicating improving strength after a prolonged consolidation phase.
#BalkrishnaIndustries #TechnicalAnalysis #PriceAction #ChartStudy
📢 Important Notice – Please Read Carefully
Dear Members,
As per SEBI guidelines and compliance requirements, please go through our official Social Media Disclaimer & Disclosure available here:
🔗 eyeontrade.com/social-media-…
This document clearly explains the educational intent of our content, risk factors, and our compliance with SEBI Research Analyst norms.
Your understanding of this is essential before acting on any market-related information shared on our platforms.
– Pankaj Jain
SEBI Registered Research Analyst (INH000021386)
🌐 eyeontrade.com
1
2
5
709

24 Oct 2025
🚨 Planning a Live Session this Weekend — Advanced Price Action Session 🐂
I’ll be revealing how I research, plan, and trade using pure price action — no indicators, just clean structure, logic, and execution.
We’ll also dive into live setups, and your personal doubts.
⚡ Access: Only for Twitter Blue Tick (🔵) users — focused group, serious traders only .I would rather prefer to interact with experienced and struggling Price Action Practitioners.
To join 👇
🚀 Follow → [@MintedSwings]
🔁 Repost → spread the word
💭 Comment “Interested” → to confirm your spot
🔷 Blue Tick users → DM me directly for access details 🎯📩
#PriceAction #TradingCommunity #StockMarketIndia #NiftyTrader #BankNifty #PriceActionTrading #TechnicalAnalysis #TraderLife #IntradayTrading #SwingTrading #LearnTrading #MarketDiscussion #SmartMoney #PriceActionStrategy #ChartStudy
49
35
53
14,642

16 Oct 2025
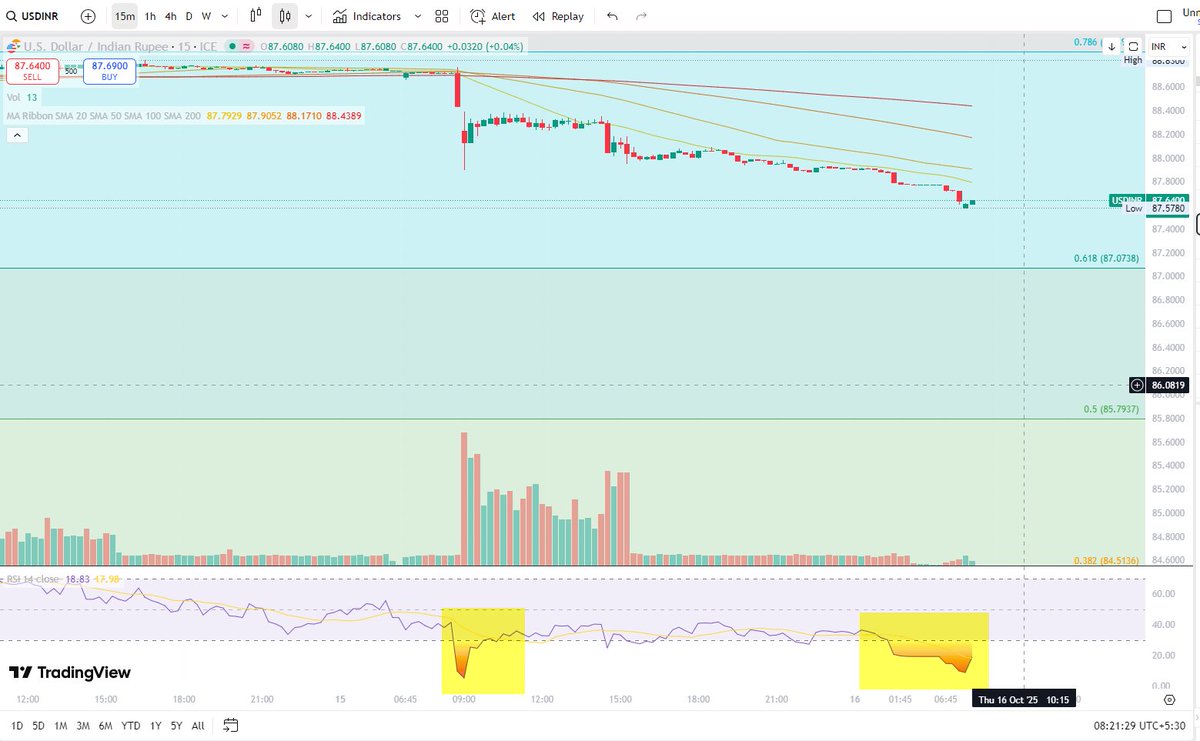
Unusal moves in #Rupee #Dollar.
Highly oversold
RSI : 4 hourly 12 , hourly 13 and 15 minutes 17
Next week, specifically after Diwali will be important to watch.
#Chartstudy
No recommendations for any sort of trades.
3
770

13 Oct 2025
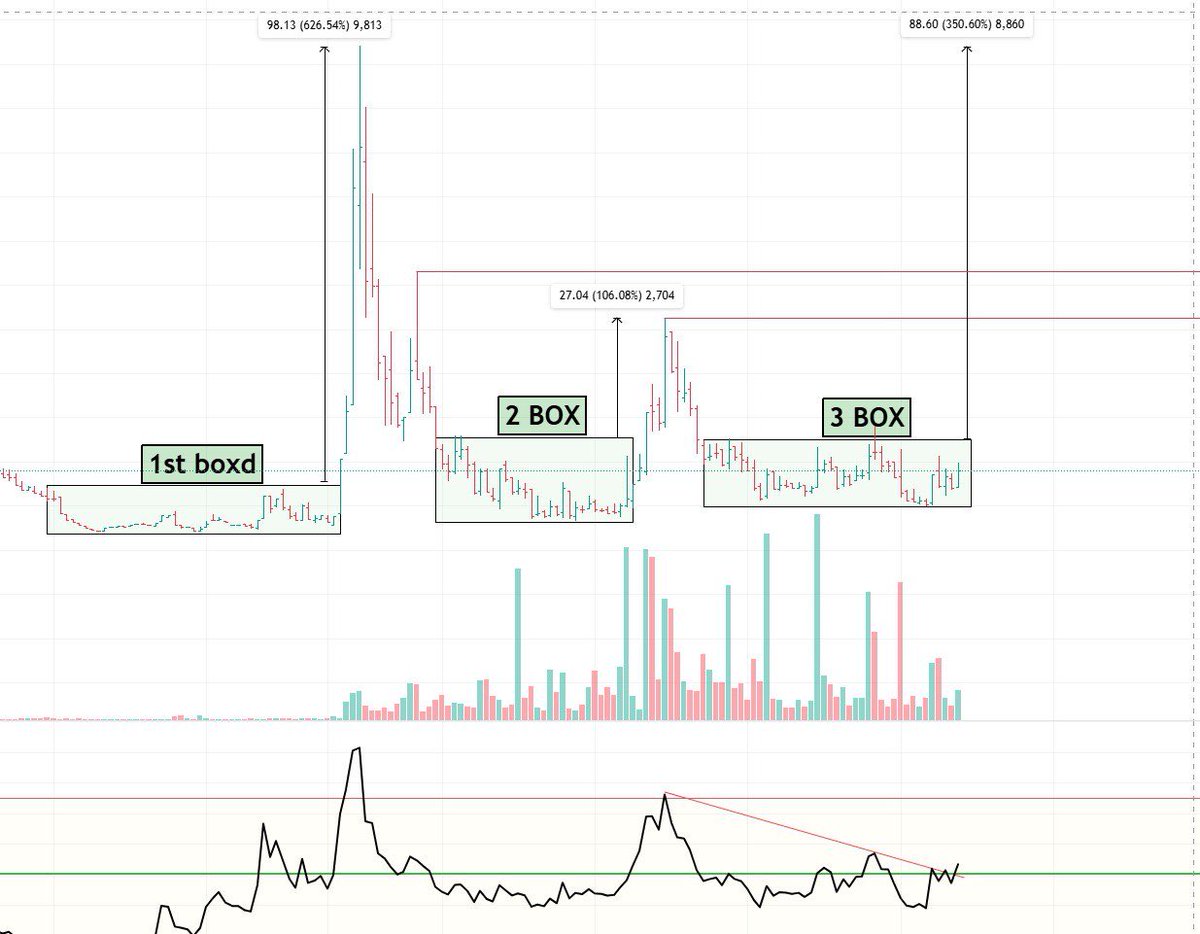
DarvaX Box Potential 3X Candidate Alert 🚀
This stock has shown a repetitive box breakout pattern:
🟩 1st Box ➜ 626% rally 💥
🟨 2nd Box ➜ 106% rally ⚡
🟦 3rd Box ➜ Now forming with strong volume & RSI breakout on the way 📈
But here’s the real game changer👇
🧩 Promoter holding jumped from 35.7% (Dec 2024) ➜ 62.3% (Jun 2025) 💪
Promoters are clearly loading up before the next breakout move 🚀
Everything aligns for a potential 3X upside — pattern volume confidence ✅
💬 Follow 🔔 | Like ❤️ | Comment 💭 | Retweet 🔁
📢 I’ll reveal the stock name in my Telegram channel after 200 Likes & Comments! 🔥
🔱 JAY SHREE MAHAKAL 🔱
#SwingBlaster #3XCandidate #PromoterBuying #TechnicalAnalysis #Breakout #ChartStudy #StockMarket #chart_sab_kuch_bolta_hai #DarvasBoxTrader
72
37
168
11,726
13 Oct 2025
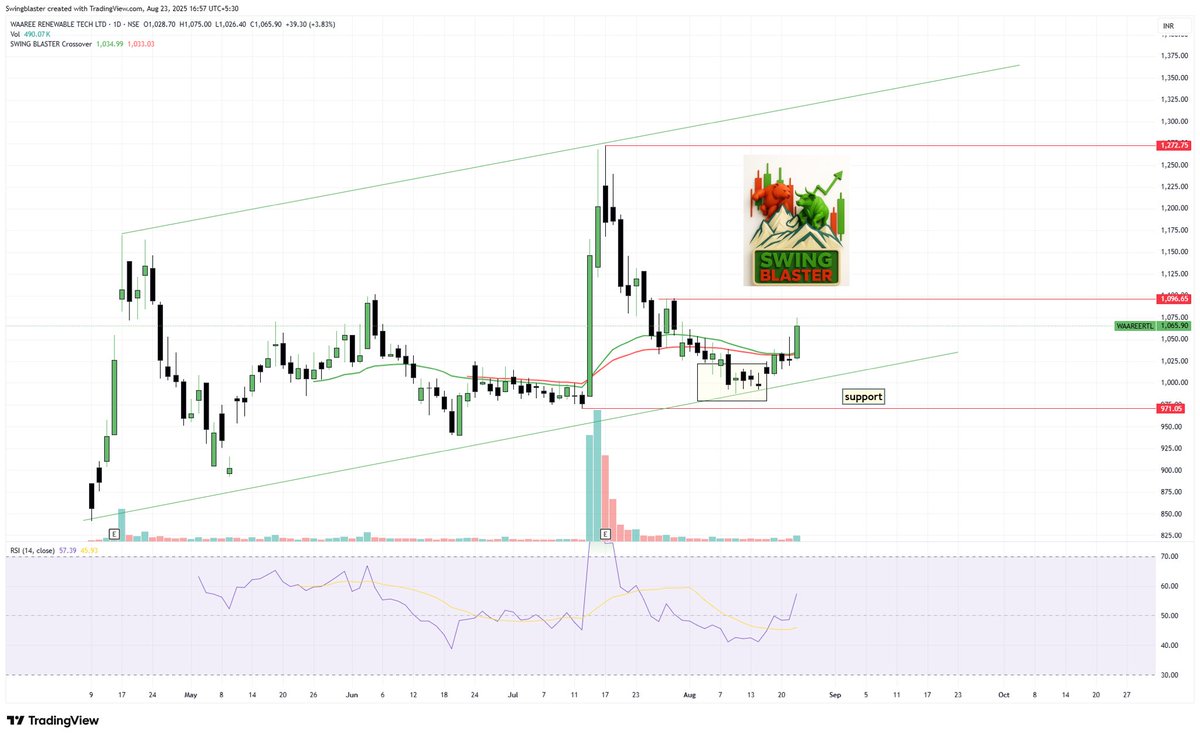
#WAAREERTL Chart Update
Price moved from 1065 ➜ 1275 — that’s a solid 19.7% gain 🔝
After the Swing Blaster Crossover, the stock showed strong momentum — and historically, such setups have led to sharp upside moves 🚀
Long hold view remains intact.
Let’s watch how this breakout unfolds in the coming weeks 🔍
🔱 JAY SHREE MAHAKAL 🔱
#TechnicalAnalysis #SwingBlaster #StockMarket #ChartStudy #chart_sab_kuch_bolta_hai

23 Aug 2025

#WAAREERTL 📈
CMP-1065
On Daily chart Swing blaster crossover = Entry Trigger ON ✅
Swing Blaster Green Signal spotted 💹
Can run sharp from here 💥
GOOD FUNDAMENTALS STOCK ..!
LONG TERM HOLD ..!
Follow me @swing_blaster
#swingblaster
#learnigwithearnig #read_the_chart_win_the_markets #chart_sab_kuch_bolta_hai
🕉️ JAY SHREE MAHAKAL 🕉️
5
2
18
2,443