
27 Sep 2024
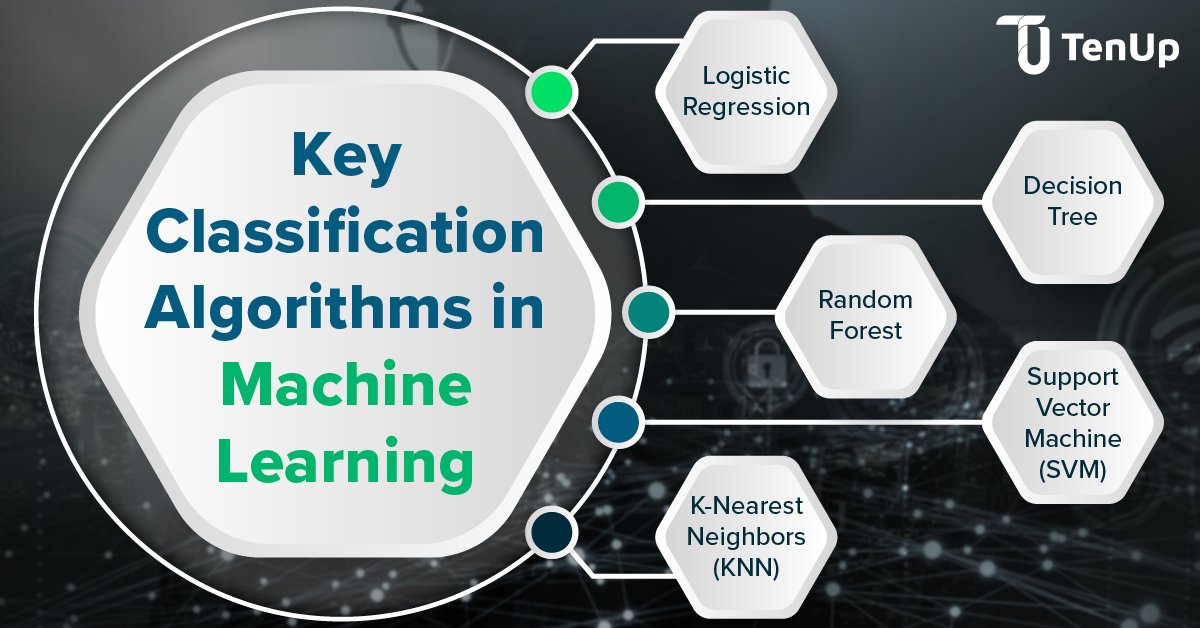
Key #ClassificationAlgorithms in #ML used to categorize data and improve decision-making:
Logistic Regression
Decision Tree
Random Forest
Support Vector Machine (SVM)
K-Nearest Neighbors (KNN)
Contact us to build custom #MLSolutions.
#MLServices #MLDevelopment #MachineLearning
1
50

26 Apr 2022
🚨 Thermoacoustic stability prediction using classification algorithms
Renaud Gaudron & @AimeeMorgans
@ImperialMechEng @ImpEngineering
→ doi.org/10.1017/dce.2022.17
#Thermoacoustics #MachineLearning #ClassificationAlgorithms #Combustors #Combustion #Instabilities #RocketScience
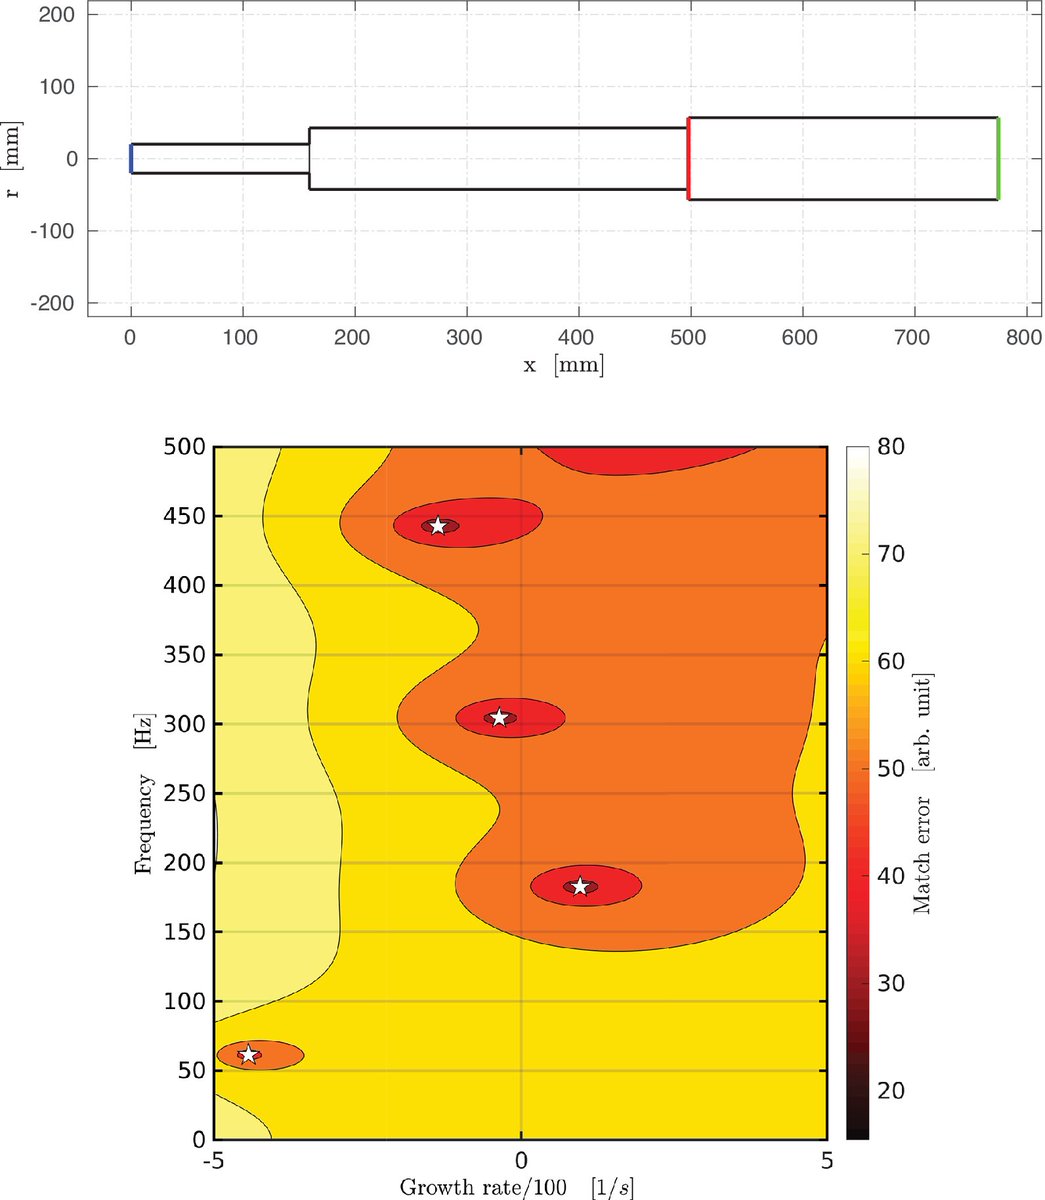
ALT Figure 1. (Top) Randomly generated combustor geometry consisting of three modules with a flow passing through from left to right. The axial locations of the inlet, flame, and outlet are depicted by blue, red, and green vertical lines, respectively. (Bottom) Corresponding map obtained using OSCILOS with n = .875 and τ = 4.90 ms. A white star indicates the presence of a thermoacoustic mode for that frequency and growth rate.
2
9

11 Jan 2021
Running Your First Classifier in Weka: medium.com/ai-in-plain-engli… #MachineLearning #ArtificialIntelligence #DeepLearning #ClassificationAlgorithms #Classification
2
6 Jan 2021
Implementing Random Forest in Python: medium.com/python-in-plain-e… #MachineLearning #ClassificationAlgorithms #RandomForest #ClassificationProblem #Python
6

3 Jan 2021
RT Logistic Regression in Python— A Helpful Guide to How It Works dlvr.it/RppGNf #logisticregression #classificationalgorithms #datascience #python
1
1
13 Nov 2020
RT LOL Match Prediction Using Early Laning Phase Data | Machine Learning dlvr.it/RlZDDX #gaming #classificationalgorithms #dataanalysis #leagueoflegends

2
2

19 Sep 2020
Guess What?
FREE 2-day online masterclass on
19th Sept bit.ly/3mAN1EH &
20th Sept bit.ly/2FrYJAM by Mohit Mathur, a Business & Practice Head at a Multinational IT service company on 'Deep Dive into #ClassificationAlgorithms'.
#ZLF #education

3

18 Sep 2020
Guess What?
FREE 2-day online masterclass on
19th Sept bit.ly/3mAN1EH &
20th Sept bit.ly/2FrYJAM by Mohit Mathur, a Business & Practice Head at a Multinational IT service company on 'Deep Dive into #ClassificationAlgorithms'.
#ZLF #education

2

13 Jul 2020
Classifying Premier League Clubs in FIFA 20 with Decision Tree
youtu.be/l6etd5mUkkY
#ImportData #DataScience #DecisionTree #PremiereLeague #Python #GoogleColab #MachineLearning #ClassificationAlgorithms #수입산데이터 #파이썬 #데이터사이언스 #머신러닝 #머신러닝분류 #피엘
4
1

12 Jul 2020
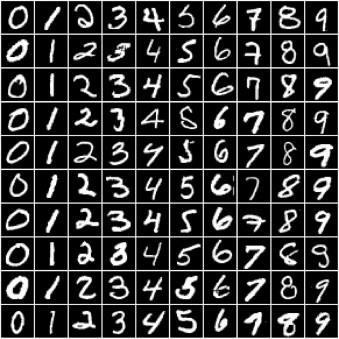
Comparison between Logistic Regression and Neural networks in classifying digits - websystemer.no/comparison-be…
#artificialintelligence #artificialneuralnetwork #classificationalgorithms #logisticregression #machinelearning
1
2
9 Jul 2020
How to Choose the Right Machine Learning Algorithm? - websystemer.no/how-to-choose…
#classificationalgorithms #datascientist #machinelearning #predictions

2
1
28 Jun 2020
Implementation of Logistic Regression without using Built-In library - websystemer.no/implementatio…
#classificationalgorithms #datascience #logisticregression #machinelearning #python

2
25 May 2020
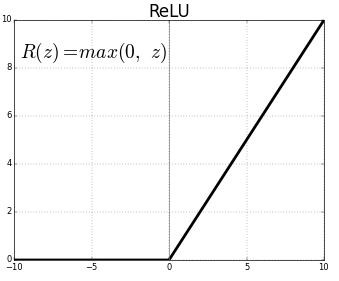
Linearity Vs Non-Linearity in Classifying Data - websystemer.no/linearity-vs-…
#classificationalgorithms #datascience #machinelearning #neuralnetworks #relu
1
2
23 May 2020
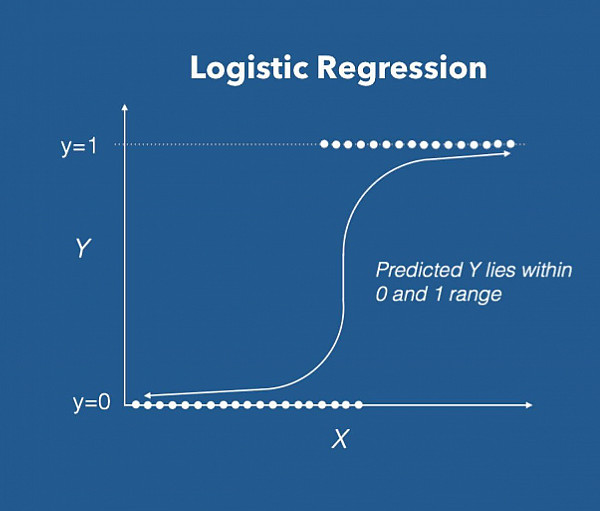
Machine Learning Basics: Logistic Regression (Classification) - websystemer.no/machine-learn…
#classificationalgorithms #jupyternotebook #logisticregression #machinelearning #python3
1
1
18 May 2020
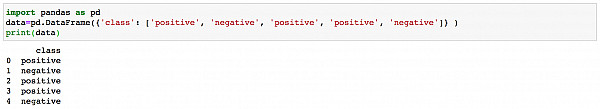
Change the class labels from a string representation into an integer format in Python using map - websystemer.no/change-the-cl…
#classificationalgorithms #datascience #machinelearning #pandas #python

16 May 2020
Support Vector Machine (SVM) in ML is a supervised machine learning model that uses classification algorithms for two-group classification problems.
#SupportVectorMachine #SVM #ML #machinelearning #classificationalgorithms #analyticsjobs
analyticsjobs.in/education/s…
1
1
13 May 2020
Classification A tour of the Classics: Zero_ML - websystemer.no/classificatio…
#classification #classificationalgorithms #classificationmodels #machinelearning
1
2
4 Apr 2020
Multi-Label Classification using Vowpal Wabbit: From Why to How! - websystemer.no/multi-label-c…
#classificationalgorithms #fromwhytohow #machinelearning #multilabel #vowpalwabbit
2
6 Feb 2020
Support Vector Machine (SVM) in ML is a supervised machine learning model that uses classification algorithms for two-group classification problems.
analyticsjobs.in/education/s…
#SupportVectorMachine #SVM #ML #machinelearning #classificationalgorithms #analyticsjobs

3
3
27 Dec 2019
ImageDataGenerator - websystemer.no/imagedatagene…
#classificationalgorithms #imageprocessing #imagedatagenerator #keras #machinelearning
3
1