
Jun 6
People keep asking me where I learn stuff from.
Honestly, YouTube is still one of the best free universities if you follow the right people.
My go-to channels:
DSA
@takeUforward
@KunalKushwaha
@codestorywithmik
System Design
@ByteByteGo
@gkcs
@hnasr
DevOps
@TechWorldwithNana
@AbhishekVeerarma
Backend
@hnasr
@ConceptAndCoding
@TECHSCHOOLGURU
Frontend
@WebDevSimplified
@NetNinja
@traversymedia
Java
@Telusko
DBMS / OS / CN
@GateSmashers
@nesoacademy
Data Engineering
@DataWithDanny
@SeattleDataGuy
@DataTalksClub
Databricks / Spark
@Databricks
@RockTheJVM
Snowflake
@SnowflakeDB
AI / ML
@AndrejKarpathy
@statquest
@deeplearningai
GenAI
@LangChainAI
@Weights_Biases
No course selling.
No affiliate links.
No sponsorship.
Just channels that have genuinely helped thousands of engineers learn and get better.
Drop your favorite ones below. I'm always looking for new gems.
5
18
134
5,318
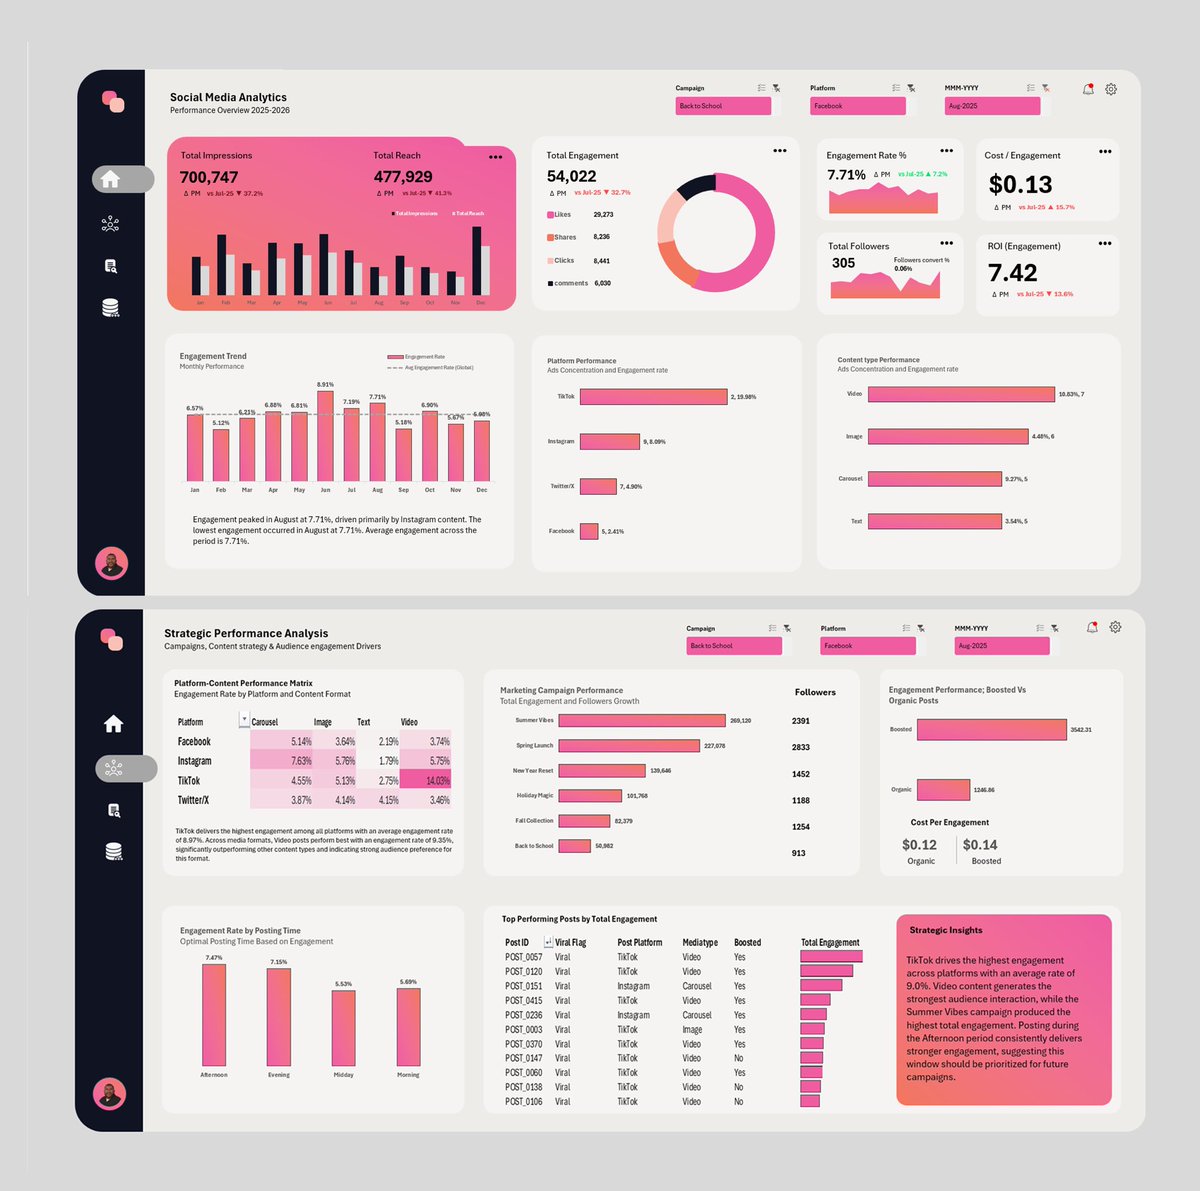
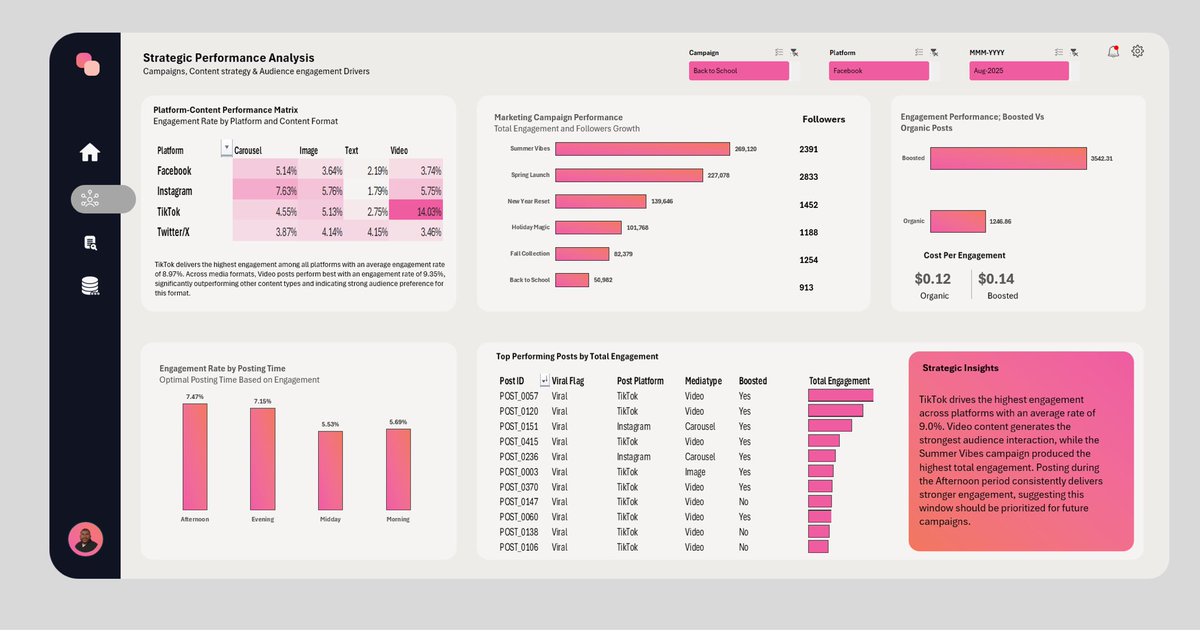
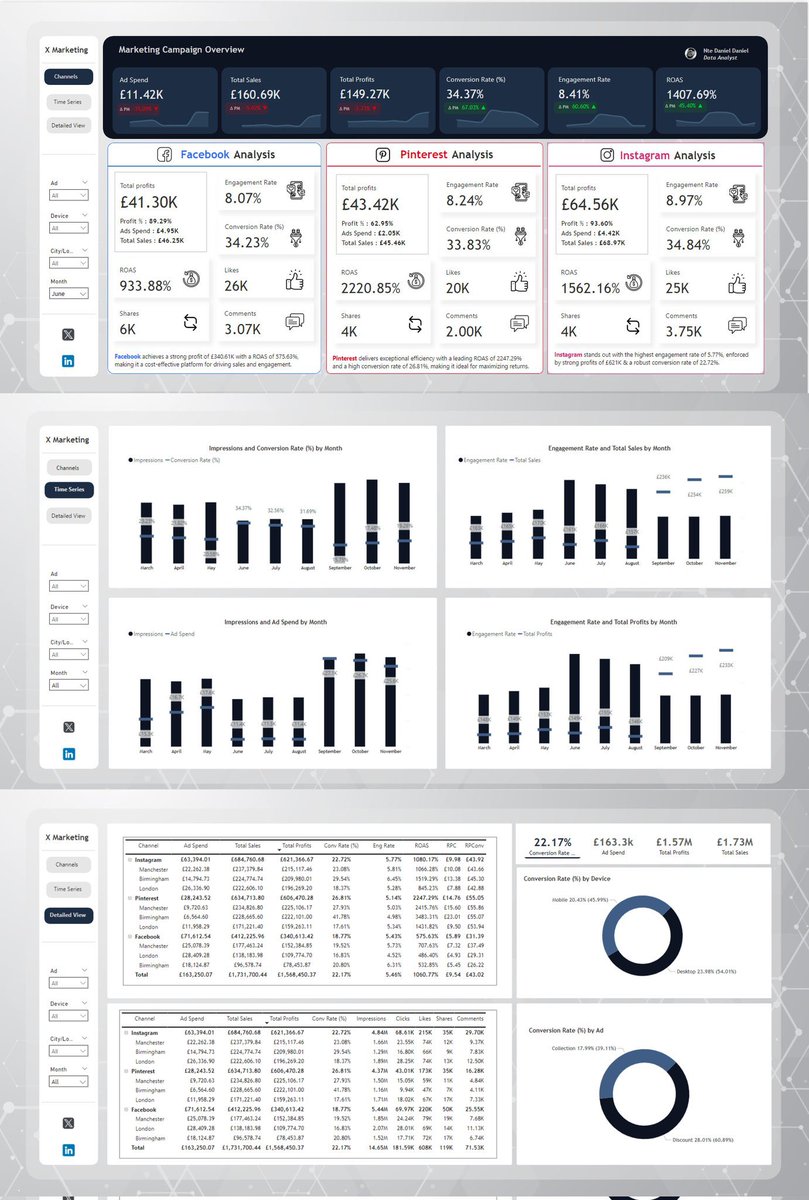
𝟴𝟳𝟬,𝟬𝟬𝟬 𝗲𝗻𝗴𝗮𝗴𝗲𝗺𝗲𝗻𝘁𝘀.
But only 0.11% of viewers became followers.
That’s what I found when analyzing a year of a client’s social media data.
They had posted 450 times and generated 13.2 million impressions.
On the surface, everything looked great.
But when I broke the data down, most of the performance came from just a few patterns.
𝗣𝗹𝗮𝘁𝗳𝗼𝗿𝗺
→ TikTok engagement rate: 8.97%
→ Facebook engagement rate: 3.46%
Yet they were posting equally on both.
𝗙𝗼𝗿𝗺𝗮𝘁
→ Video posts averaged 9.35% engagement
→ Text posts averaged 2.85%
But both were treated the same in the content calendar.
𝗧𝗶𝗺𝗶𝗻𝗴
→ Afternoon posts averaged 7.47% engagement
→ Midday posts averaged 5.53%
Posting times were mostly random.
Same team. Same budget.
Very different results depending on where, what, and when they posted.
But the biggest signal was still that 0.11% follower conversion rate.
People were engaging with the content.
They just weren’t staying.
So the recommendations were straightforward:
→ Focus more effort on TikTok
→ Make video the default format
→ Prioritize afternoon posting
→ Boost posts that are already performing
Small changes. Much better return.
This is the guided project for Cohort 8 of Data with Danny — built entirely in @msexcel . No BI tools. Just clean data and the right questions.
#DataAnalytics #SocialMediaAnalytics #Excel #DataWithDanny #Datafam

14
25
153
4,045

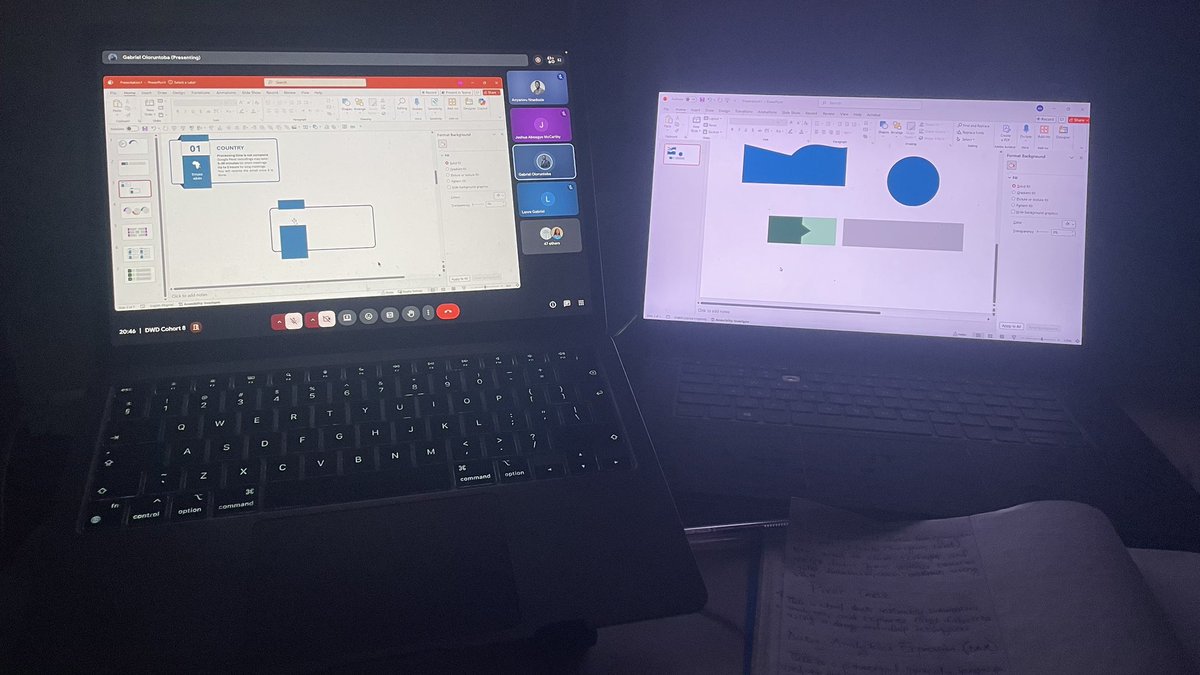
Been a while, I joined @iam_daniiell's live class. Today we talked about PowerPoint presentations. We talked about the CRAP design principle.
I'm so alive whenever anything about design comes up. 🙂
#Cohort8
#DatawithDanny
#DataAnalytics
2
24
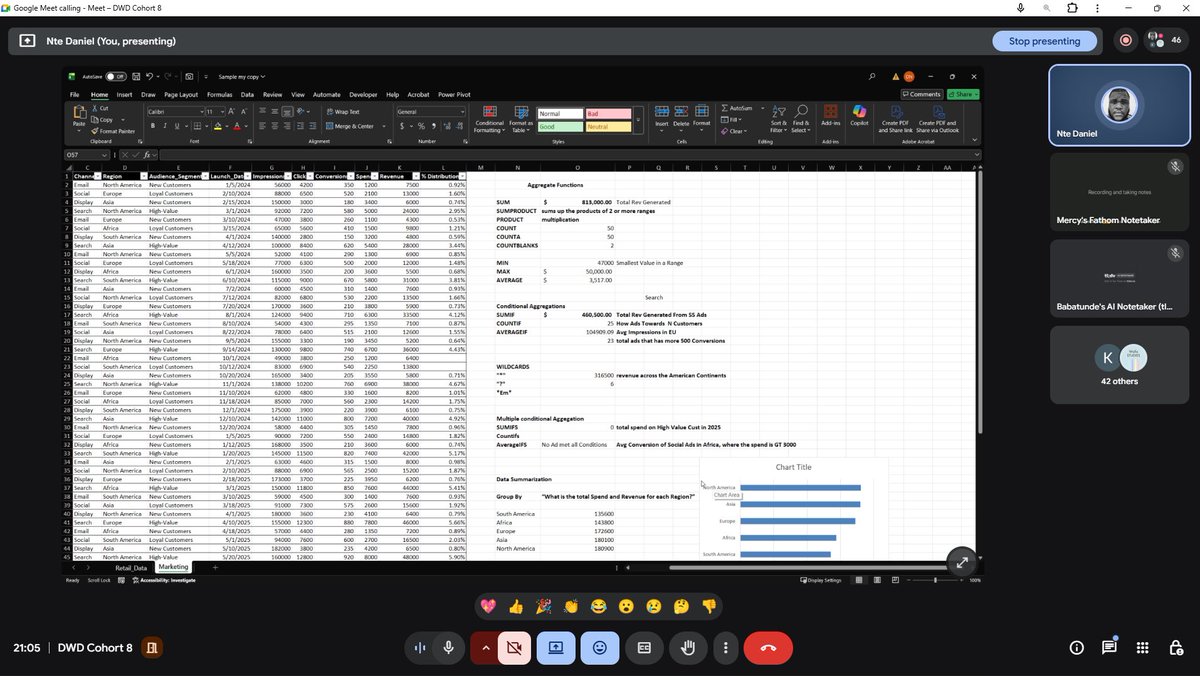
𝗖𝗼𝗵𝗼𝗿𝘁 𝟴 - 𝗔𝗴𝗴𝗿𝗲𝗴𝗮𝘁𝗲 𝗙𝘂𝗻𝗰𝘁𝗶𝗼𝗻𝘀.
Today we dove deep into what actually makes analysts valuable: the ability to summarize data and extract insights.
We covered aggregate functions in Excel. Not just what they do, but WHY they matter.
𝗧𝗵𝗲 𝗕𝗮𝘀𝗶𝗰𝘀:
→ SUM - Total values
→ SUMPRODUCT - Multiplying and summing arrays
→ PRODUCT - Multiplying values
→ COUNT, COUNTA, COUNTBLANK - Counting numbers, non-empty cells, and blanks
→ MIN and MAX - Finding extremes
→ AVERAGE - Central tendency
These aren’t just formulas. They’re how you answer business questions: “What’s our total revenue?” “How many orders did we get?” “What’s the average order value?”
𝗖𝗼𝗻𝗱𝗶𝘁𝗶𝗼𝗻𝗮𝗹 𝗔𝗴𝗴𝗿𝗲𝗴𝗮𝘁𝗶𝗼𝗻𝘀:
Then we moved to the power tools:
→ COUNTIF - Count cells that meet a condition
→ SUMIF - Sum cells that meet a condition
→ SUMIFS - Sum with multiple conditions
This is where you go from “What’s the total?” to “What’s the total for THIS specific segment?”
𝗪𝗶𝗹𝗱𝗰𝗮𝗿𝗱𝘀:
We introduced wildcards (* and ?) for pattern matching.
Now students can count all customers whose names start with “John” or sum all orders containing “Pizza” in the description.
𝗗𝗮𝘁𝗮 𝗦𝘂𝗺𝗺𝗮𝗿𝗶𝘀𝗮𝘁𝗶𝗼𝗻:
Finally, we covered PIVOTBY and GROUPBY - dynamic array functions that let you summarize data without pivot tables.
Students learned how to group sales by region, category, or time period and calculate totals, averages, or counts instantly.
𝗧𝗵𝗲 𝗿𝗲𝘀𝘂𝗹𝘁?
Students went from “I can add numbers in Excel” to “I can analyze datasets and answer specific business questions.”
They’re not just using formulas. They’re thinking like analysts.
This is what happens when you teach concepts, not just syntax.
#DataAnalysis #Excel #DataWithDanny #Datafam
4
39
1,307
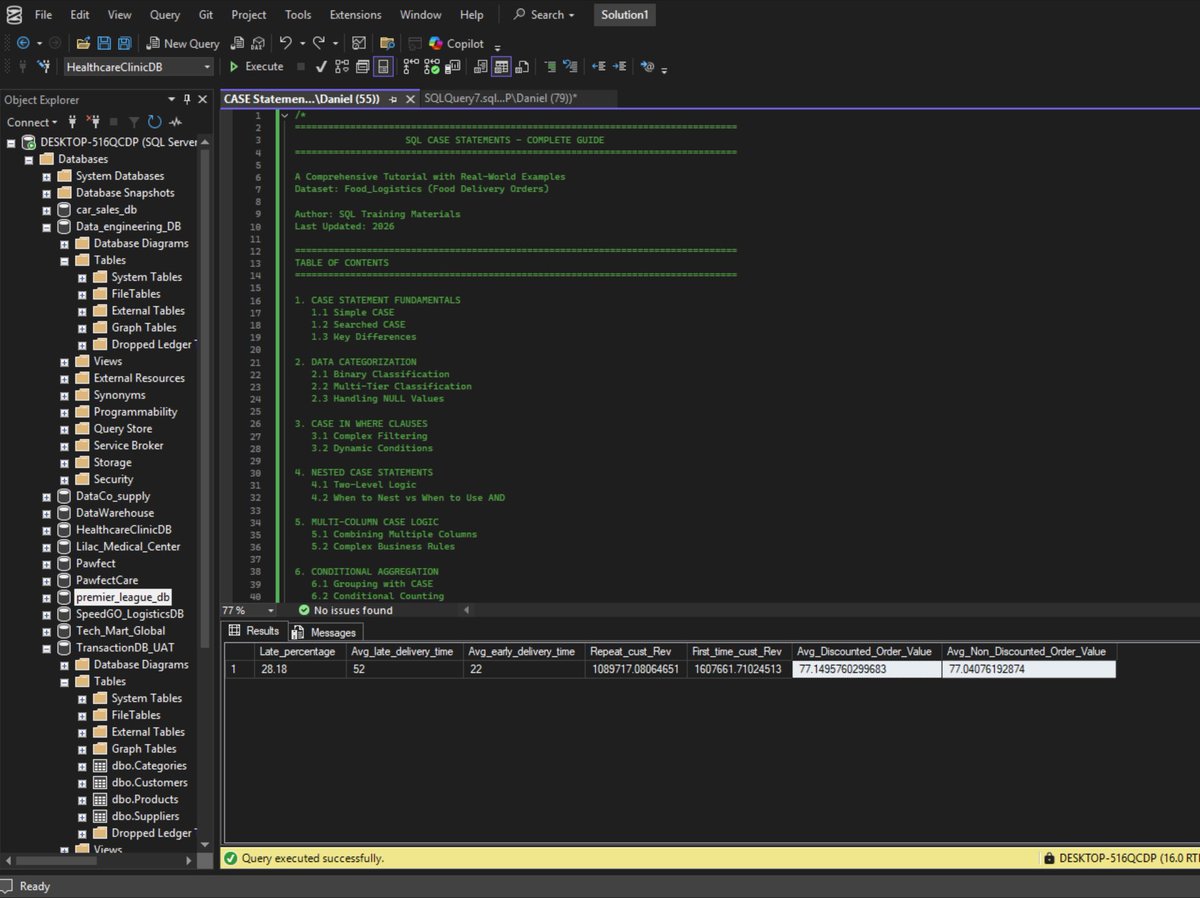
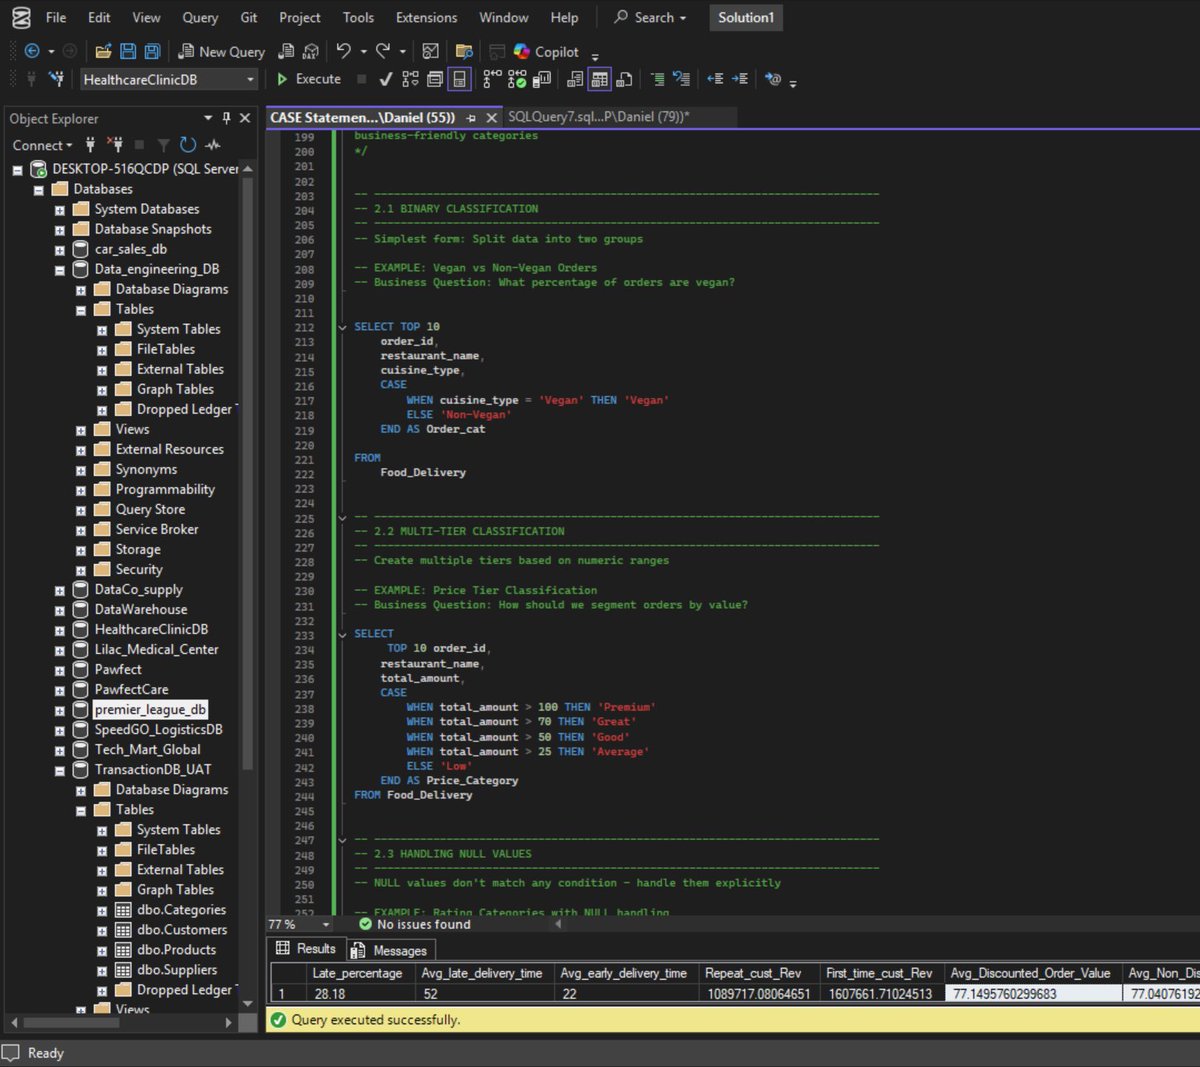
𝗖𝗹𝗮𝘀𝘀 𝟳 & 𝟴 𝘄𝗶𝘁𝗵 𝗖𝗼𝗵𝗼𝗿𝘁 𝟳: 𝗖𝗔𝗦𝗘 𝗦𝘁𝗮𝘁𝗲𝗺𝗲𝗻𝘁𝘀.
Today we covered one of the most powerful tools in SQL: CASE statements.
This is SQL’s IF-THEN-ELSE. It’s what separates analysts who can query data from analysts who can solve business problems.
𝗪𝗵𝗮𝘁 𝘄𝗲 𝗰𝗼𝘃𝗲𝗿𝗲𝗱:
→ Simple CASE vs Searched CASE (and when to use each)
→ Data categorization (turning raw values into business categories)
→ Binary and multi-tier classification
→ Handling NULL values properly
→ Using CASE in WHERE clauses for complex filtering
→ Nested CASE statements (decision trees)
→ Multi-column logic (combining multiple conditions)
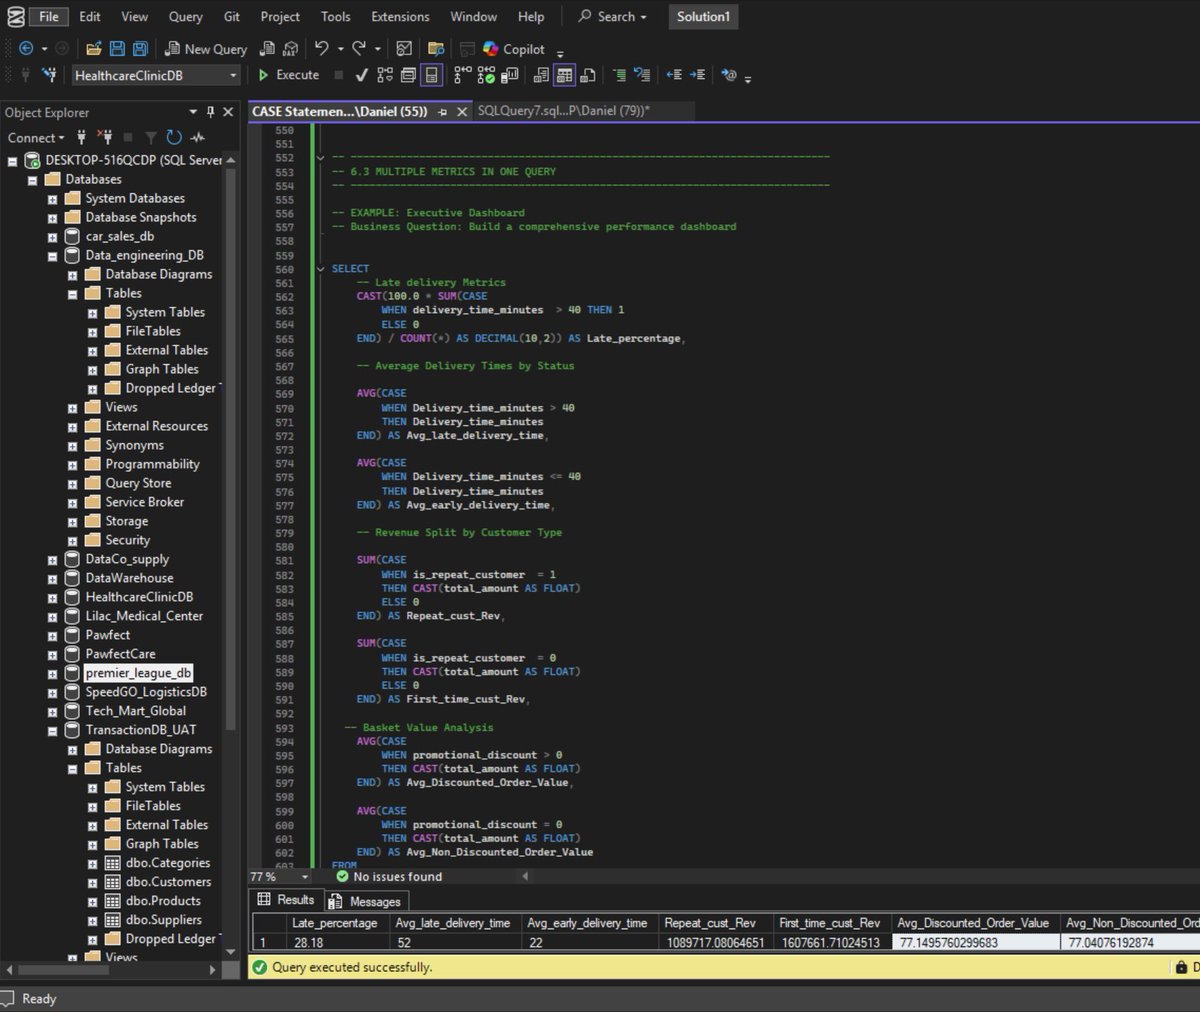
→ Conditional aggregation (the real power move)
→ Building executive dashboards in one query
𝗥𝗲𝗮𝗹-𝘄𝗼𝗿𝗹𝗱 𝗲𝘅𝗮𝗺𝗽𝗹𝗲𝘀:
Students learned how to:
→ Categorize delivery distances (far, moderate, nearby, very close)
→ Calculate late delivery percentages
→ Split revenue by customer type
→ Analyze delivery performance by time slot
→ Build multi-metric dashboards in a single query
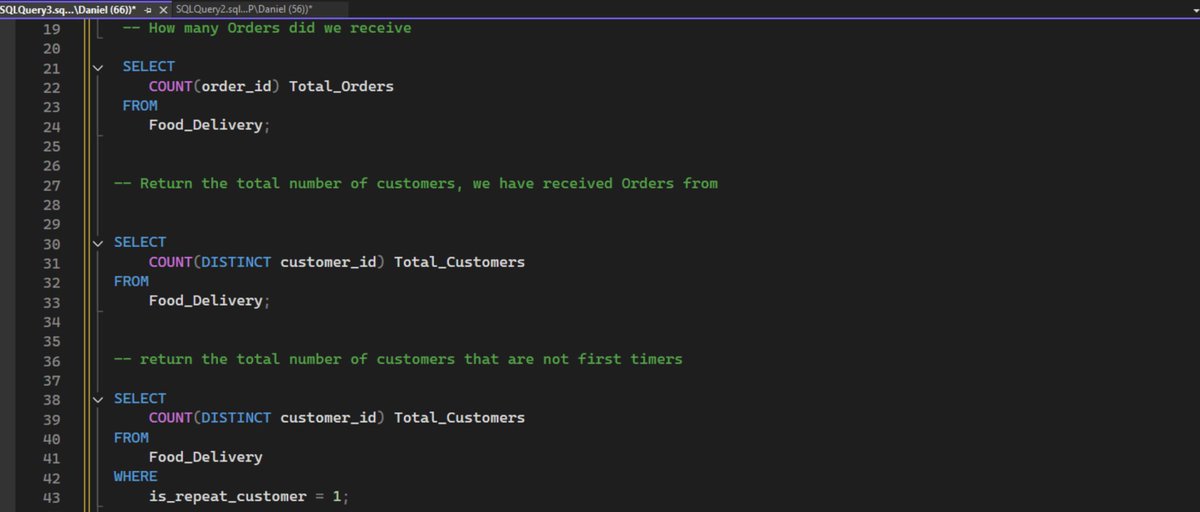
By the end, they were writing queries like this:
SELECT
CAST(100.0 * SUM(CASE
WHEN delivery_time_minutes > 40 THEN 1
ELSE 0
END) / COUNT(*) AS DECIMAL(10,2)) AS Late_percentage,
SUM(CASE
WHEN is_repeat_customer = 1
THEN total_amount
ELSE 0
END) AS Repeat_customer_revenue
FROM Food_Delivery
This is the SQL that actually drives business decisions.
Students who couldn’t write a CASE statement two hours ago are now building conditional logic that answers real business questions.
The growth is insane.
#SQL #DataAnalysis #DataWithDanny #Datafam

2
4
27
1,126
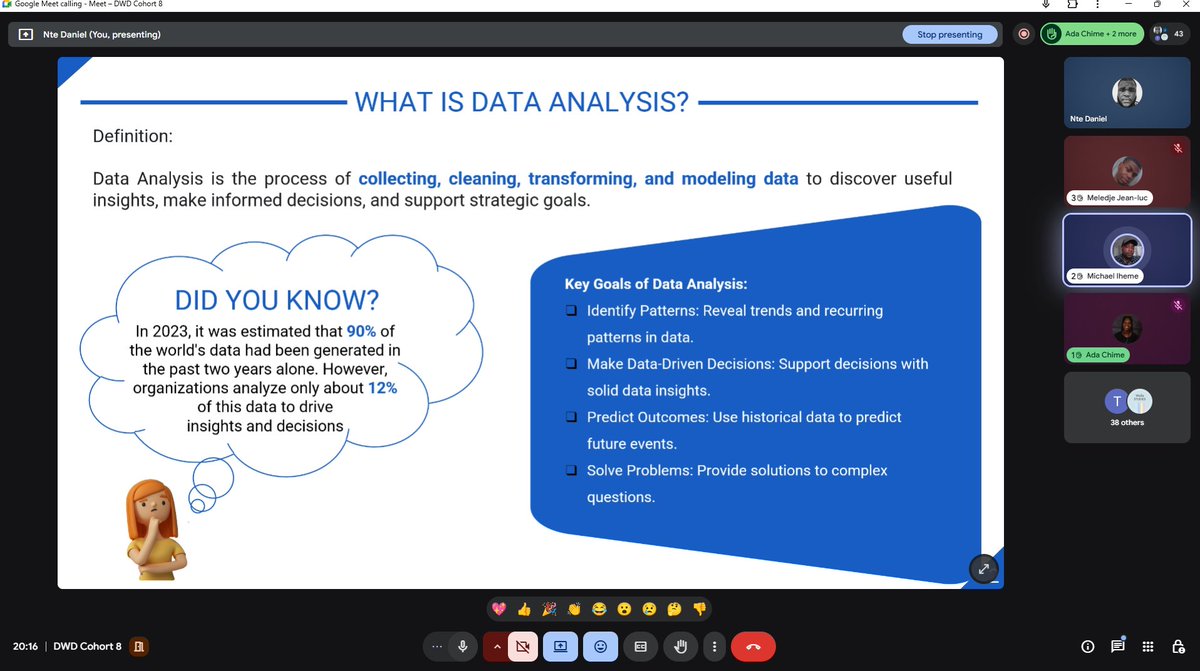
𝗖𝗼𝗵𝗼𝗿𝘁 𝟴 𝗸𝗶𝗰𝗸𝗲𝗱 𝗼𝗳𝗳 𝘁𝗵𝗶𝘀 𝘄𝗲𝗲𝗸𝗲𝗻𝗱.
We didn’t jump straight into tools.
We laid the foundation first.
𝗪𝗵𝗮𝘁 𝘄𝗲 𝗰𝗼𝘃𝗲𝗿𝗲𝗱:
→ What data actually is - types, structure, and sources
→ What data analysis means and what analysts are responsible for
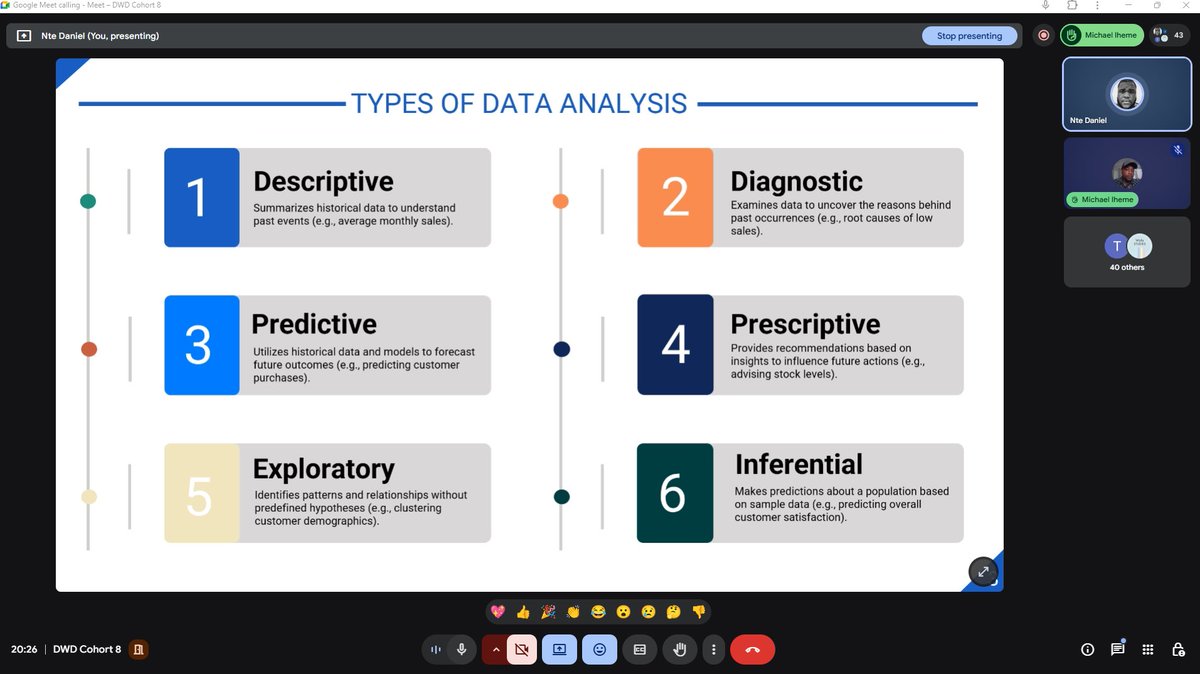
→ The different types of analysis (descriptive, diagnostic, predictive, prescriptive)
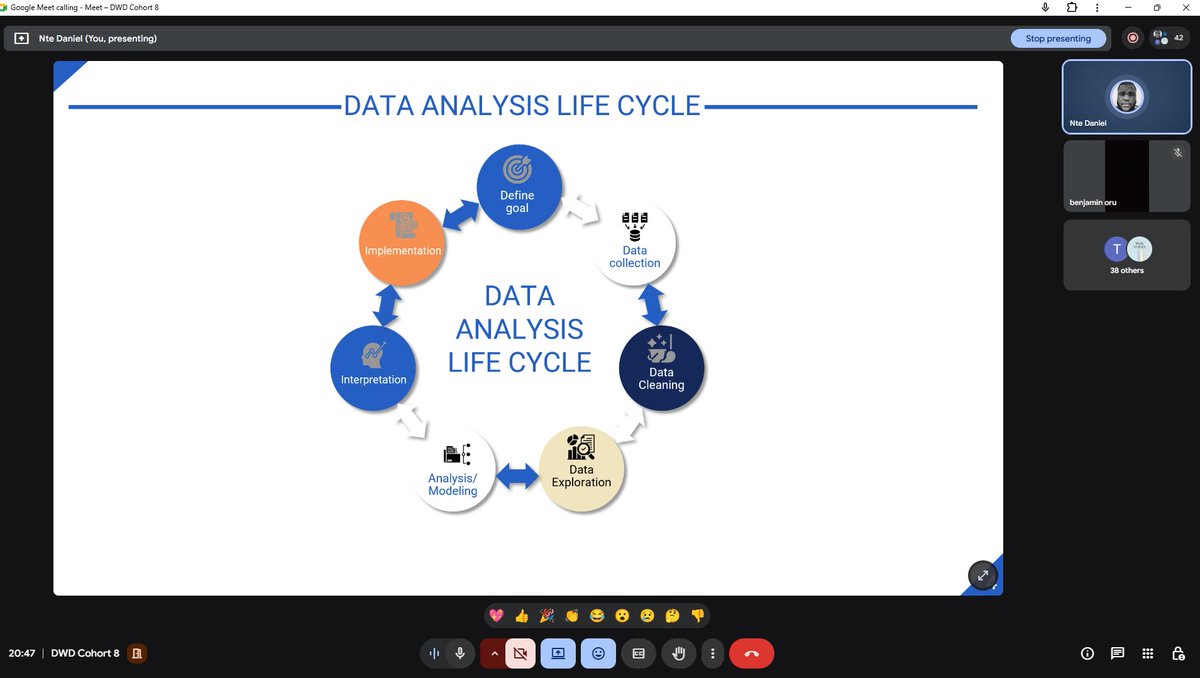
→ The analysis lifecycle - from question to insight
→ Challenges analysts face in the real world
→ The tools you’ll need to solve problems
Then we moved into Excel.
Students learned data handling techniques:
→ Sort and filter
→ Data validation
→ Conditional formatting
Then we introduced functions and formulas.
This is how you build analysts who actually understand what they’re doing, not just people who know how to click buttons.
Foundation first. Tools second.
Excited to watch this cohort grow.
#DataAnalysis #Excel #DataWithDanny #Datafam
1
7
46
1,730
𝗚𝗼𝗼𝗱 𝗺𝗼𝗿𝗻𝗶𝗻𝗴, 𝗲𝘃𝗲𝗿𝘆𝗼𝗻𝗲
We just wrapped up our Excel project presentations with Cohort 7.
Students were grouped to work on real-world Excel projects. But this wasn’t just about formulas and charts.
It was about building the skills that actually matter in the workplace.
𝗪𝗵𝗮𝘁 𝘁𝗵𝗲𝘆 𝗹𝗲𝗮𝗿𝗻𝗲𝗱:
✅ Teamwork & Collaboration
Working together, sharing ideas, and solving problems as a team.
✅ Time Management & Deadlines
Planning tasks, staying organized, and delivering on time.
✅ Presentation Skills
Creating PowerPoint decks and confidently presenting their work to judges.
✅ Product Documentation
Documenting their projects clearly and professionally, just like in real companies.
These projects pushed students beyond technical skills and into professional readiness.
This is what happens when you combine real projects with structure and accountability.
Screenshots of their work below. 👇
Thank you @thegoodanalysts .. for gracing this event.
Which project was your favorite and why?
#DataAnalysis #Excel #DataWithDanny #Datafam

9
16
130
4,270
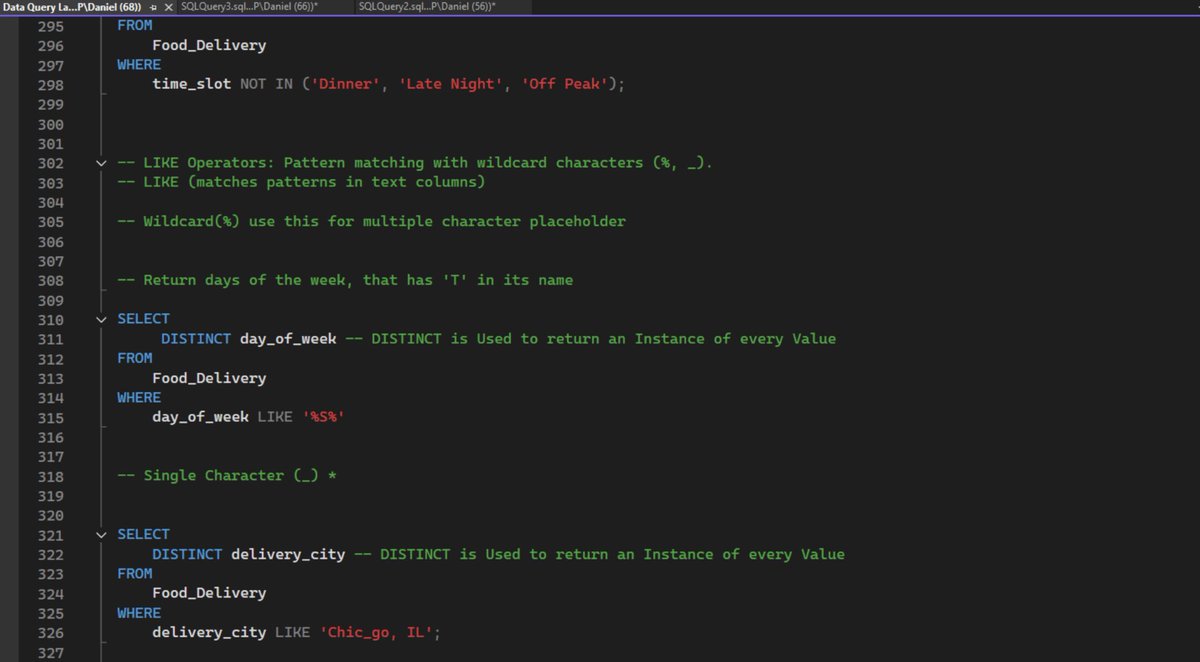
𝗖𝗹𝗮𝘀𝘀 𝟱 & 𝟲 𝘄𝗶𝘁𝗵 𝗖𝗼𝗵𝗼𝗿𝘁 𝟳: 𝗗𝗤𝗟 𝗠𝗮𝘀𝘁𝗲𝗿𝘆.
After teaching students how to design databases (DDL) and populate them (DML), we dove deep into the part everyone actually uses daily: querying data.
DQL - Data Query Language. This is where the magic happens.
𝗢𝗽𝗲𝗿𝗮𝘁𝗼𝗿𝘀
Students learned how to filter and find exactly what they need:
→ Arithmetic operators ( , -, *, /) - calculating discounts, totals, profit margins
→ Comparison operators (=, >, <, >=, <=) - finding patients above a certain age, bills over a threshold
→ Logical operators (AND, OR, NOT) - combining multiple conditions
→ LIKE - searching for patterns in names, emails, addresses
→ IN & BETWEEN - filtering ranges and specific lists
→ IS NULL / IS NOT NULL - finding missing data
This isn’t theory. Students used these to answer real questions: “Show me all patients over 45 with unpaid bills” or “Find all visits scheduled this week in the Cardiology department.”
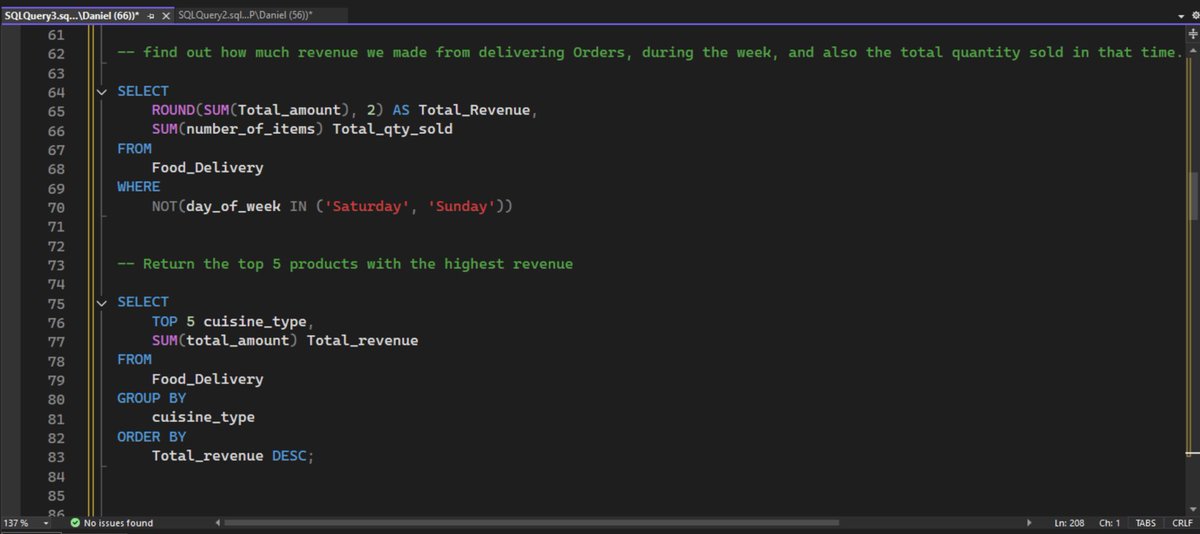
𝗔𝗴𝗴𝗿𝗲𝗴𝗮𝘁𝗲 𝗙𝘂𝗻𝗰𝘁𝗶𝗼𝗻𝘀
Then we moved into summary statistics:
→ SUM - total revenue, total payments
→ AVG - average consultation fee, average bill amount
→ COUNT - number of visits, number of patients
→ MIN & MAX - lowest and highest values
They learned GROUP BY to break down data by categories: “What’s the total revenue per department?” or “How many patients visited each doctor?”
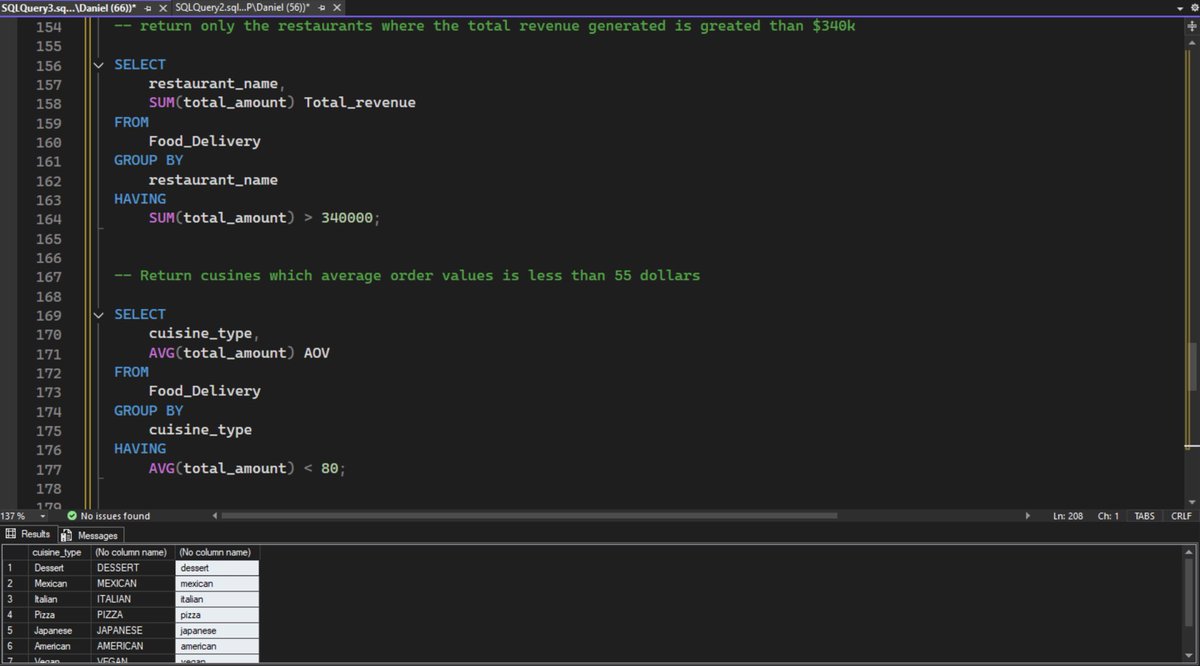
𝗛𝗔𝗩𝗜𝗡𝗚 𝗖𝗹𝗮𝘂𝘀𝗲
WHERE filters rows before grouping.
HAVING filters groups after aggregation.
Students learned when to use each: “Show me departments with more than 5 doctors” or “Which doctors have average consultation fees above ₦30,000?”
This is where beginners usually get stuck. Not anymore.
𝗧𝗲𝘅𝘁 𝗙𝘂𝗻𝗰𝘁𝗶𝗼𝗻𝘀
Finally, we covered string manipulation:
→ CONCAT - combining first and last names
→ UPPER/LOWER - standardizing text
→ TRIM - cleaning up messy data
→ SUBSTRING - extracting parts of text
→ LEN - counting characters
Real-world use: cleaning patient names, formatting phone numbers, extracting area codes.
𝗧𝗵𝗲 𝗿𝗲𝘀𝘂𝗹𝘁?
Students went from “How do I select data?” to writing complex queries that answer actual business questions.
They’re not just running SELECT * anymore.
They’re filtering 20,000 patient records to find exactly what matters.
They’re calculating revenue by department.
They’re identifying trends in visit patterns.
They’re solving real problems.
This is what happens when you combine structure, real projects, and hands-on practice.
Cohort 8 starts this sunday. Last chance to join.
🔗 selar.com/7q7p1y224k
📱 234 911 028 9203
#SQL #DataAnalysis #DataWithDanny #Datafam
1
5
26
1,177
𝗪𝗲’𝗿𝗲 𝗸𝗶𝗰𝗸𝗶𝗻𝗴 𝗼𝗳𝗳 𝘁𝗵𝗶𝘀 𝘄𝗲𝗲𝗸𝗲𝗻𝗱.
Data with Danny - Cohort 8 starts Friday, January 30th.
If you’ve been thinking about it, now’s the time to decide.
This is your last chance to join a structured 4-month program that takes you from complete beginner to job-ready.
Excel • SQL • Python • Power BI • Statistics
✓ 8 portfolio projects
✓ 1-on-1 mentorship
✓ Certificate of completion
✓ Structured learning path
📅 Starts: Friday, January 30th
⏰ Classes: Fri-Sun, 7-9 PM WAT
💰 ₦80,000 | $80
Registration closes soon.
🔗 selar.com/7q7p1y224k
📱 234 911 028 9203
Don’t let another cohort pass you by.
Screenshots of past student projects below 👇
#DataAnalysis #SQL #Python #PowerBI #DataWithDanny #Datafam


10
40
2,592
𝗖𝗹𝗮𝘀𝘀 𝟯 & 𝟰 𝘄𝗶𝘁𝗵 𝗖𝗼𝗵𝗼𝗿𝘁 𝟳: 𝗗𝗠𝗟 𝗠𝗮𝘀𝘁𝗲𝗿𝘆.
Two full sessions. One focus: teaching students how to actually work with data in SQL.
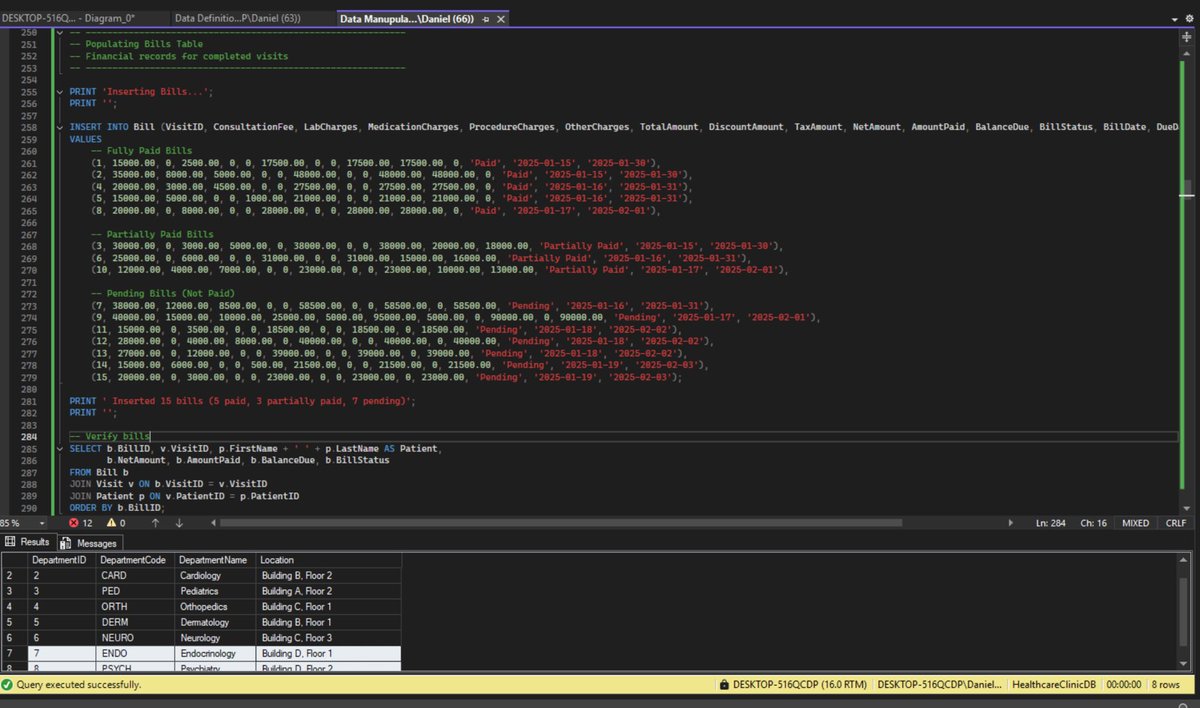
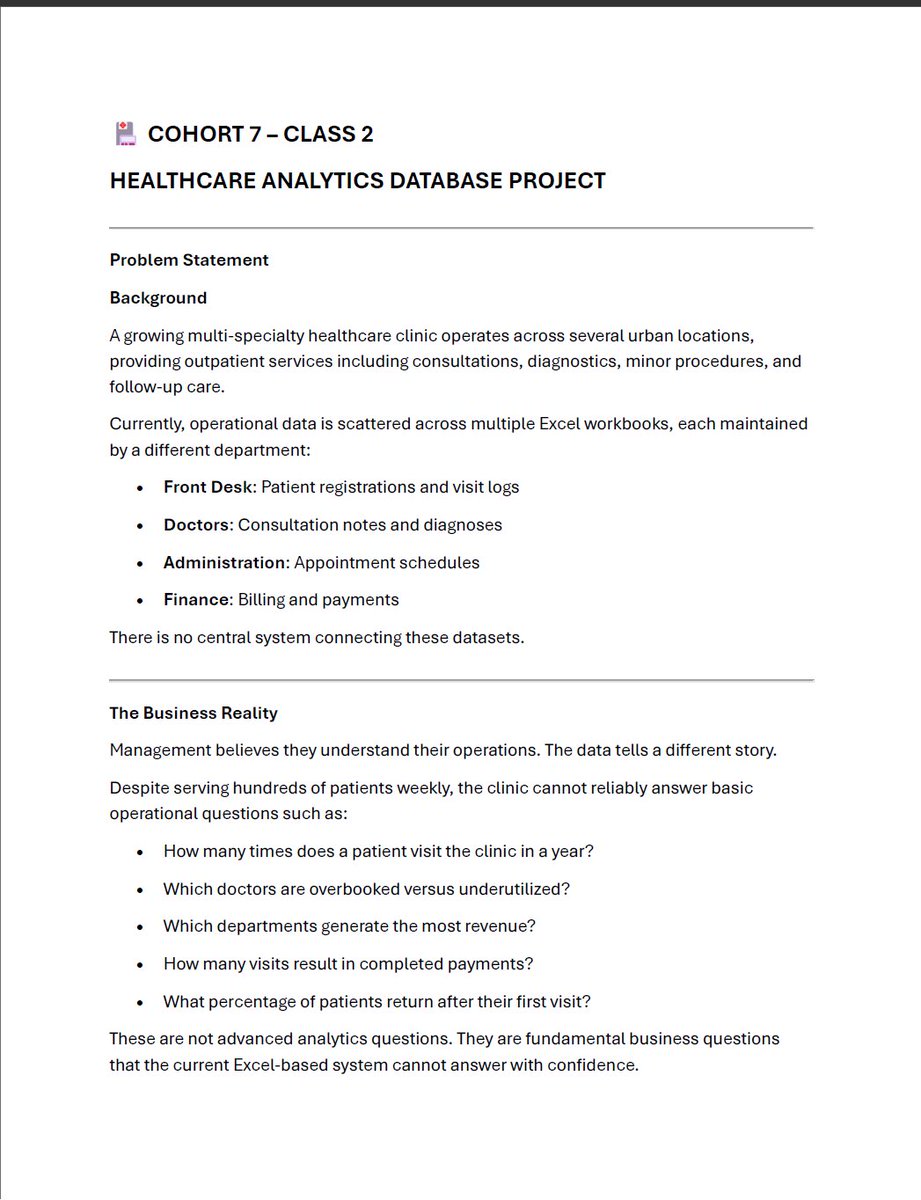
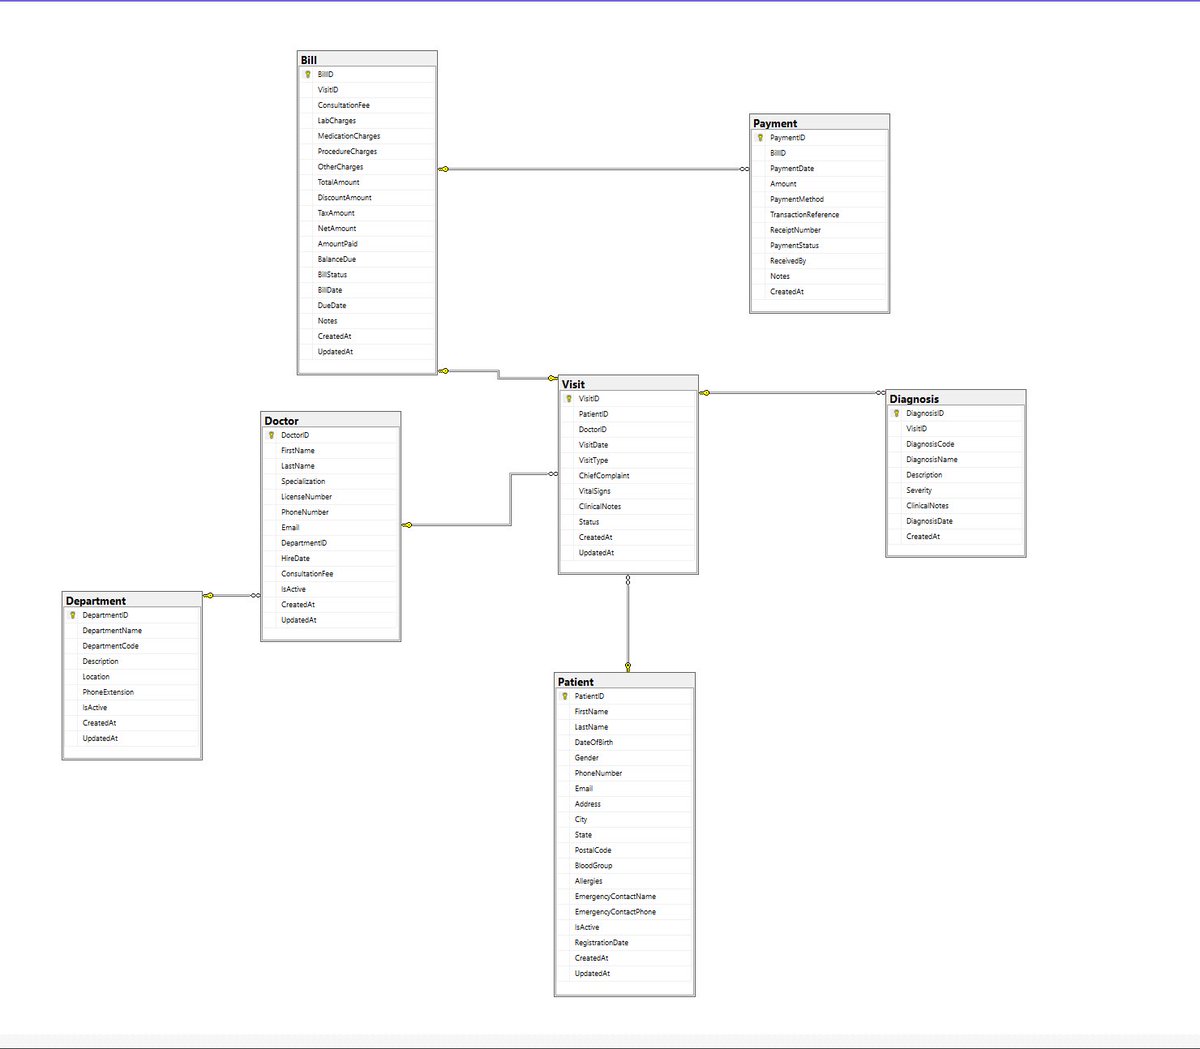
We built a complete healthcare clinic database from scratch - patients, doctors, visits, diagnoses, bills, payments. Real tables. Real relationships. Real business logic.
Then we dove deep into DML (Data Manipulation Language).
𝗜𝗡𝗦𝗘𝗥𝗧 - 𝗔𝗱𝗱𝗶𝗻𝗴 𝗗𝗮𝘁𝗮
Students learned how to populate databases with real data:
• Single row inserts vs bulk inserts
• Inserting 20 patients with realistic Nigerian names and details
• Adding 13 doctors across 6 departments
• Creating 24 visits with different statuses (completed, scheduled, cancelled)
They weren’t just copying syntax. They understood WHY you structure inserts this way.
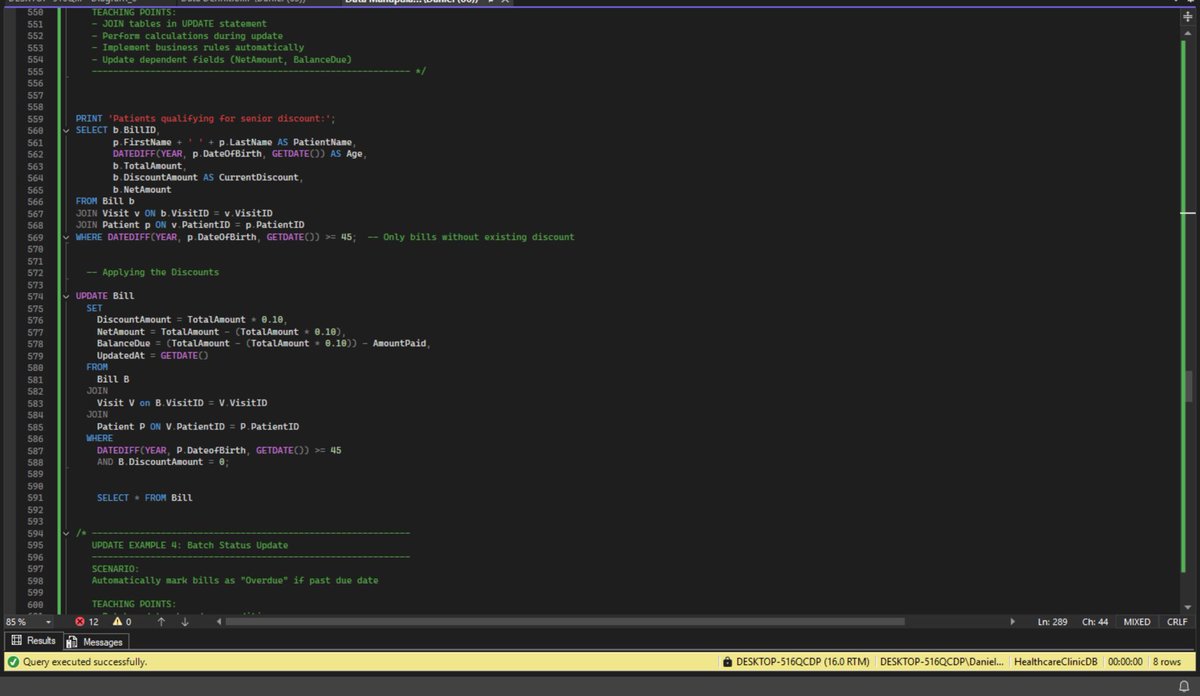
𝗨𝗣𝗗𝗔𝗧𝗘 - 𝗠𝗼𝗱𝗶𝗳𝘆𝗶𝗻𝗴 𝗗𝗮𝘁𝗮
This is where it got interesting.
We taught them how to:
• Update a patient’s phone number (single column)
• Mark visits as completed and add clinical notes (multiple columns)
• Apply 10% senior citizen discounts automatically using JOINs and calculations
• Batch update bills to “Overdue” status based on due dates
Students learned the #1 rule: ALWAYS preview with SELECT before you UPDATE.
Because one mistake here can change thousands of records.
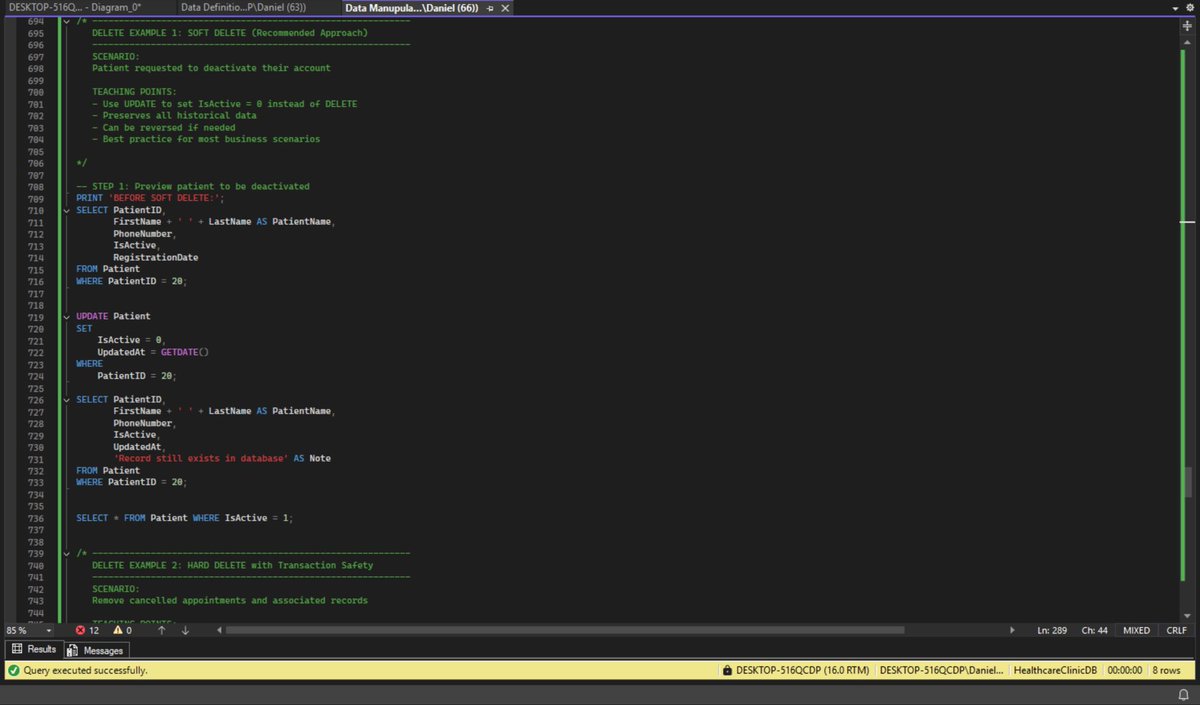
𝗗𝗘𝗟𝗘𝗧𝗘 - 𝗥𝗲𝗺𝗼𝘃𝗶𝗻𝗴 𝗗𝗮𝘁𝗮
We covered the difference between soft delete and hard delete.
Soft delete: Mark a record as inactive (IsActive = 0). Data stays in the database. You can recover it. This is what most businesses use.
Hard delete: Permanently remove the record. Gone forever. Use with extreme caution.
Students practiced both. They learned about foreign key constraints and why you can’t just delete a parent record when child records exist.
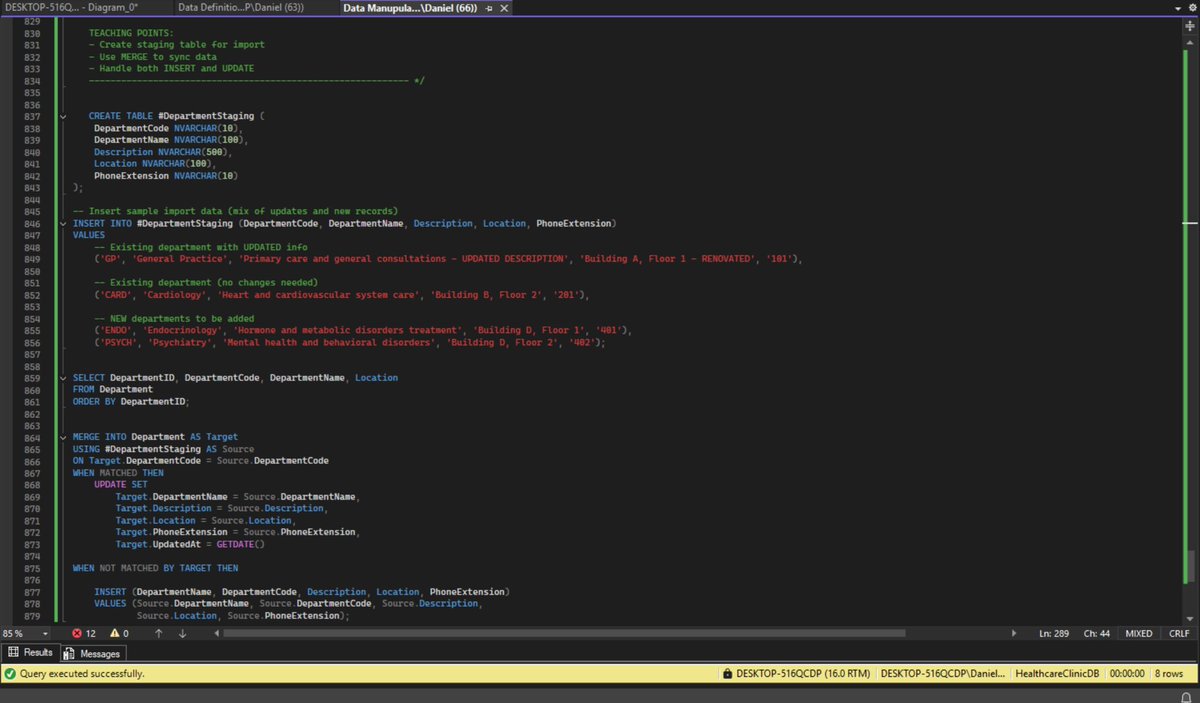
𝗠𝗘𝗥𝗚𝗘 - 𝗦𝘆𝗻𝗰𝗵𝗿𝗼𝗻𝗶𝘇𝗶𝗻𝗴 𝗗𝗮𝘁𝗮
This is advanced stuff.
MERGE lets you INSERT or UPDATE in one operation (also called UPSERT).
We created a staging table with department updates from an “external system.”
Then used MERGE to:
• Update existing departments if they changed
• Insert new departments if they didn’t exist
This is exactly how data warehouses and ETL processes work in real companies.
𝗧𝗵𝗲 𝗿𝗲𝘀𝘂𝗹𝘁?
Students who couldn’t spell “DML” two weeks ago are now writing queries that handle real business logic.
They’re applying discounts based on age calculations.
They’re managing visit workflows.
They’re synchronizing data between systems.
They’re thinking like analysts, not just following tutorials.
This is what structured learning with real projects looks like.
If you want to learn SQL like this, Cohort 8 starts January 30th.
Registration: selar.com/7q7p1y224k
WhatsApp: 234 911 028 9203
#SQL #DataAnalysis #DataWithDanny #Datafam #DML
2
3
36
1,776
𝗝𝘂𝘀𝘁 𝘄𝗿𝗮𝗽𝗽𝗲𝗱 𝗖𝗹𝗮𝘀𝘀 𝟮 𝘄𝗶𝘁𝗵 𝗖𝗼𝗵𝗼𝗿𝘁 𝟳.
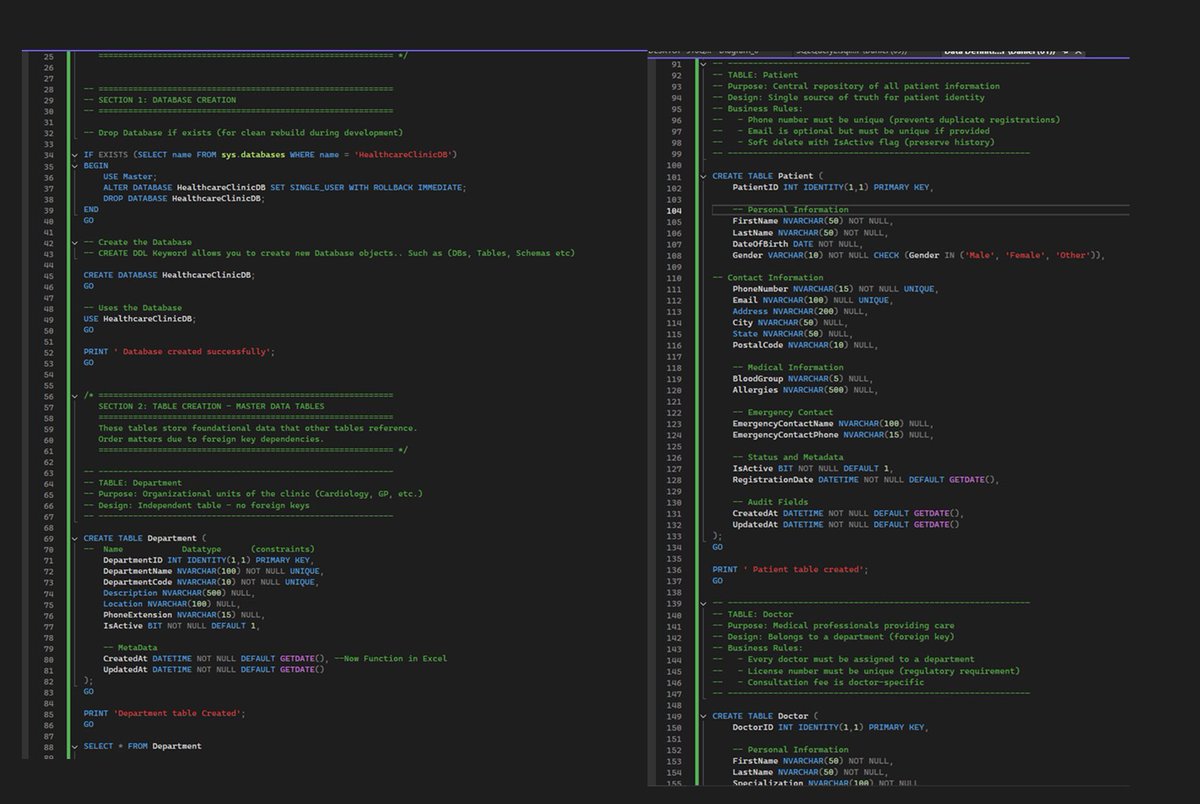
They went from “What’s an entity?” to building production-ready databases.
In one class.
𝗪𝗵𝗮𝘁 𝘁𝗵𝗲𝘆 𝗰𝗮𝗻 𝗻𝗼𝘄 𝗱𝗼:
→ Design 7-table normalized schemas
→ Write production DDL
→ Create business intelligence views
→ Optimize with strategic indexes
The speed of growth is insane.
Screenshots below. 👇
This is what happens when you have structure, mentorship, and real projects.
Cohort 8 starts January 30th. Registration is still open.
🔗 Register: selar.com/7q7p1y224k
𝗙𝗼𝗿 𝗺𝗼𝗿𝗲 𝗶𝗻𝗳𝗼𝗿𝗺𝗮𝘁𝗶𝗼𝗻:
📧 datawithdany@gmail.com
📱 WhatsApp: 234 911 028 9203
#SQL #DataAnalysis #DataWithDanny #Datafam

1
6
32
1,617
𝗥𝗲𝗴𝗶𝘀𝘁𝗿𝗮𝘁𝗶𝗼𝗻 𝗶𝘀 𝘀𝘁𝗶𝗹𝗹 𝗼𝗽𝗲𝗻 𝗳𝗼𝗿 𝗖𝗼𝗵𝗼𝗿𝘁 𝟴.
Data with Danny starts January 30th.
Excel • SQL • Python • Power BI • Statistics • Figma • PowerPoint
What’s included:
• 8 real-world projects
• 1-on-1 mentorship
• Certificate of completion
• World-class resources
📅 Classes: Friday-Sunday, 7-9 PM WAT
💰 ₦80,000 (Nigerians) | $80 (International)
Special offer: Pay 50% now, balance later.
🔗 selar.com/7q7p1y224k
📱 234 911 028 9203
Email datawithdany@gmail.com
#DataAnalysis #SQL #Python #PowerBI #DataWithDanny #Datafam

2
10
18
971

1
20
982
If you’re interested in learning all of this and how to use them daily, then enrol in Datawithdanny Cohort 8, it is part of our 4 months program
selar.com/7q7p1y224k
2
3
816
𝗚𝗼𝗼𝗱 𝗺𝗼𝗿𝗻𝗶𝗻𝗴 𝗴𝘂𝘆𝘀.
Today, I wanna tell you the next step after understanding the concepts of data analysis.
And that’s to learn Excel.
Why? Because it’s really easy and very much available.
Here’s what you need to learn to stand out:
𝗗𝗶𝗳𝗳𝗲𝗿𝗲𝗻𝘁 𝘁𝘆𝗽𝗲𝘀 𝗼𝗳 𝗰𝗲𝗹𝗹 𝗿𝗲𝗳𝗲𝗿𝗲𝗻𝗰𝗶𝗻𝗴
Relative, absolute, mixed - understand when to use each.
𝗗𝗮𝘁𝗮 𝗵𝗮𝗻𝗱𝗹𝗶𝗻𝗴 𝘁𝗲𝗰𝗵𝗻𝗶𝗾𝘂𝗲𝘀
→ Sort
→ Filters
→ Conditional formatting
→ Data validation
𝗙𝘂𝗻𝗰𝘁𝗶𝗼𝗻𝘀
→ Aggregate functions (SUM, AVERAGE, COUNT for summarization)
→ Text and date functions (for data cleaning)
→ Conditional functions and logical operators (IF, AND, OR)
→ Lookups (XLOOKUP and INDEX-MATCH)
→ Error handling functions (IFERROR, IFNA)
𝗪𝗵𝗮𝘁-𝗜𝗳 𝗔𝗻𝗮𝗹𝘆𝘀𝗶𝘀
Scenario planning, data tables, goal seek.
𝗔𝗽𝗽𝗹𝗶𝗲𝗱 𝗦𝘁𝗮𝘁𝗶𝘀𝘁𝗶𝗰𝘀
→ Data Analysis ToolPak
→ Correlation
→ Regression
𝗘𝗧𝗟 𝗽𝗿𝗼𝗰𝗲𝘀𝘀 𝘂𝘀𝗶𝗻𝗴 𝗣𝗼𝘄𝗲𝗿 𝗤𝘂𝗲𝗿𝘆
Extract, transform, load - the foundation of data preparation.
𝗗𝗮𝘁𝗮 𝗺𝗼𝗱𝗲𝗹𝗶𝗻𝗴 𝗮𝗻𝗱 𝗻𝗼𝗿𝗺𝗮𝗹𝗶𝘇𝗮𝘁𝗶𝗼𝗻 𝘂𝘀𝗶𝗻𝗴 𝗣𝗼𝘄𝗲𝗿 𝗣𝗶𝘃𝗼𝘁
Building relationships, creating data models.
𝗗𝗮𝘁𝗮 𝗔𝗻𝗮𝗹𝘆𝘀𝗶𝘀 𝘂𝘀𝗶𝗻𝗴 𝗣𝗶𝘃𝗼𝘁 𝗧𝗮𝗯𝗹𝗲𝘀 𝗮𝗻𝗱 𝗗𝗔𝗫
Summarize, analyze, create calculated measures.
𝗗𝗮𝘁𝗮 𝘃𝗶𝘀𝘂𝗮𝗹𝗶𝘇𝗮𝘁𝗶𝗼𝗻 𝘂𝘀𝗶𝗻𝗴 𝗣𝗶𝘃𝗼𝘁 𝗖𝗵𝗮𝗿𝘁𝘀
Turn your analysis into visual stories.
You can learn all this on YouTube for free.
Or if you need a structured guide to learn all these and more, enroll for Data with Danny Cohort 8.
🔗 selar.com/7q7p1y224k
#DataAnalysis #DataEngineering #Excel #LearningInPublic #DataWithDanny #Datafam

2
9
51
2,040
𝗚𝗼𝗼𝗱 𝗺𝗼𝗿𝗻𝗶𝗻𝗴 𝗴𝘂𝘆𝘀.
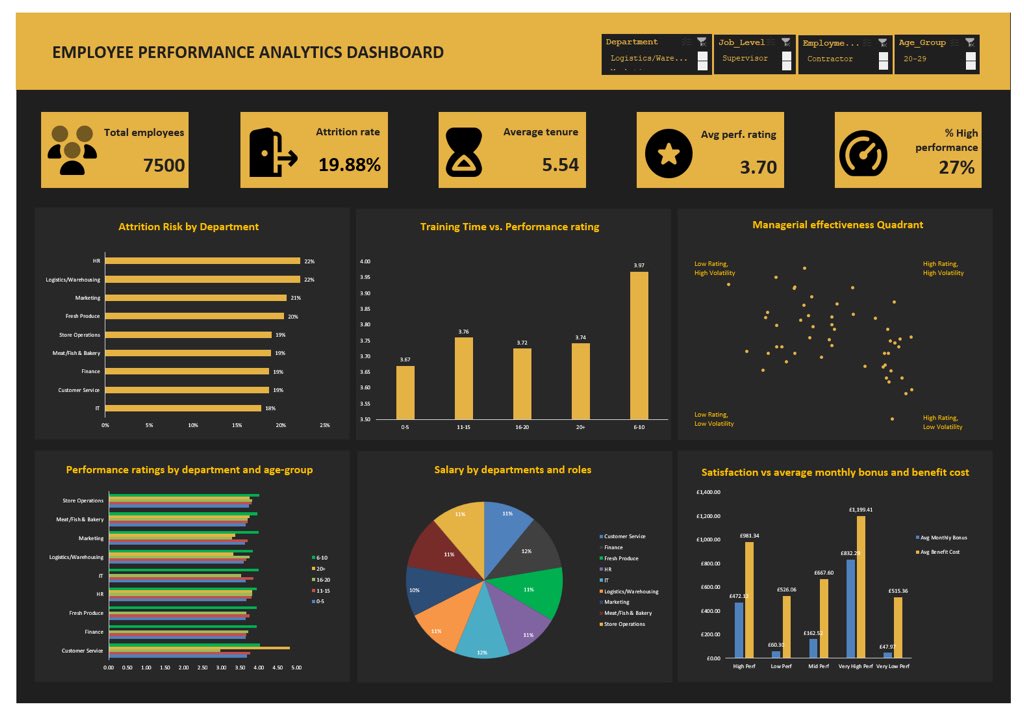
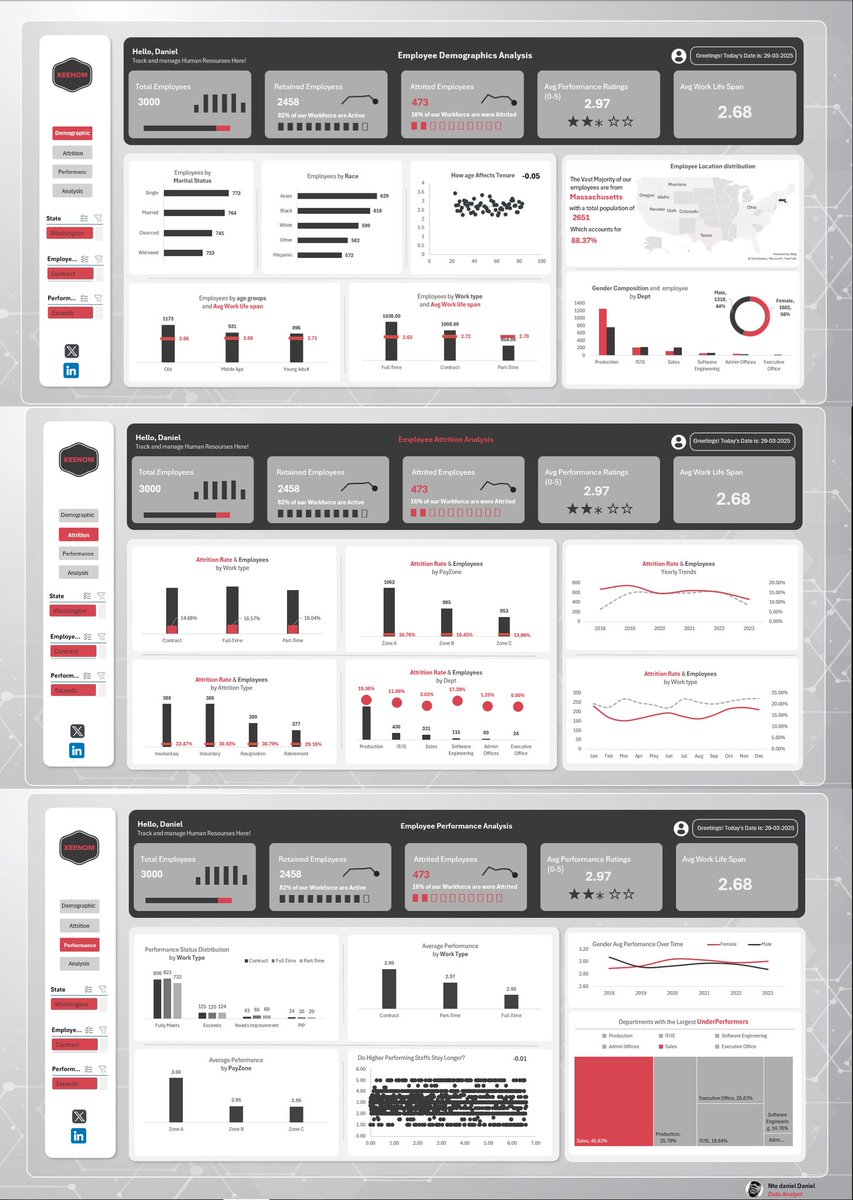
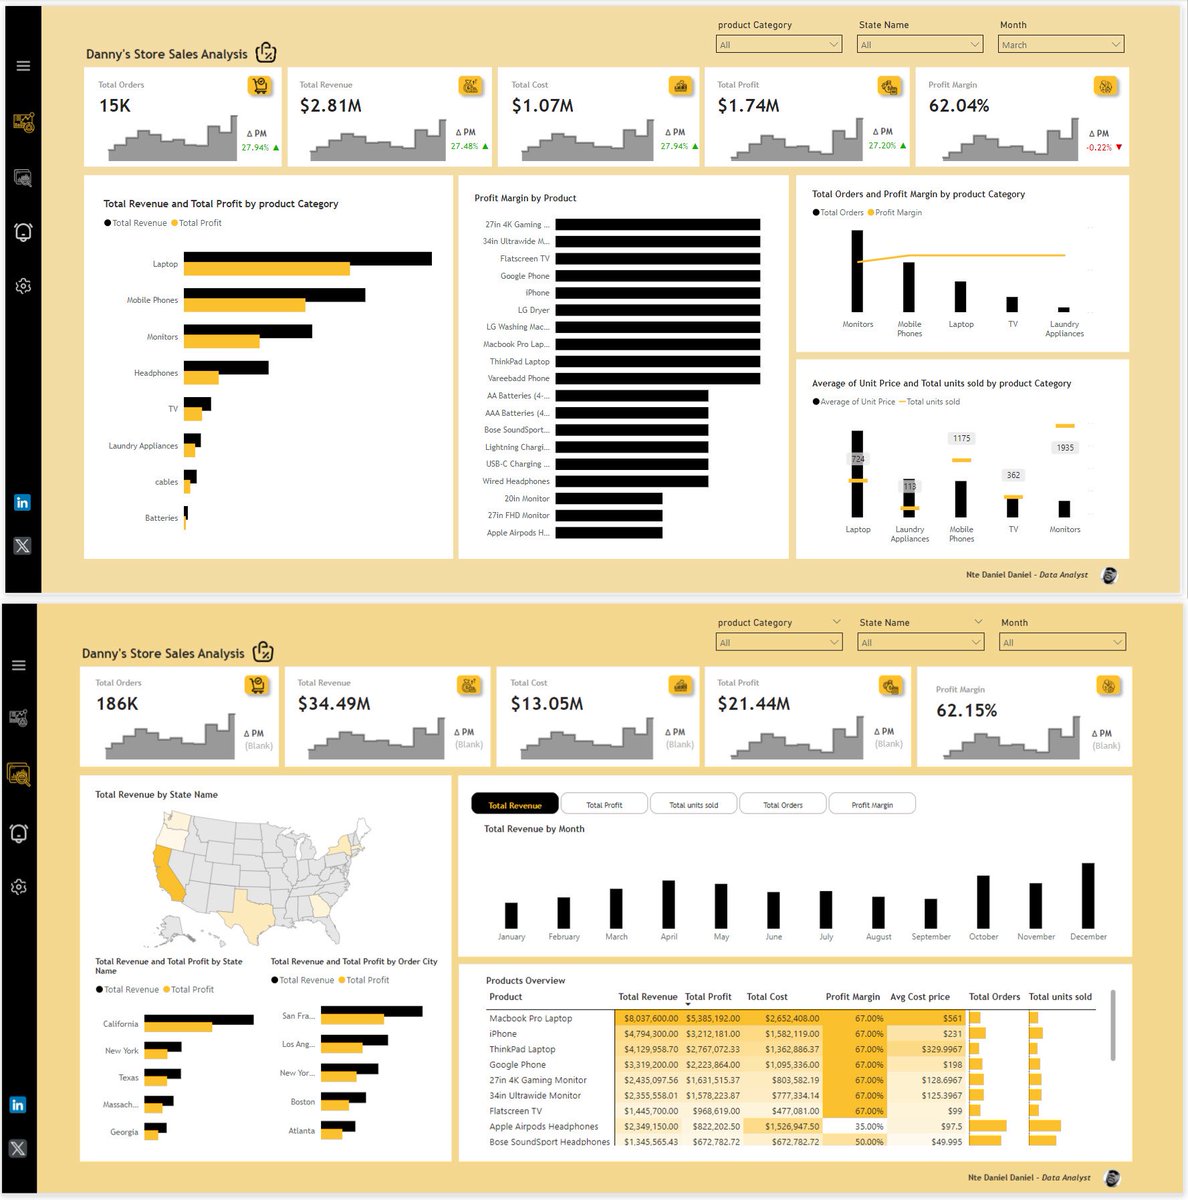
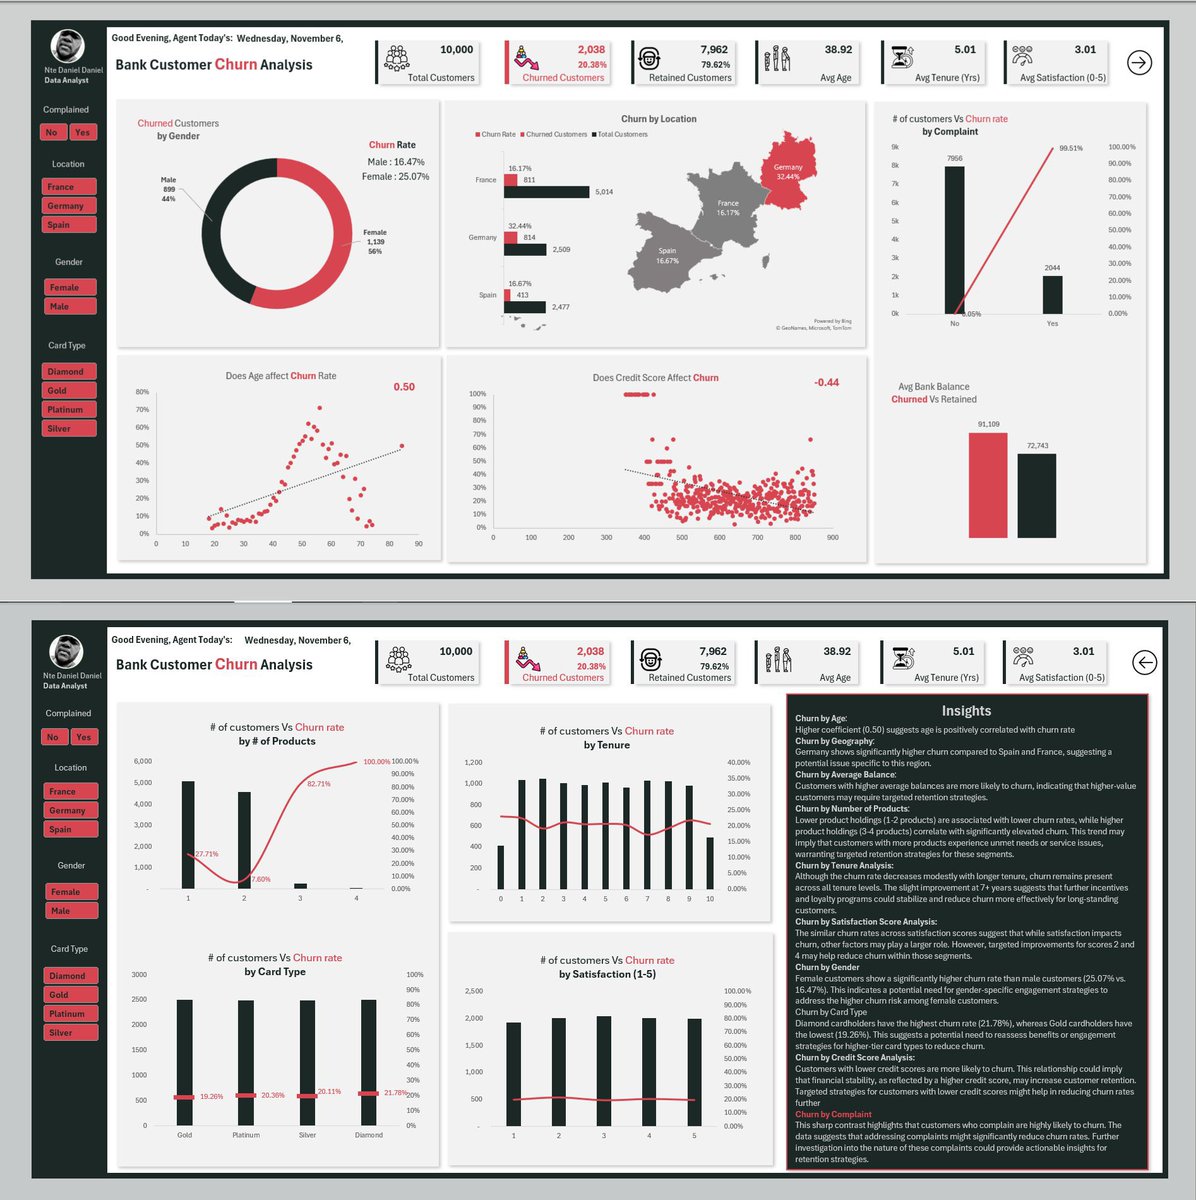
Registration still ongoing for Cohort 8.
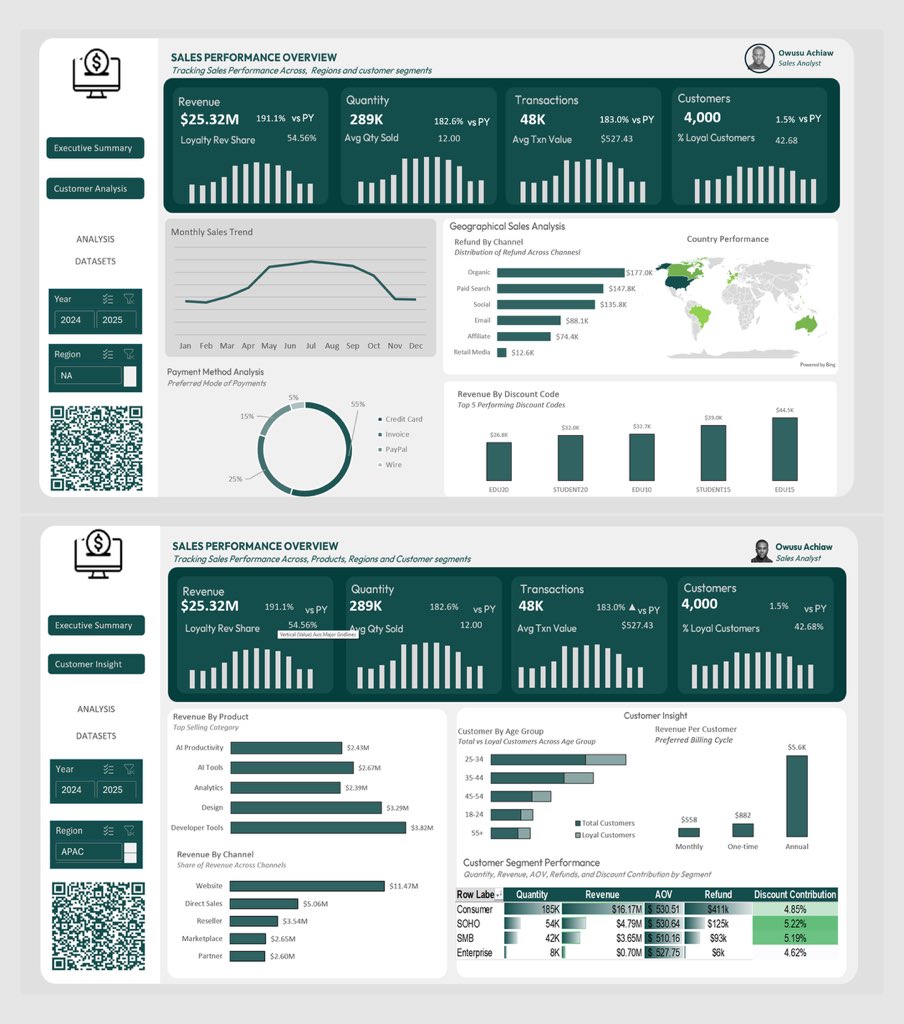
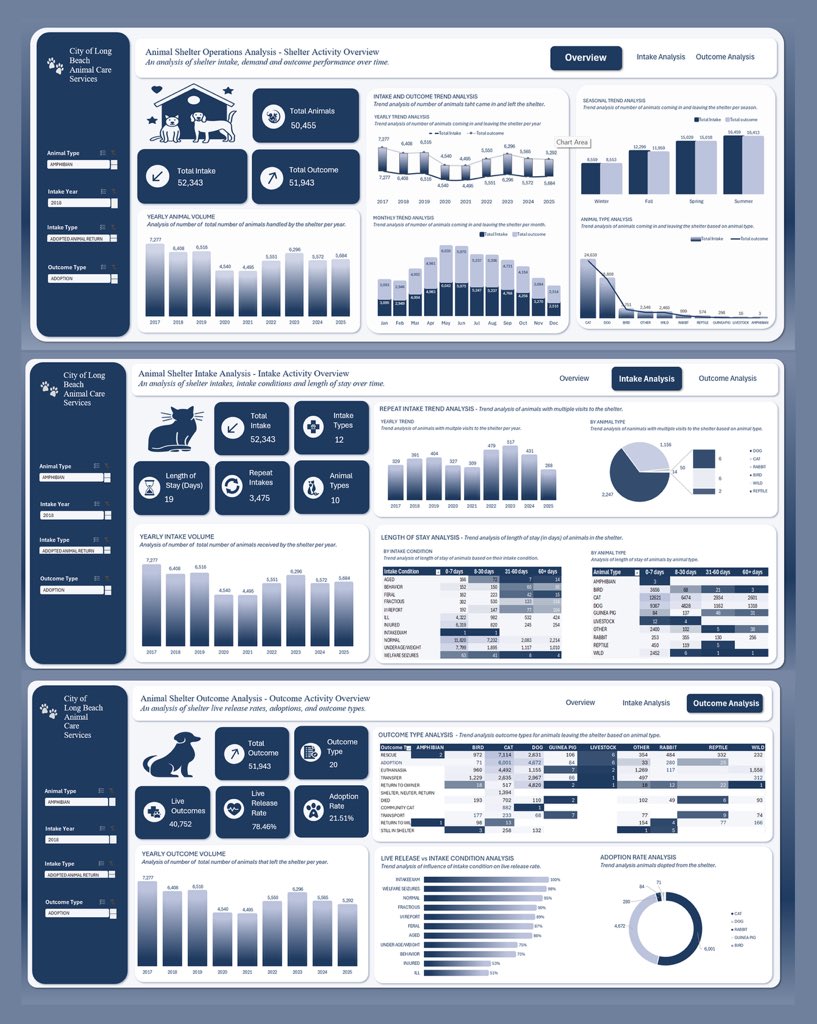
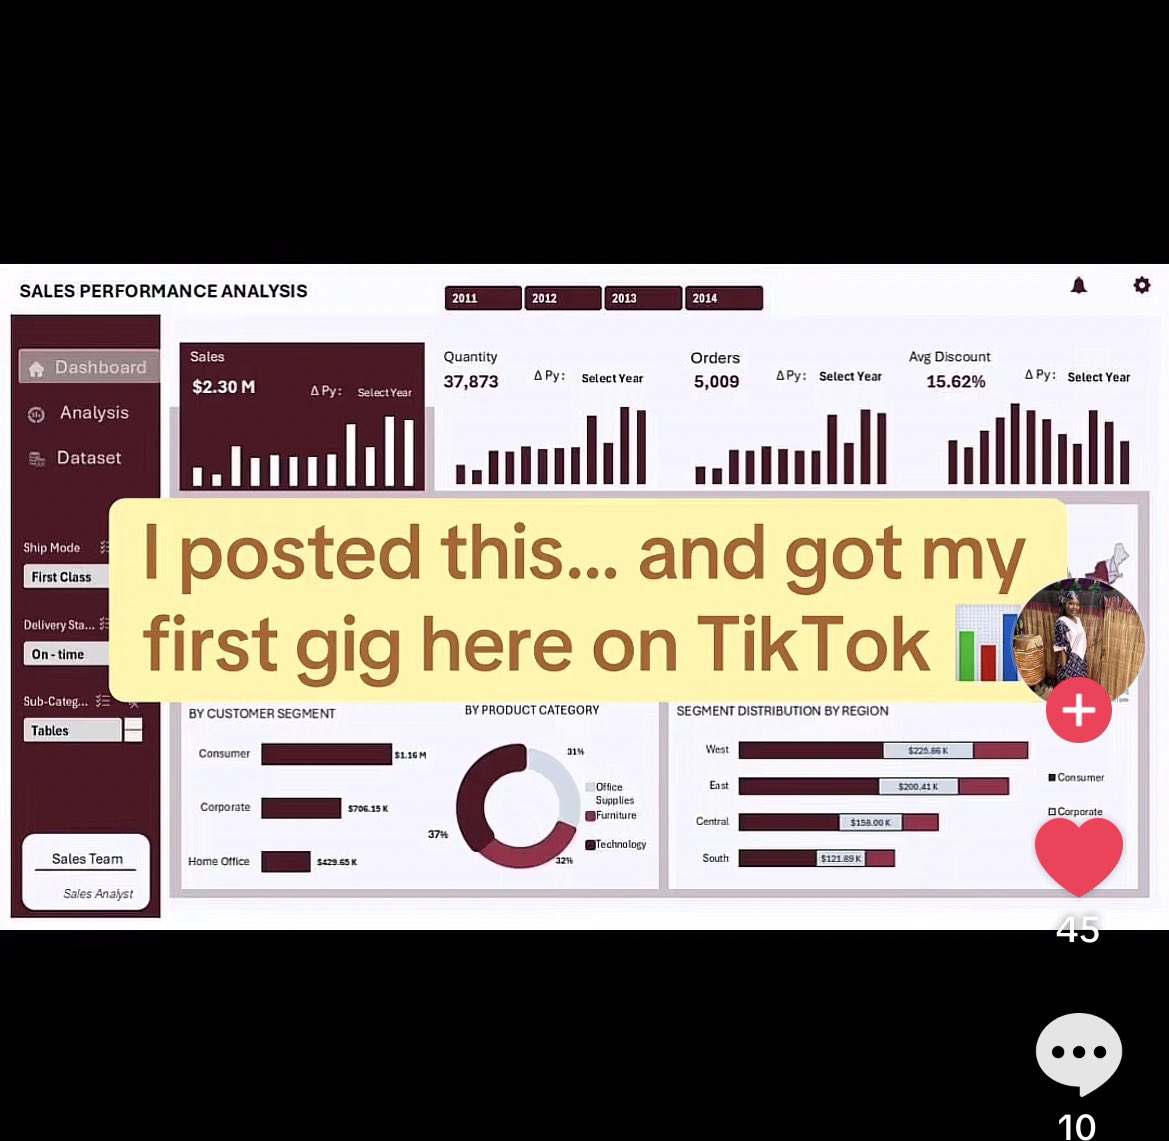
I know y’all love dashboards, so here are some from previous students - as their 𝗳𝗶𝗿𝘀𝘁 𝗽𝗿𝗼𝗷𝗲𝗰𝘁𝘀. 👇
These were built with beginners who started exactly where you are now.
𝗔𝘁 𝗗𝗮𝘁𝗮 𝘄𝗶𝘁𝗵 𝗗𝗮𝗻𝗻𝘆, 𝘆𝗼𝘂’𝗿𝗲 𝗹𝗲𝗮𝗿𝗻𝗶𝗻𝗴 𝗳𝗿𝗼𝗺 𝘀𝗼𝗺𝗲𝗼𝗻𝗲 𝘄𝗵𝗼’𝘀 𝘁𝗮𝘂𝗴𝗵𝘁 𝗼𝘃𝗲𝗿 𝟭,𝟬𝟬𝟬 𝘀𝘁𝘂𝗱𝗲𝗻𝘁𝘀.
We dive deep into:
→ Excel (dashboards, Power Query, Power Pivot, advanced functions)
→ SQL (databases, queries, data manipulation)
→ Power BI (interactive reports, DAX, visualization)
→ Python (data analysis, automation)
→ Statistics, Figma, PowerPoint
→ And a whole lot more
Not just tutorials. Real, portfolio-worthy projects.
𝗖𝗼𝗵𝗼𝗿𝘁 𝟴 𝘀𝘁𝗮𝗿𝘁𝘀 𝗝𝗮𝗻𝘂𝗮𝗿𝘆 𝟯𝟬𝘁𝗵.
4 months. Beginner to job-ready.
📅 Classes: Friday to Sunday, 7-9 PM WAT
💰 ₦80,000 (Nigerians) | $80 (International)
🔗 Register: selar.com/7q7p1y224k
📧 datawithdany@gmail.com
📱 WhatsApp: 234 911 028 9203
Let’s build together. 💪
#DataAnalysis #DataEngineering #Excel #PowerBI #SQL #DataWithDanny #Datafam

5
11
59
2,792
𝗛𝗮𝗽𝗽𝘆 𝗡𝗲𝘄 𝗬𝗲𝗮𝗿, #𝗗𝗮𝘁𝗮𝗳𝗮𝗺! 🎉
Welcome to 2026.
If you’re ready to finally start your data analytics journey - we’re starting in 30 days.
━━━━━━━━━━━━━━━━━━━━━━
𝗗𝗮𝘁𝗮 𝘄𝗶𝘁𝗵 𝗗𝗮𝗻𝗻𝘆 - 𝗖𝗼𝗵𝗼𝗿𝘁 𝟴
𝗦𝘁𝗮𝗿𝘁𝘀 𝗝𝗮𝗻𝘂𝗮𝗿𝘆 𝟯𝟬𝘁𝗵, 𝟮𝟬𝟮𝟲
4 months. Beginner to job-ready.
𝗪𝗵𝗮𝘁 𝘆𝗼𝘂’𝗹𝗹 𝗺𝗮𝘀𝘁𝗲𝗿: 𝗪𝗵𝗮𝘁 𝘆𝗼𝘂’𝗹𝗹 𝗴𝗮𝗶𝗻:
• Excel ✓ 8 real-world projects
• SQL ✓ 1-on-1 mentorship
• Python ✓ Certificate of completion
• Power BI ✓ World-class resources
• Figma
• PowerPoint
• Statistics
━━━━━━━━━━━━━━━━━━━━━━
📅 𝗦𝘁𝗮𝗿𝘁 𝗗𝗮𝘁𝗲: January 30th, 2026
⏰ 𝗖𝗹𝗮𝘀𝘀𝗲𝘀: Friday to Sunday, 7-9 PM WAT
💰 𝗜𝗻𝘃𝗲𝘀𝘁𝗺𝗲𝗻𝘁:
₦80,000 (Nigerians) 🇳🇬
$80 (International) 🌍
━━━━━━━━━━━━━━━━━━━━━━
If you’re serious about learning data analytics this year, we’d love to have you.
🔗 Register: selar.com/7q7p1y224k
𝗙𝗼𝗿 𝗺𝗼𝗿𝗲 𝗶𝗻𝗳𝗼𝗿𝗺𝗮𝘁𝗶𝗼𝗻:
📧 datawithdany@gmail.com
📱 WhatsApp: 234 911 028 9203
━━━━━━━━━━━━━━━━━━━━━━
Here’s to a great 2026.
#DataAnalysis #DataEngineering #Excel #SQL #Python #PowerBI #DataWithDanny #NewYear2026 #Datafam

1
17
49
3,831
𝗛𝗮𝗽𝗽𝘆 𝗡𝗲𝘄 𝗬𝗲𝗮𝗿, #𝗗𝗮𝘁𝗮𝗳𝗮𝗺! 🎉
Welcome to 2026.
If you’re ready to finally start your data analytics journey - we’re starting in 30 days.
━━━━━━━━━━━━━━━━━━━━━━
𝗗𝗮𝘁𝗮 𝘄𝗶𝘁𝗵 𝗗𝗮𝗻𝗻𝘆 - 𝗖𝗼𝗵𝗼𝗿𝘁 𝟴
𝗦𝘁𝗮𝗿𝘁𝘀 𝗝𝗮𝗻𝘂𝗮𝗿𝘆 𝟯𝟬𝘁𝗵, 𝟮𝟬𝟮𝟲
4 months. Beginner to job-ready.
𝗪𝗵𝗮𝘁 𝘆𝗼𝘂’𝗹𝗹 𝗺𝗮𝘀𝘁𝗲𝗿: 𝗪𝗵𝗮𝘁 𝘆𝗼𝘂’𝗹𝗹 𝗴𝗮𝗶𝗻:
• Excel ✓ 8 real-world projects
• SQL ✓ 1-on-1 mentorship
• Python ✓ Certificate of completion
• Power BI ✓ World-class resources
• Figma
• PowerPoint
• Statistics
━━━━━━━━━━━━━━━━━━━━━━
📅 𝗦𝘁𝗮𝗿𝘁 𝗗𝗮𝘁𝗲: January 30th, 2026
⏰ 𝗖𝗹𝗮𝘀𝘀𝗲𝘀: Friday to Sunday, 7-9 PM WAT
💰 𝗜𝗻𝘃𝗲𝘀𝘁𝗺𝗲𝗻𝘁:
₦80,000 (Nigerians) 🇳🇬
$80 (International) 🌍
━━━━━━━━━━━━━━━━━━━━━━
If you’re serious about learning data analytics this year, we’d love to have you.
🔗 Register: selar.com/7q7p1y224k
𝗙𝗼𝗿 𝗺𝗼𝗿𝗲 𝗶𝗻𝗳𝗼𝗿𝗺𝗮𝘁𝗶𝗼𝗻:
📧 datawithdany@gmail.com
📱 WhatsApp: 234 911 028 9203
━━━━━━━━━━━━━━━━━━━━━━
Here’s to a great 2026.
#DataAnalysis #DataEngineering #Excel #SQL #Python #PowerBI #DataWithDanny #NewYear2026 #Datafam

2
6
33
2,513

31 Dec 2025
𝗧𝗼𝗱𝗮𝘆’𝘀 𝘁𝗵𝗲 𝗹𝗮𝘀𝘁 𝗱𝗮𝘆 𝗼𝗳 𝟮𝟬𝟮𝟱.
Remember what you told yourself January 1st?
“This is my year.”
“I’m finally learning data analytics.”
“I’m switching careers.”
𝗛𝗼𝘄 𝗱𝗶𝗱 𝘁𝗵𝗮𝘁 𝗴𝗼?
If you’re reading this and you didn’t start - it’s not too late.
But 2026 won’t be different unless 𝘆𝗼𝘂 make it different.
━━━━━━━━━━━━━━━━━━━━━━
𝗗𝗮𝘁𝗮 𝘄𝗶𝘁𝗵 𝗗𝗮𝗻𝗻𝘆 - 𝗖𝗼𝗵𝗼𝗿𝘁 𝟴
𝗦𝘁𝗮𝗿𝘁𝘀 𝗝𝗮𝗻𝘂𝗮𝗿𝘆 𝟯𝟬𝘁𝗵, 𝟮𝟬𝟮𝟲
4 months. Beginner to job-ready.
𝗪𝗵𝗮𝘁 𝘆𝗼𝘂’𝗹𝗹 𝗺𝗮𝘀𝘁𝗲𝗿: 𝗪𝗵𝗮𝘁 𝘆𝗼𝘂’𝗹𝗹 𝗴𝗮𝗶𝗻:
• Excel ✓ 8 real-world projects
• SQL ✓ 1-on-1 mentorship
• Python ✓ Certificate of completion
• Power BI ✓ World-class resources
• Figma
• PowerPoint
• Statistics
━━━━━━━━━━━━━━━━━━━━━━
📅 𝗦𝘁𝗮𝗿𝘁 𝗗𝗮𝘁𝗲: January 30th, 2026
⏰ 𝗖𝗹𝗮𝘀𝘀𝗲𝘀: Friday to Sunday, 7-9 PM WAT
💰 𝗦𝗽𝗲𝗰𝗶𝗮𝗹 𝗢𝗳𝗳𝗲𝗿:
₦80,000 (Nigerians) 🇳🇬
$80 (International) 🌍
━━━━━━━━━━━━━━━━━━━━━━
Stop saying “next year.”
Next year is 𝘁𝗼𝗺𝗼𝗿𝗿𝗼𝘄.
🔗 Register now: selar.com/7q7p1y224k
𝗙𝗼𝗿 𝗺𝗼𝗿𝗲 𝗶𝗻𝗳𝗼𝗿𝗺𝗮𝘁𝗶𝗼𝗻:
📧 datawithdany@gmail.com
📱 WhatsApp: 234 911 028 9203
━━━━━━━━━━━━━━━━━━━━━━
Make 2026 different. Start now.
#DataAnalysis #DataEngineering #Excel #SQL #Python #PowerBI #DataWithDanny #2026Goals #Datafam

2
6
44
2,407
30 Dec 2025
𝗬𝗼𝘂 𝗱𝗼𝗻’𝘁 𝗵𝗮𝘃𝗲 𝘁𝗼 𝗯𝗿𝗲𝗮𝗸 𝘁𝗵𝗲 𝗯𝗮𝗻𝗸 𝘁𝗼 𝗹𝗲𝗮𝗿𝗻 𝗱𝗮𝘁𝗮 𝗮𝗻𝗮𝗹𝘆𝘁𝗶𝗰𝘀.
Start 2026 with a purpose. 🎯
𝗧𝗵𝗶𝘀 𝗶𝘀 𝗱𝗶𝗳𝗳𝗲𝗿𝗲𝗻𝘁. 𝗕𝗲𝗰𝗮𝘂𝘀𝗲 𝗶𝘁’𝘀 𝗵𝗮𝗻𝗱𝘀-𝗼𝗻.
The current cohort, on 𝗘𝘅𝗰𝗲𝗹 𝗮𝗹𝗼𝗻𝗲 - imagine going from zero to performing:
→ Regression analysis
→ What-if scenarios
→ ETL processes
→ Statistics and data analytics
→ Data visualization
𝗔𝗹𝗹 𝘄𝗶𝘁𝗵𝗶𝗻 𝘁𝗵𝗲 𝗳𝗶𝗿𝘀𝘁 𝟱 𝘄𝗲𝗲𝗸𝘀. ⚡
That’s what makes us different. 𝗪𝗲 𝗴𝗼 𝘄𝗮𝘆 𝗯𝗲𝘆𝗼𝗻𝗱 𝗱𝗮𝘀𝗵𝗯𝗼𝗮𝗿𝗱𝘀.
━━━━━━━━━━━━━━━━━━━━━━
𝗗𝗮𝘁𝗮 𝘄𝗶𝘁𝗵 𝗗𝗮𝗻𝗻𝘆 - 𝗖𝗼𝗵𝗼𝗿𝘁 𝟴
4 months. Beginner to job-ready. 🚀
𝗪𝗵𝗮𝘁 𝘆𝗼𝘂’𝗹𝗹 𝗺𝗮𝘀𝘁𝗲𝗿:
✅ Excel
✅ SQL
✅ Python
✅ Power BI
✅ Figma
✅ PowerPoint
✅ Statistics
𝗪𝗵𝗮𝘁 𝘆𝗼𝘂’𝗹𝗹 𝗴𝗮𝗶𝗻:
🎯 8 real-world projects
🎯 1-on-1 mentorship from industry experts
🎯 Certificate of completion
🎯 Full access to world-class resources
━━━━━━━━━━━━━━━━━━━━━━
📅 𝗦𝘁𝗮𝗿𝘁 𝗗𝗮𝘁𝗲: January 30th, 2026
⏰ 𝗖𝗹𝗮𝘀𝘀𝗲𝘀: Friday to Sunday, 7-9 PM WAT
💰 𝗦𝗽𝗲𝗰𝗶𝗮𝗹 𝗢𝗳𝗳𝗲𝗿:
₦80,000 (Nigerians) 🇳🇬
$80 (International) 🌍
━━━━━━━━━━━━━━━━━━━━━
🔗 𝗥𝗲𝗴𝗶𝘀𝘁𝗲𝗿 𝗵𝗲𝗿𝗲: selar.com/7q7p1y224k
𝗙𝗼𝗿 𝗺𝗼𝗿𝗲 𝗶𝗻𝗳𝗼𝗿𝗺𝗮𝘁𝗶𝗼𝗻:
📧 datawithdany@gmail.com
📱 WhatsApp: 234 911 028 9203
━━━━━━━━━━━━━━━━━━━━━━
Let’s make 2026 your breakthrough year. 💪
#DataAnalysis #DataEngineering #Excel #SQL #Python #PowerBI #DataWithDanny #Datafam


3
13
101
7,889