
Apr 14
🔍 Ethereum’s network is unusually quiet, with stablecoin activity at its lowest since 2024—usually a sign of a market in pause. Retail participation seems subdued, but institutional giants like Bitmine are quietly snapping up ETH at the fastest pace since 2025, holding over 4% of total Ethereum supply.
📈 Weekly charts reveal a compressed setup with potential for a breakout above $2,500 or a breakdown below $2,200 in the coming weeks. What’s next for ETH? Will the calm give way to a powerful move?
📊 Dive into the on-chain data and the unfolding tension between cautious retail and bold institutional moves. For full details, check out the insights from Santiment and TradingView. Remember, this is for informational purposes only. Stay informed, stay cautious! 💡
More info at techgaged.com/the-calm-befor…
#Ethereum #CryptoMarket #Blockchain #CryptoInvesting #ETHAnalysis

2
42

📈 Ether taker volume hits 3-year high! Is ETH prepared to withstand a 19% price drop? 🤔 Find out more here: cointelegraph.com/news/ether… #Ethereum #Crypto #ETHanalysis
1
3
10

Mar 9
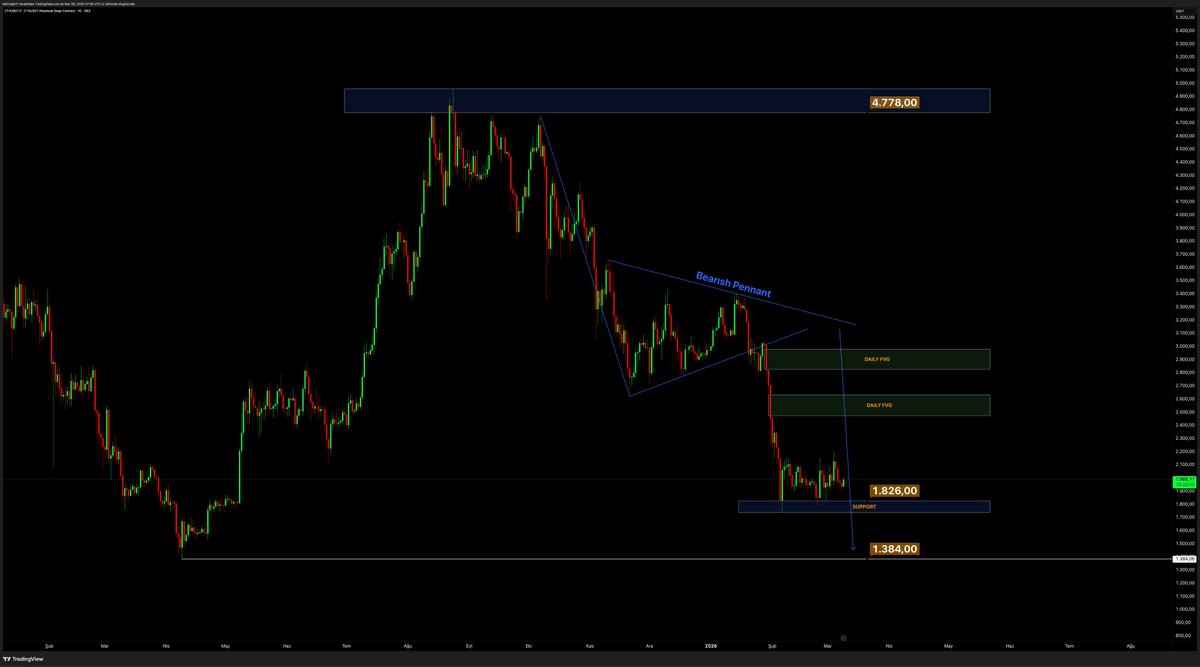
#ETH Ayı Flaması Çalışır mı ? yada Oluşur mu ?
TradingView tr.tradingview.com/chart/ETH…
#Ethereum #ETH #Crypto #Kripto #TechnicalAnalysis #PriceAction #TradingView #ETHAnalysis #MarketStructure #CryptoMarket
3
904


🚨MARKET ALERT: Ethereum Enters Capitulation Zone
Ethereum just dropped 30% in two weeks.
The MVRV Z-Score now sits at -0.42 — a level historically associated with holder capitulation.
📉 On-chain data confirms:
ETH is trading below its aggregate cost basis.
But here’s the key —
⚠️ Current readings are still above prior cycle extremes.
This signals stress… not confirmed final exhaustion.
Liquidity is tightening.
Weak hands are exiting.
Volatility is expanding.
Some analysts warn of further downside pressure.
Others see this as a strategic accumulation window during fear.
Capitulation reshapes markets.
Positioning defines outcomes.
At BitHash, we monitor on-chain structure — not headlines.
🔍 Want the full breakdown?
👉 Read now: bithash.ae/news/ethereum-ent…
🌐 bithash.ae
📞 971 55 897 2221 | 971 58 572 2898
📧 info@bithash.ae
#BitHash #Ethereum #ETH #CryptoMarket #OnChainAnalysis #MVRV #MarketStructure #CryptoCapitulation #DeFi #Altcoins #CryptoNews #DigitalAssets #Blockchain #ETHAnalysis

2
42

Jan 31
Crypto Market (Jan 31, 2026):
BTC consolidating around $83K–$84K after pulling back ~6–7% from the ~$100K peak, still holding strong dominance (~60%).
ETH below $3K, alts mixed — with AI & RWA showing relative strength.
Market cap $2.8–$3.0T, sentiment in fear, ETFs choppy, macro still noisy.
Feels like a pause before the next big move.
Consolidation often comes before expansion. 🚀
#BTCAnalysis #ETHAnalysis #MarketStructure #CryptoTraders #PriceAction

1
15
432

Jan 27
🐋 CÁ VOI ETHEREUM TÍCH LŨY MẠNH GẦN NGƯỠNG GIÁ VỐN - TÍN HIỆU QUAN TRỌNG TỪ DỮ LIỆU ON-CHAIN
Theo CryptoQuant cho thấy một sự liên kết đáng chú ý giữa giá thị trường hiện tại của Ethereum và giá vốn thực hiện (realized price) của các địa chỉ tích lũy dài hạn - một động thái lịch sử đã đánh dấu các vùng giá có ý nghĩa cấu trúc quan trọng.
Hai biểu đồ chính - số dư ETH trên địa chỉ tích lũy và giá thực hiện ETH cho địa chỉ tích lũy - đều chỉ ra sự tự tin bền vững từ cá voi bất chấp biến động thị trường gần đây.
💰 Địa chỉ tích lũy tiếp tục tăng trưởng mạnh mẽ
Tổng số dư ETH được nắm giữ bởi các địa chỉ tích lũy - những ví lịch sử chỉ nhận ETH và không phân phối chúng ra ngoài đã tăng tốc mạnh mẽ vào đầu năm 2026, đẩy lên mức cao nhất mọi thời đại.
Điều này cho thấy các cá voi đang xây dựng vị thế dài hạn một cách nghiêm túc.
🎯 Giá thực hiện hoạt động như hỗ trợ cấu trúc
Về bản chất giá thực hiện chính là giá mua trung bình của cá voi theo thời gian. Hiện tại, Ethereum đang giao dịch rất gần với mức giá thực hiện này.
Khi giá thị trường hội tụ với giá vốn của cá voi, nó thường tạo ra một mức hỗ trợ on-chain mạnh mẽ, vì các holder lớn ít có động lực bán gần mức giá nhập trung bình của họ. Thay vào đó, vùng này có xu hướng hoạt động như một khoảng củng cố hoặc tái tích lũy trước khi xu hướng tiếp tục.
🔮 Ý nghĩa thị trường
Từ góc độ on-chain, Ethereum đang nằm ở một mức quan trọng về mặt kỹ thuật và hành vi. Cá voi đang tích cực tích lũy gần giá vốn dài hạn của họ, củng cố vùng này như một nền tảng cấu trúc tiềm năng.
Mặc dù biến động giá riêng lẻ có thể xuất hiện không quyết đoán, nhưng định vị on-chain cơ bản cho thấy rằng các holder lớn đang âm thầm chuẩn bị cho động thái định hướng tiếp theo, với các mức hiện tại vẫn được coi là điểm vào hấp dẫn thay vì vùng thoát ra.
#MarketStructure #Ethereum #FinVenture #CryptoWhales #OnChainAnalysis #AccumulationZone #RealizedPrice #ETHAnalysis #ThịTrườngCrypto

2
47
$ETH Ethereum Weekly Chart Looks Extremely Bullish!🚀
Despite the weekly outflows, strong structure is holding inside the channel.
Prepare for liftoff! 👀
#ethanalysis #bullish #ethchart
2
78

26 Dec 2025
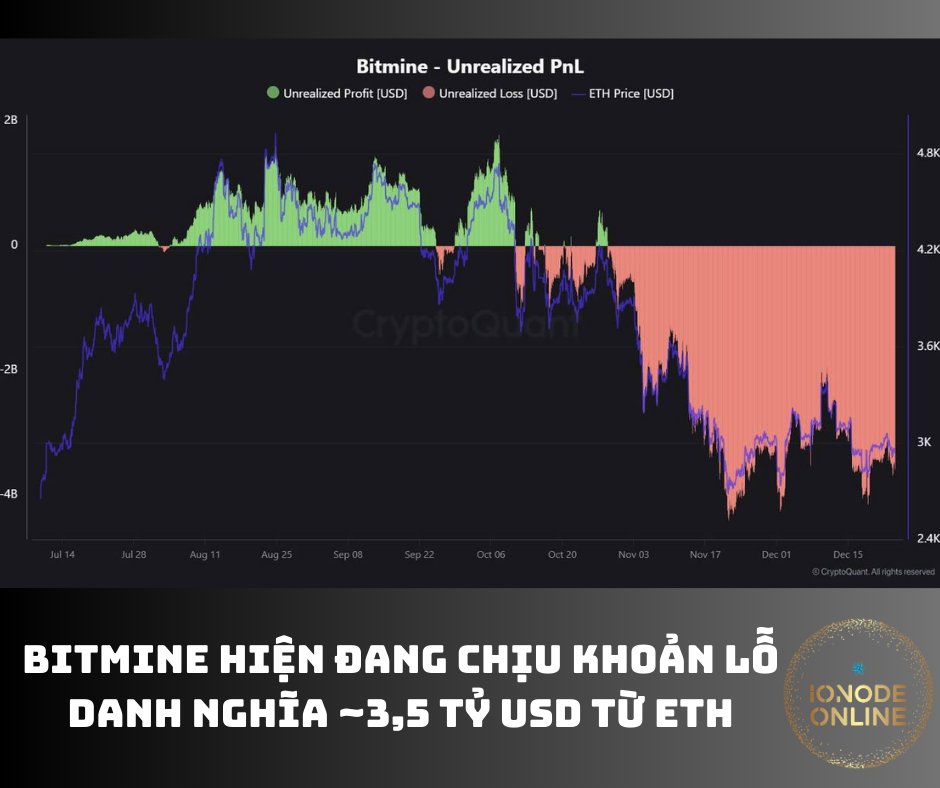
😀 BITMINE HIỆN ĐANG CHỊU KHOẢN LỖ DANH NGHĨA - 3,5 TỶ USD TỪ ETH 😀
❣️ Điều này cho thấy:
- Một tổ chức lớn đang kẹt hàng nặng, gồng lỗ và chưa có dấu hiệu bán tháo (capitulate). Do đó ap lực bán chưa xảy ra, nhưng nguồn cung tiềm năng vẫn treo trên thị trường, hỗ trợ tâm lý cho ETH quanh 2.8–3.0K
- ETH đang ở pha chịu đau – tích lũy, chưa phải bull run thực sự
❣️ Theo dòng lịch sử thì khi cá voi lỗ sâu nhưng chưa bán → thị trường thường cần thời gian đi ngang, rũ bỏ, trước khi có xu hướng rõ ràng.
🤔 Đây không phải tín hiệu FOMO, mà là dữ liệu để theo dõi vùng tạo đáy trung hạn của ETH.
#Ethereum #ETH #ETHPrice #ETHAnalysis #CryptoMarket #CryptoNews
62

24 Dec 2025
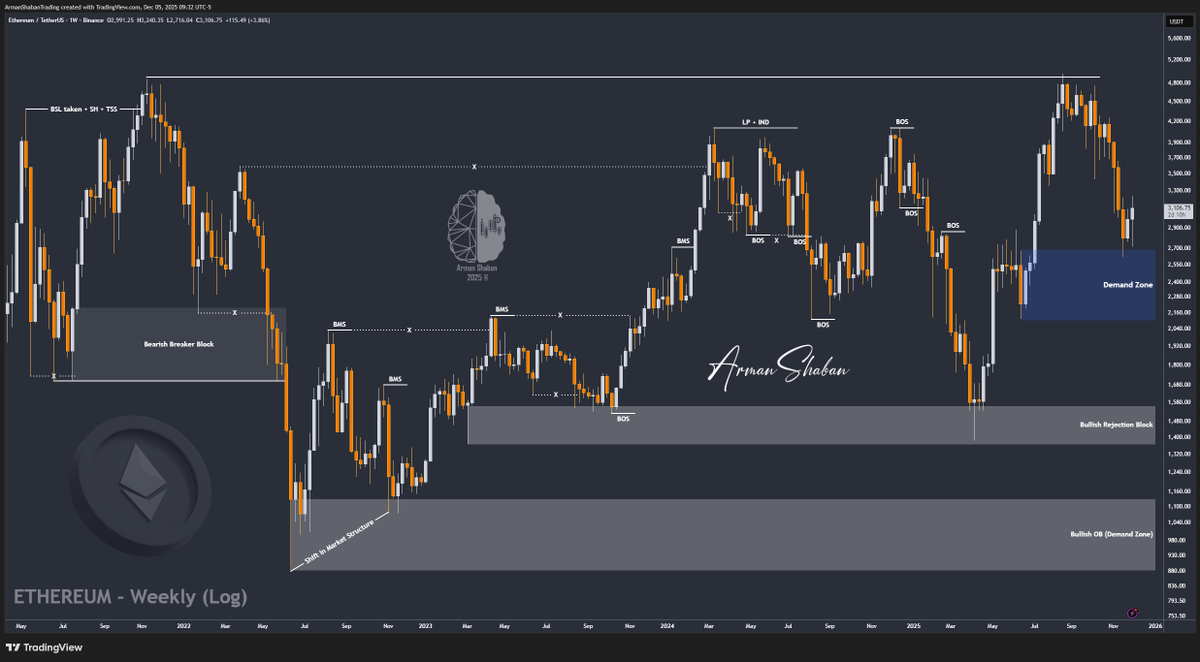
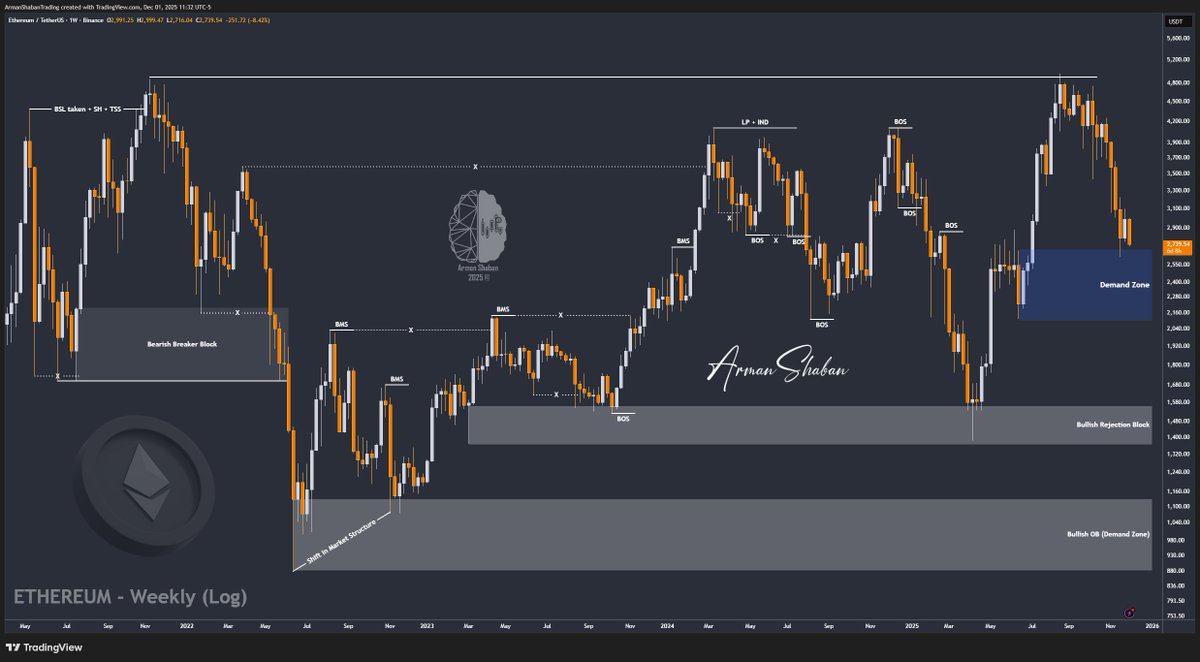
$ETH Update – Key Demand Zone Still in Play!
Ethereum rallied up to $3,450, but failed to hold and is now trading near $2,900. This correction could deepen, and I’m watching the $2,100–$2,700 demand zone closely. It remains one of the strongest institutional zones on the chart. If price returns there, a sharp bullish reaction is highly likely.
tradingview.com/chart/ETHUSD…
#ETH #Ethereum #Crypto #PriceAction #ETHAnalysis #SmartMoney
3
47

23 Dec 2025
Ethereum Price Analysis | Key Zones Traders Must Watch
📌 GROW WITH SARMAAYA: sarmaaya.pk/trainings/
This ETH short explains ideal projection zones, current accumulation behavior, and what ETH’s market structure is signaling right now. This analysis helps you read ETH’s price action with clarity, instead of reacting emotionally to volatility.
📊 This short explains:
- Why ETH’s move toward ideal projection zones matters
- How accumulation after a rally often sets up the next leg
- What a key structure break would signal for the end of the bearish phase
This short is for you if you:
☑️ Trade ETH and want to spot accumulation
☑️ Swing trade and want to read lower lows correctly
☑️ Invest long-term and want to understand ETH’s evolving structure
📢 WATCH, LEARN, AND FOLLOW FOR DETAILED ETH MARKET INSIGHTS
#eth #sarmaayafinancials #ethereum #ethanalysis #cryptotrading #EthereumTechnicalAnalysis #cryptoinsights
1
4
457

21 Dec 2025
3/14 Next, #Ethereum (#ETH)! 💜 While its price has been consolidating stubbornly, the underlying fundamentals are absolutely *exploding*! We're seeing surges in active addresses, transaction volumes, gas usage, and staking growth. The EIP-4844 upgrade further strengthens its long-term outlook. This consolidation might just be the calm before a monumental storm. ⛈️ #ETHStrong #EthereumUpgrade #DeFi #SmartContracts #BlockchainTech #ETHAnalysis #Web3Innovation
1
3
17

18 Dec 2025
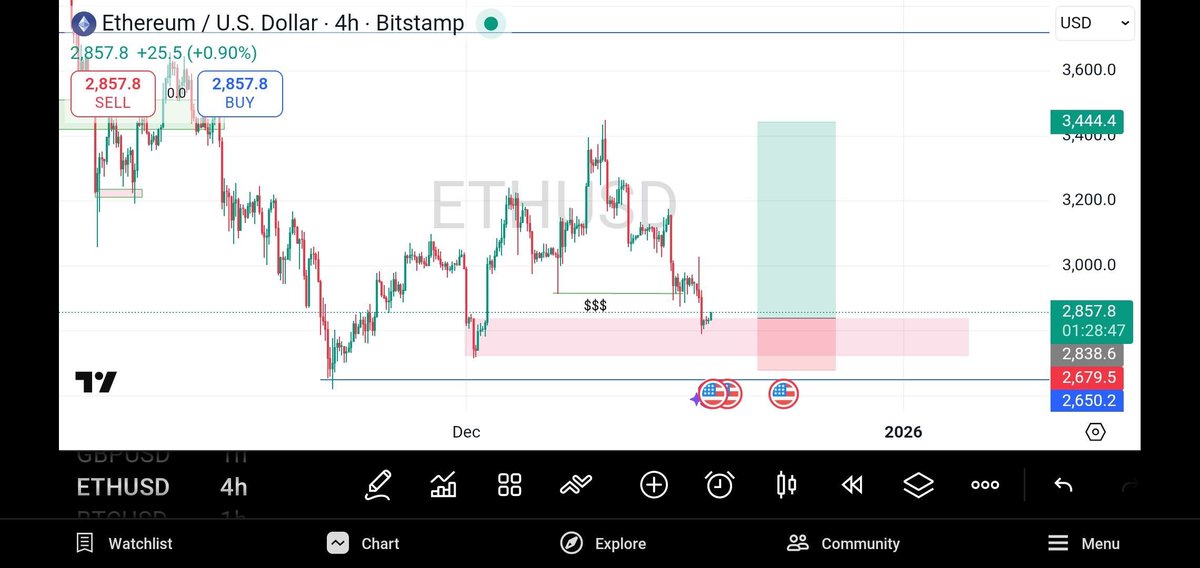
#Ethereum is testing a key demand zone around $2,850.
This an area where we previously saw strong buying .
Here's the setup you need to watch:
- Support: $2,800–$2,650 zone
- Invalidation: Clean break below $2,650
- Target: $3,300–$3,450 resistance area
As long as $ETH defends this demand, the risk-to-reward favors a relief move to the upside.
A breakdown below support could open the door for deeper retracement.
But don't force the setup!
#ethanalysis #ethereumsignal #cryptosignals
3
62
9 Dec 2025
$ETH is holding around $3,120 and the bullish momentum is still intact. The reaction from the $2,100 to $2,600 demand zone continues to play out exactly as expected and Ethereum is maintaining strength above the key $3,000 level. As long as ETH stays above this area the broader bullish structure remains active and the next upside leg can still unfold without any structural damage.
If momentum continues, the next targets stay the same at $3,350, $3,500, and eventually $3,800 in the following wave. For now I am watching to see if ETH keeps consolidating above $3,000, because holding this zone usually leads to another strong move toward higher levels.
#ETH #Ethereum #Crypto #ETHAnalysis

2
35

8 Dec 2025
We’ve gotten a correction on #BTC, and now we’re seeing a buyback attempt targeting $95K–$96K.
At that level, the probability of another drop toward my long-awaited $75K becomes quite high.
Plus, we have the FOMC meeting coming up. As usual, we may see growth on positive expectations, followed by a decline afterward.
That’s why I’m saying it’s safer to lock in the speculative positions you opened once #BTC reaches $95K–$96K, and #ETH hits $3200–$3300.
📈 I trade on Bybit: bybit.com/invite?ref=NYM7ZN
#Bitcoin #CryptoMarket #BTCAnalysis #ETHAnalysis #FOMC #CryptoTrading #CryptoStrategy #CryptoNews #Bybit #BTC95K #ETH3300

2
108
5 Dec 2025
$ETH pushed all the way to $3,250, hit the next upside target, and is now trading around $3,100. The reaction from the $2,100 to $2,600 demand zone has been textbook and the broader bullish structure is still intact. As long as Ethereum can stay above $3,000, the next bullish wave can easily push price toward higher levels.If momentum holds, the next upside targets are $3,350, $3,500, and $3,800 in continuation. For now I’m watching to see if ETH keeps consolidating above $3,000 because that would signal another strong move incoming.
#ETH #Ethereum #Crypto #ETHAnalysis
3
7
1,498
3 Dec 2025
$ETH Bounces Exactly From Demand and Pushes Toward 3150!
$ETH reacted perfectly to the 2100 to 2600 demand zone and the move played out exactly as expected. After the pullback the buyers stepped in and pushed the price all the way to 3150 and right now Ethereum is trading around 3100. The broader bullish setup is still valid and as long as ETH stays above the main demand area the bigger targets at 3200 and 3500 remain on the table. For now I’m watching to see if momentum continues to build from this recovery.
#ETH #Ethereum #Crypto #ETHAnalysis

3
70
1 Dec 2025
$ETH is dropping with the rest of the market but the selling pressure is clearly weaker compared to Bitcoin. The broader structure has not broken and the main demand zone between $2100 and $2600 is still fully valid. As long as Ethereum holds above this area the bigger bullish setup stays alive and the next major leg can still target 3200 and 3500 once momentum returns. For now I’m watching how price reacts inside the 2100 to 2600 zone.
#ETH #Ethereum #Crypto #ETHAnalysis
4
120

30 Nov 2025
$ETH is showing early signs of a major trend reversal — even while everyone is still focused on the downtrend. Ethereum has spent weeks riding the purple down-trend ribbon lower, but now the chart is flashing the first real shift we’ve seen since early October:
1. ETH is starting to close against the downtrend ribbon
Whenever price begins to push inside or above the purple ribbon after a long slide, it signals sellers are losing control.
That’s exactly what triggered right before the July and October reversals.
2. Oversold conditions repeated wick rejections
Multiple long wicks off the lows show buyers aggressively absorbing every dip.
This is classic accumulation behavior.
3. ETH is curling up from the lower volatility band
Historically, ETH doesn’t stay outside its lower band for long — every touch or near-touch has led to strong upside swings.
4. The red projected curve shows the “bear path”… but ETH is diverging upward
Instead of following the projected red curve lower, price is flattening and lifting.
That divergence is bullish.
5. The risk–reward is heavily skewed to the upside
Key reclaim levels:
• $3,095 — trend flip trigger
• $3,269–3,443 — acceleration zone
• Above this = full reversal structure like July
ETH has the exact ingredients of a bottoming setup:
Downtrend exhaustion → accumulation → ribbon challenge → reversal.
The bulls are quietly taking back control.
#Ethereum #ETH #Crypto #ETHAnalysis #MarketUpdate #ReversalWatch #Bullish Setup

2
452

28 Nov 2025
#ETH #BTC #ASTER #SOL
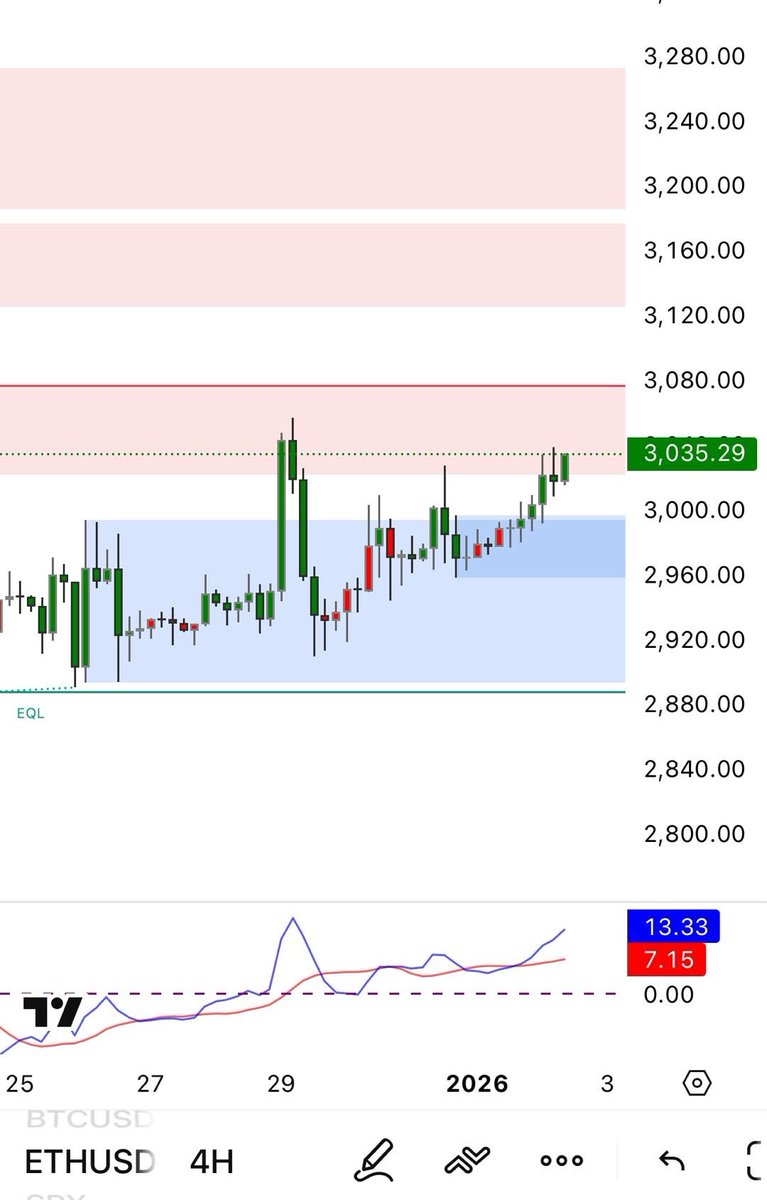
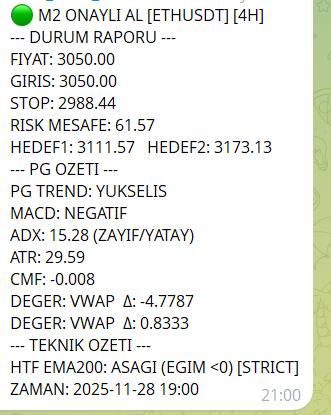
ETHUSDT (4H)
Ethereum has triggered an M2 Confirmed Buy signal on the 4-hour chart. The price is currently at 3050, matching the entry level. The stop is positioned at 2988, with a risk distance of 61 points. Based on the current structure, Target 1 is 3111 and Target 2 is 3173.
The primary trend signal indicates bullish momentum, although MACD remains negative, suggesting the move is not yet fully confirmed. ADX is weak, indicating low trend strength at the moment. ATR shows moderate volatility, and CMF remains near neutral, reflecting limited capital inflow. The higher-timeframe EMA200 is still sloping downward, meaning the broader trend has not fully reversed.
Overall, the signal represents an early trend-shift attempt. Upside potential toward the targets is present, but price movement below the stop level would weaken the structure. Always combine this signal with your own analysis and risk approach.
#ETH #ETHUSDT #Ethereum #Crypto #Kripto #TeknikAnaliz #4H #Signal #BuySignal
#M2 #Trend #Momentum #Altcoin #BTC #ETHAnalysis #PriceAction #KriptoAnaliz
#CryptoTrading #Support #Resistance #Piyasa #Finans #Yatırım #Analiz
1
184