
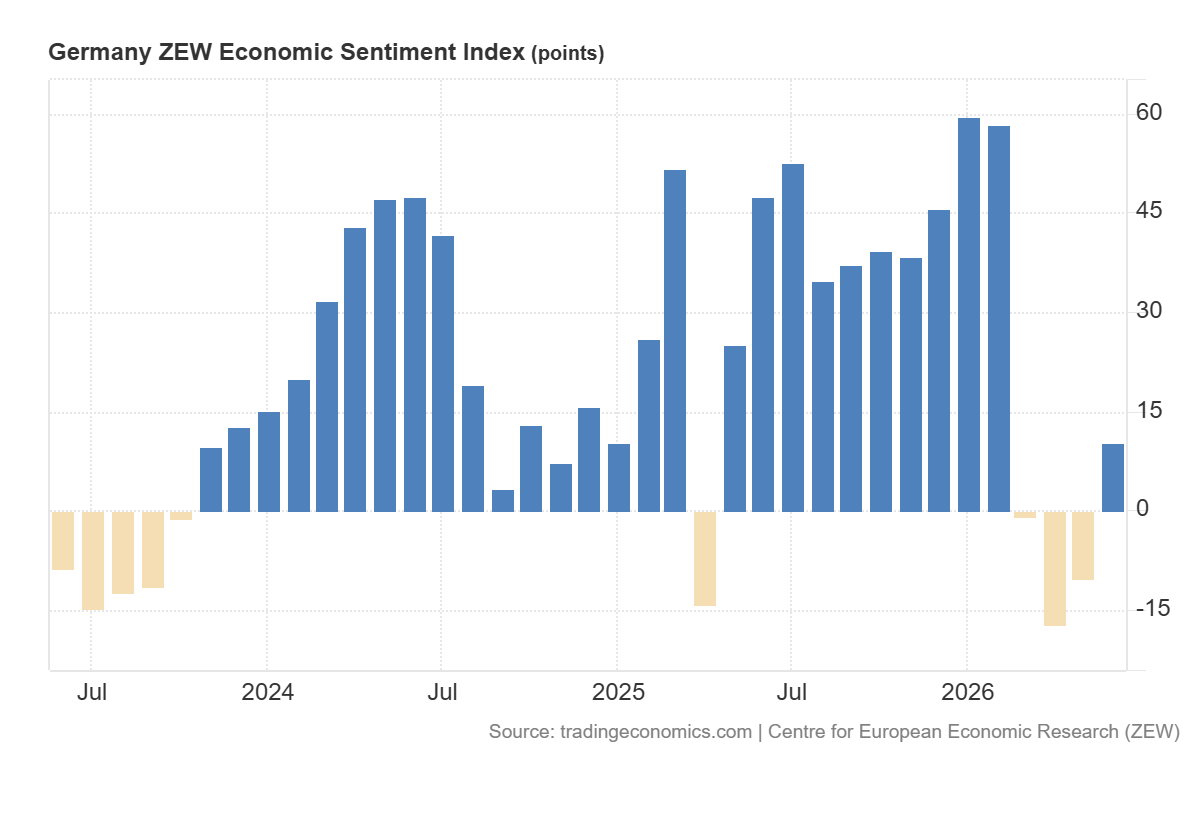
📊 Germany’s ZEW Indicator of Economic Sentiment rose by 20.7 points to 10.5 in June 2026, marking its first positive reading since March and outperforming market expectations of -6.0 [cite: Germany’s ZEW Indicator of Economic Sentiment rose 20.7 points to 10.5 in June 2026, its first positive reading since the war in the Middle East shook confidence in March, and beat market expectations of -6.0.]. The rebound is primarily driven by forward-looking optimism regarding a potential resolution to the Middle East conflict, which has softened broader energy price and inflation concerns among institutional investors. Sectoral expectations reflected this shift, with the automotive industry climbing 21.9 points, alongside steady gains in chemical ( 16.0) and mechanical engineering ( 9.2) balances, even though these aggregates remain in negative territory.
📈 Conversely, structural constraints continue to weigh on the present baseline. Germany's current economic situation assessment worsened slightly to -81, trailing the consensus expectation of -78. Additionally, the construction sector fell a further 15.2 points to -12, heavily reflecting the immediate pass-through effects of the ECB’s recent interest rate hike on June 11.
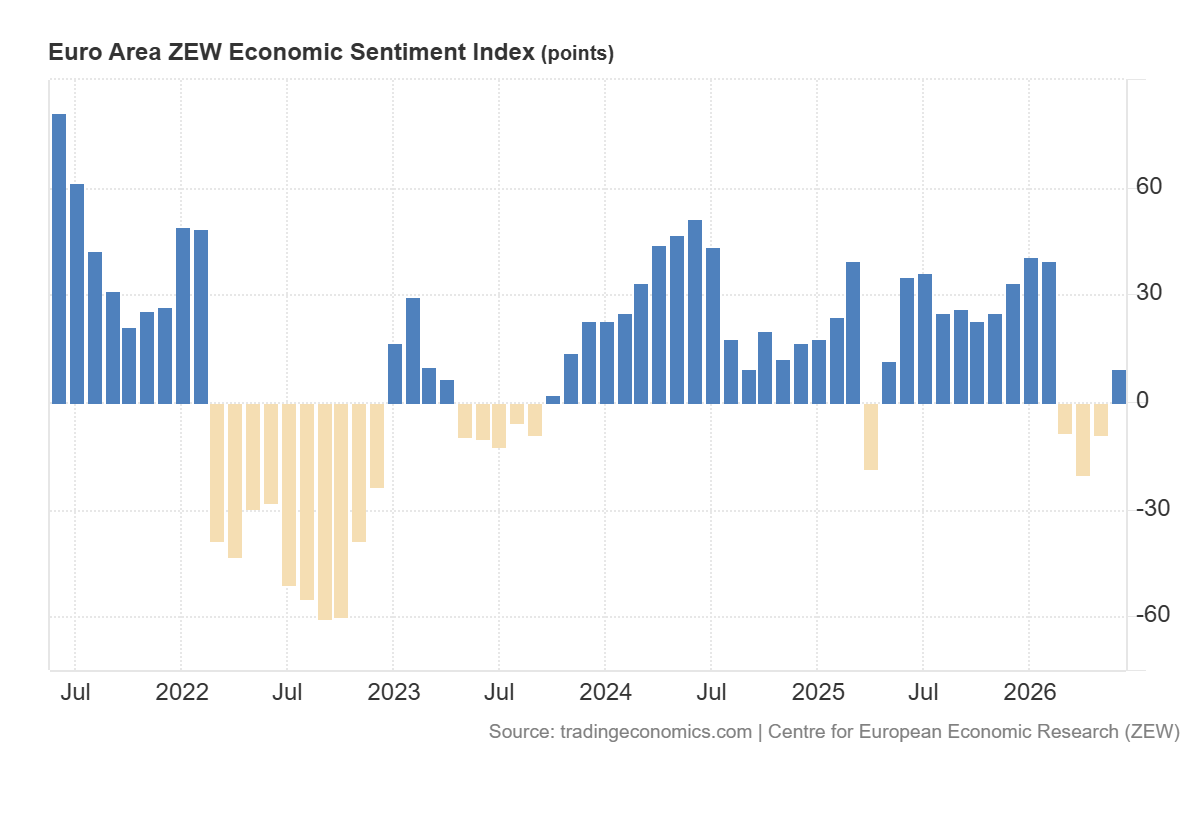
❓ Given this expanding divergence between stabilizing forward-looking sector sentiment and a deteriorating current situation baseline, how do you expect Eurozone industrial production capacity to absorb these asymmetric pressures throughout Q3?
#Macroeconomics #Germany #ZEWIndex #DataAnalytics #EconomicData #MonetaryPolicy #QuantitativeAnalysis #EconData
1
15

Today’s @CoderaAnalytics post by @AidanHorn1 summarises South African vehicle imports by engine size. Note that aggregates of cross border trade transactions are available on EconData to module subscribers. Contact us for a demo or to subscribe.

1
108

Segundo o Econdata o Casimiro é sócio de duas empresas. CazeTv e Cmiguel Producoes Artisticas Ltda
61
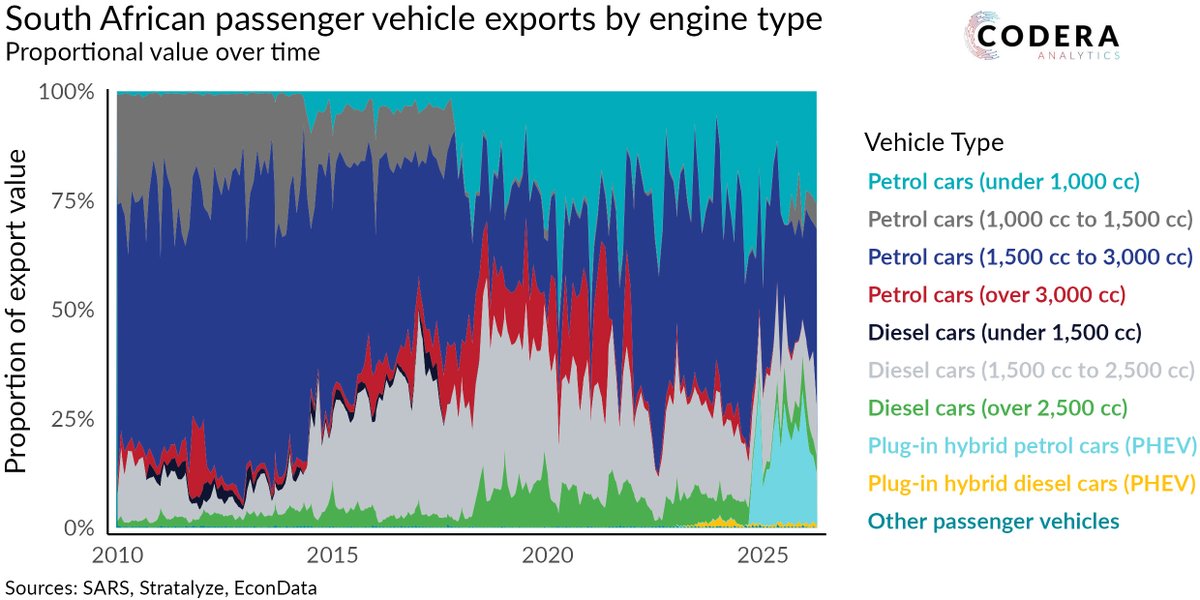
Today’s @CoderaAnalytics post by @AidanHorn1 summarises South African vehicle exports by engine size. Note that aggregates of cross border trade transactions are available on EconData to module subscribers. Contact us for a demo or to subscribe.
102
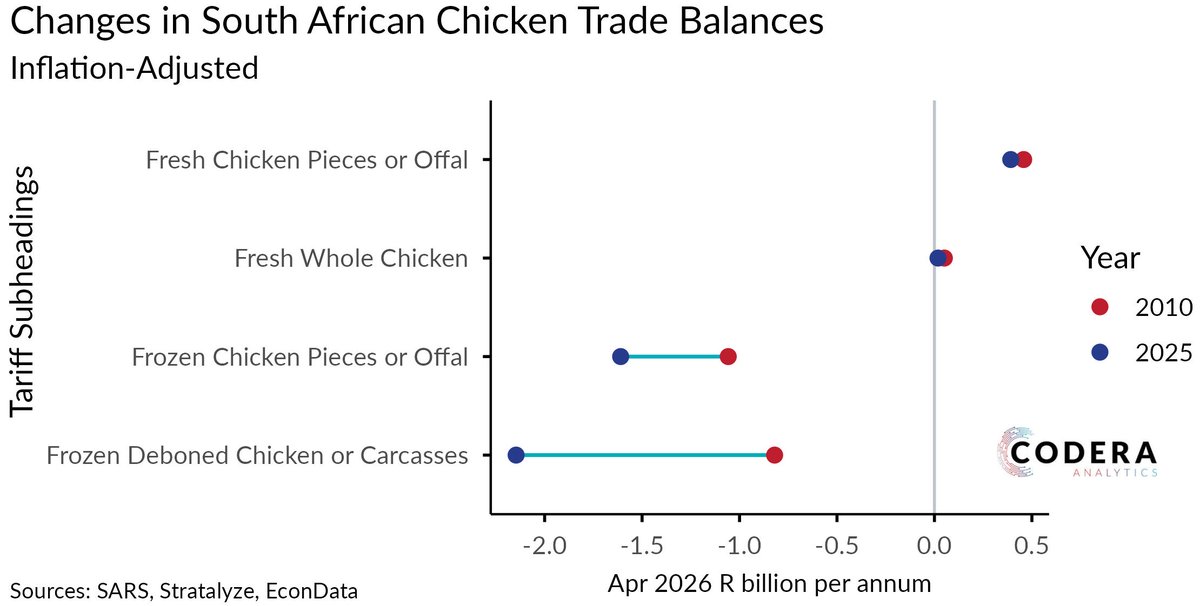
Today’s @CoderaAnalytics post by @AidanHorn1 shows that SA is a net exporter of fresh chicken but a net importer of frozen chicken. Aggregates of cross border trade transactions are available on EconData to module subscribers. Contact us for a demo or to subscribe. @Stratalyze1
55
Today’s @CoderaAnalytics post by @AidanHorn1 shows that vehicle exports have growth faster than vehicle exports for South Africa. Aggregates of cross border trade transactions are available on EconData to module subscribers. Contact us for a demo or to subscribe. @Stratalyze1

1
40

May 28
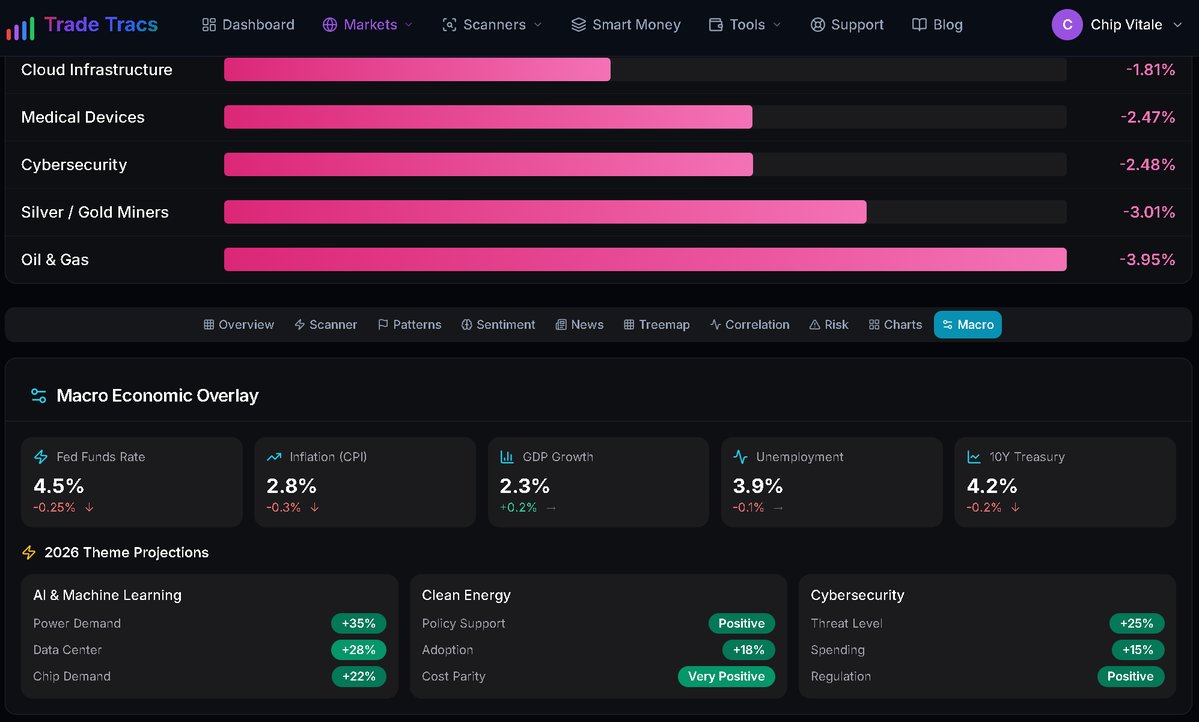
Thursday's tape is loaded! Kicking off with 8:30 AM Durable Goods, GDP, Jobless Claims & the critical PCE print.
Watch for that 0.5% PCE rise forecast to move the needle on rates. Then 10 AM New Home Sales, expected to dip to 662K.
Our Macro Overlay cuts through the noise.
#MarketBrief #EconData $SPY $QQQ
2
51

April personal income was flat, matching February's low. Spending is up, but real spending adjusted for inflation saw only a slight increase. Inflation metrics show mixed signals: PCE is softer than expected month-over-month but higher year-over-year. #EconData #Inflation
2
2
136
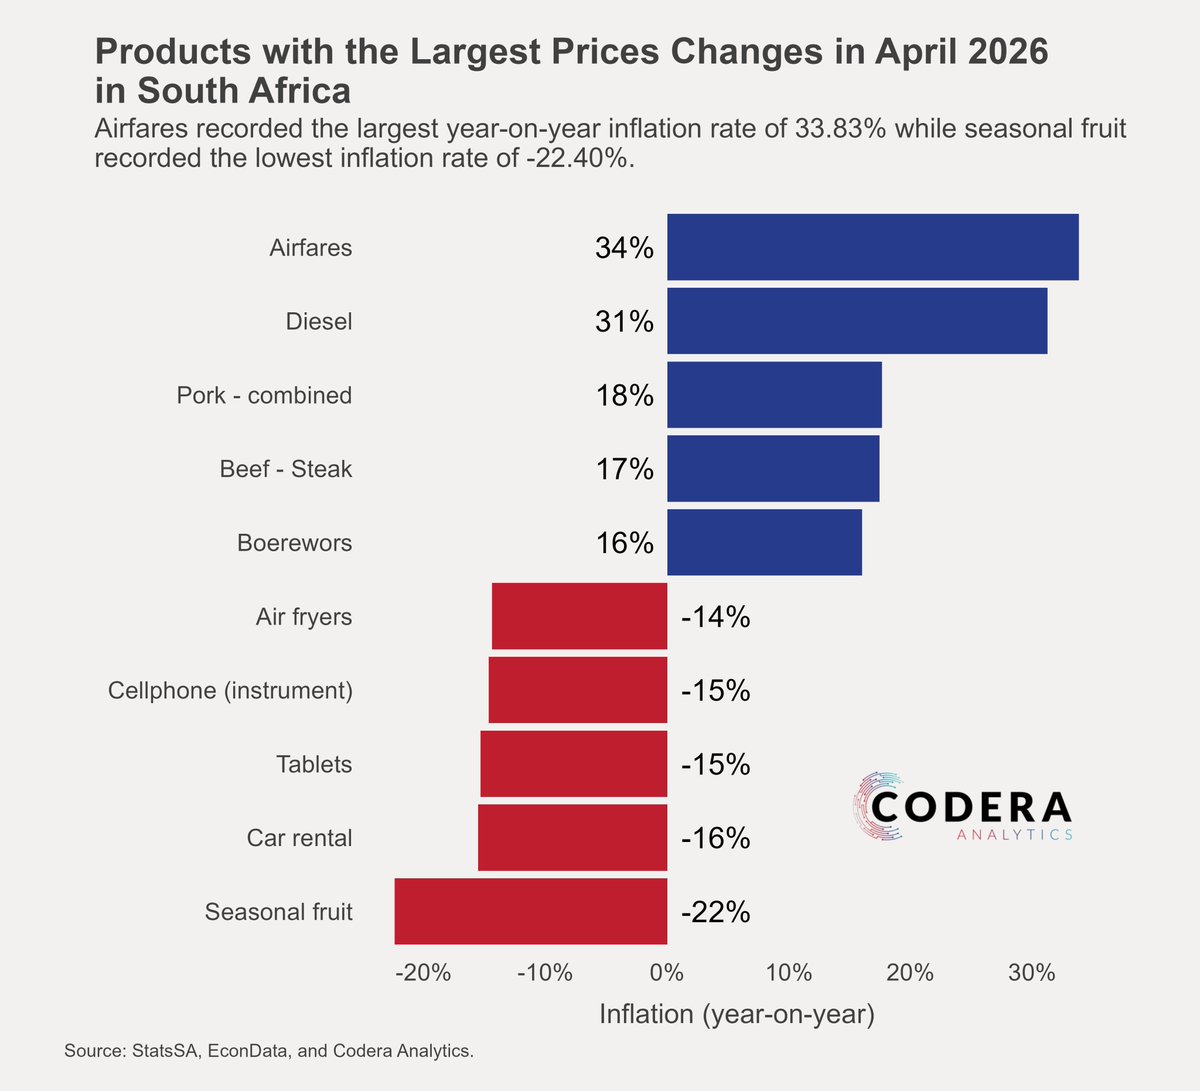
Today’s @CoderaAnalytics post by Oliver Guest shows the largest price changes in South Africa’s CPI in April 2026. EconData makes this kind of analysis easy and automatable. Contact us for a demo.
1
2
64
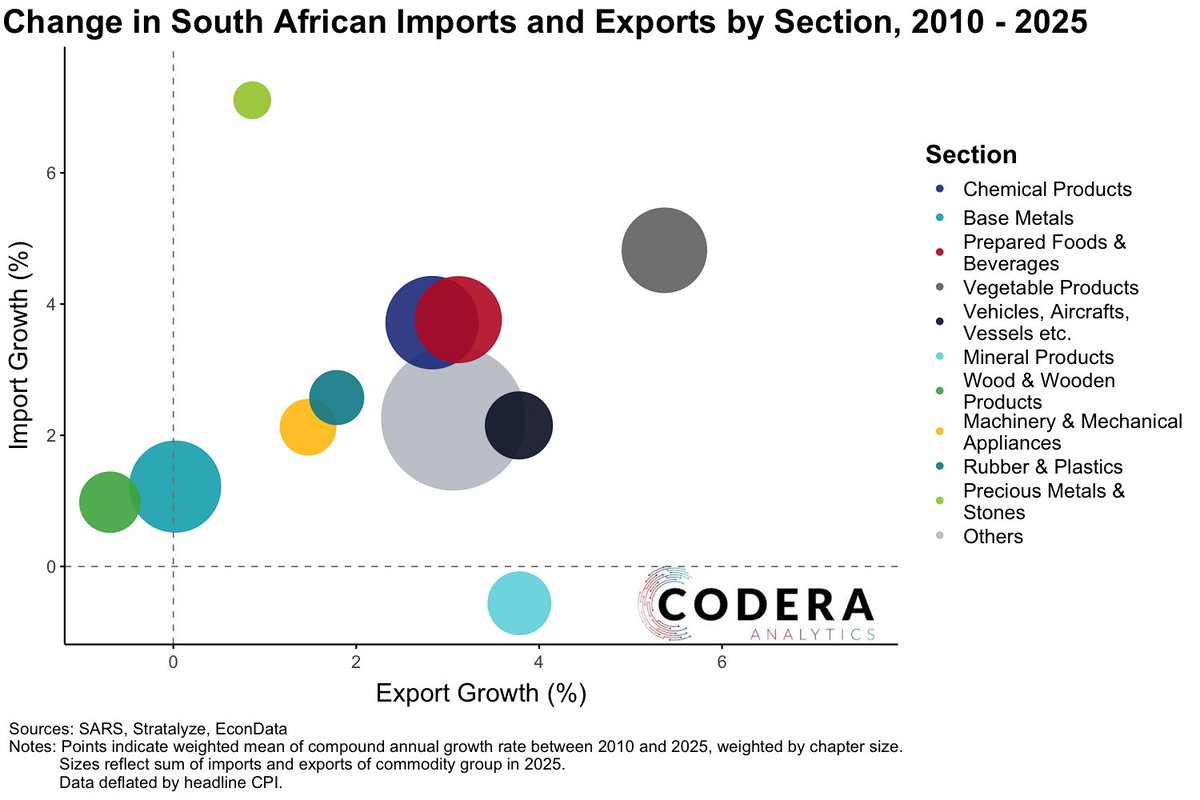
Today's @CoderaAnalytics post by Jan Smuts shows that vegetable products have experienced the largest overall increase in trade in SA since 2010. Note that aggregates of cross border trade transactions are available on EconData. @Stratalyze1
1
3
81
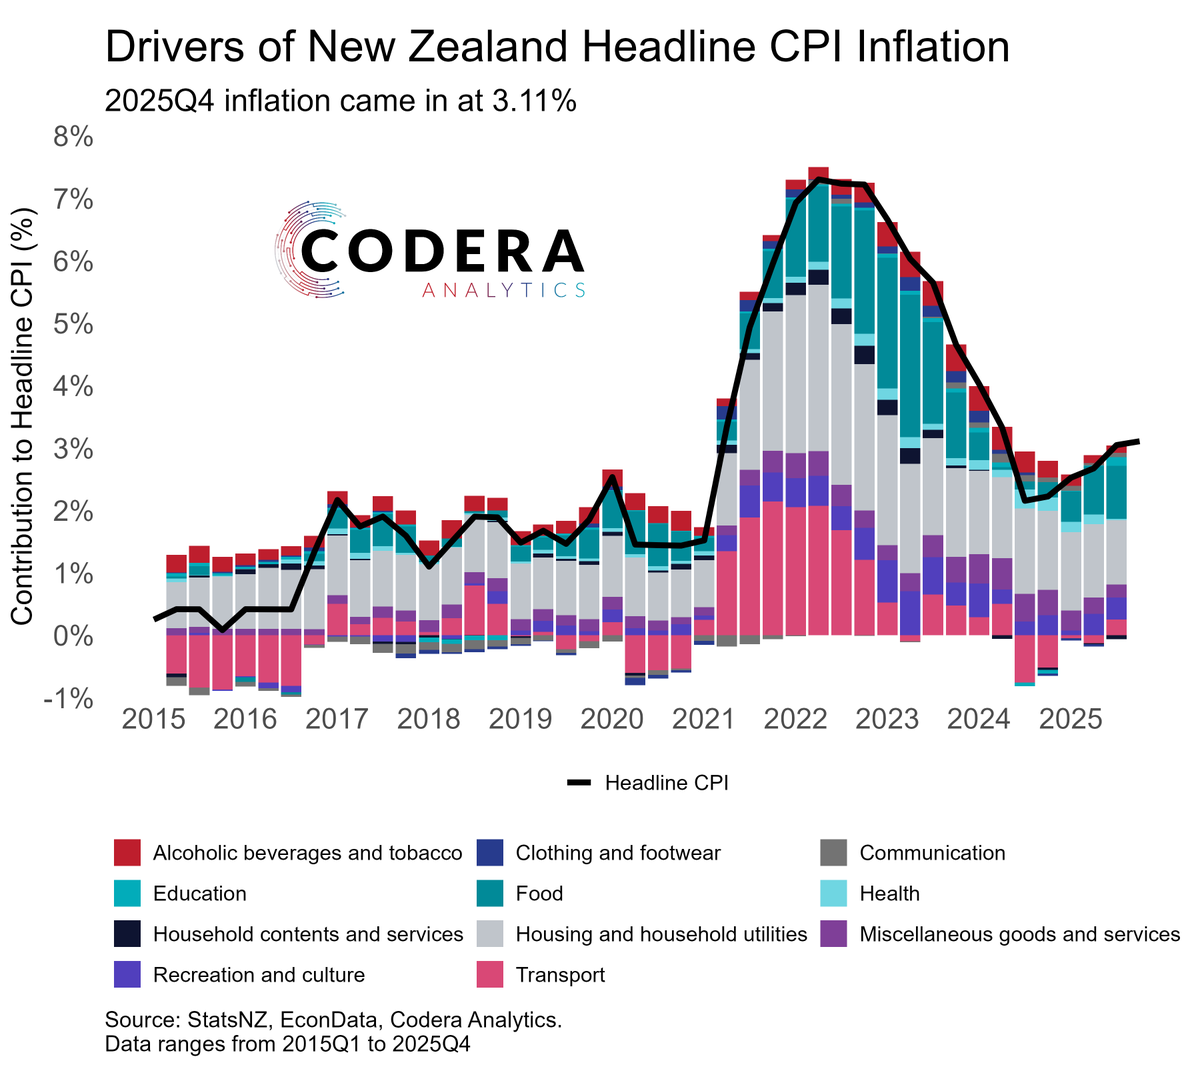
We are pleased to announce that we have added detailed CPI data for New Zealand on EconData, including detailed CPI component weights. This makes it easy to build models of disaggregated inflation and automate related macroeconomic analysis. @CoderaAnalytics
2
3
114
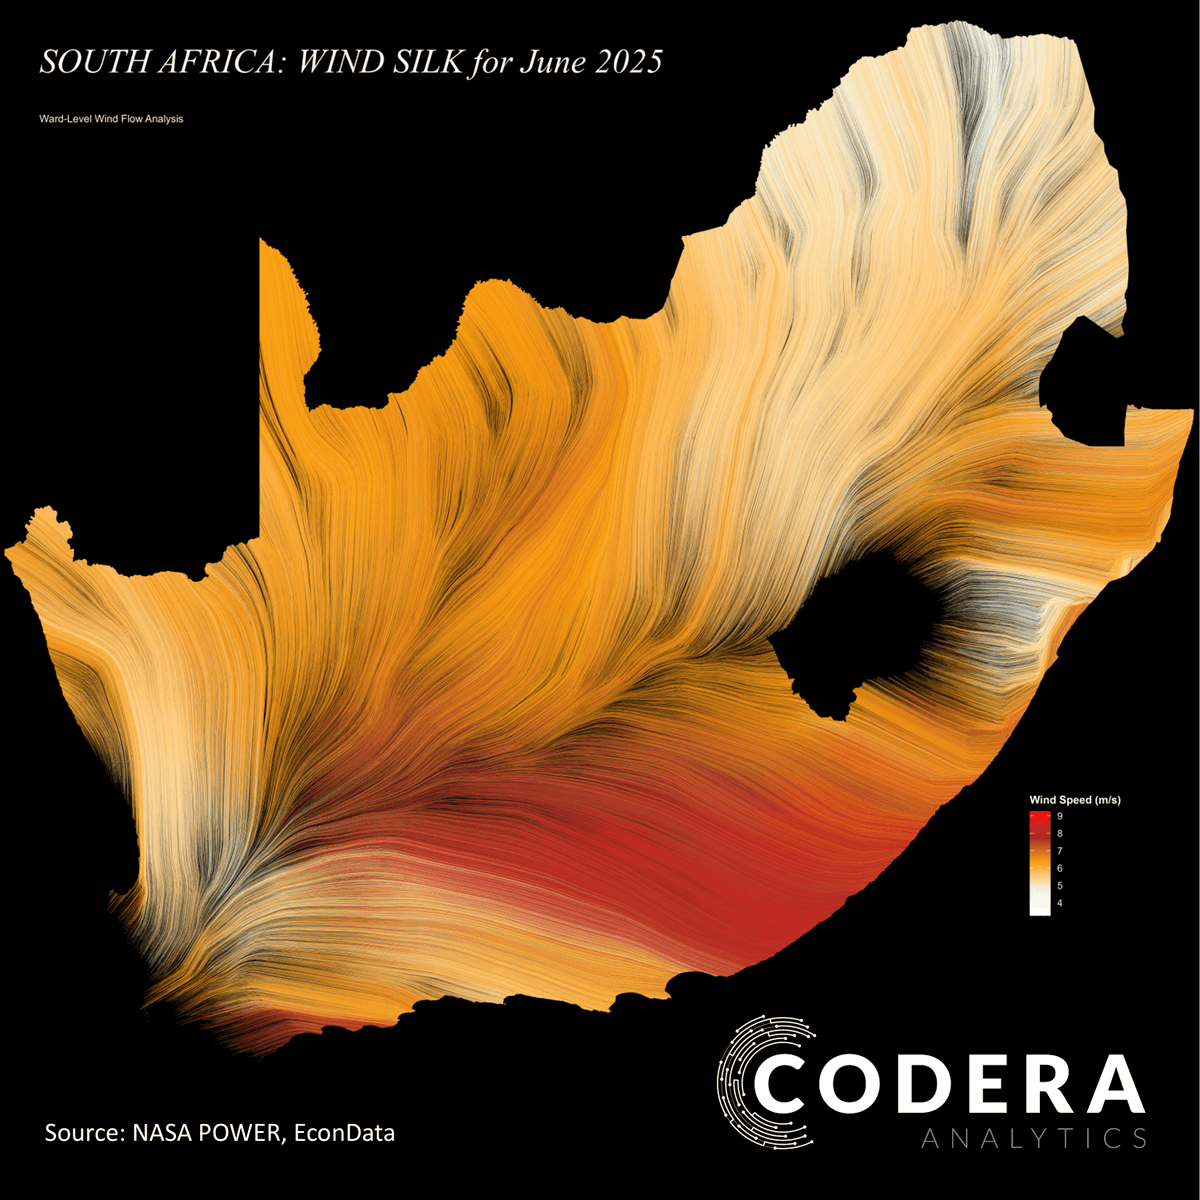
Today’s @CoderaAnalytics post by Riaan Grobler shows wind intensity and direction in South Africa in winter 2025.
Codera has added spatial climate data to our EconData platform. Contact us for a demo.
1
3
4
210
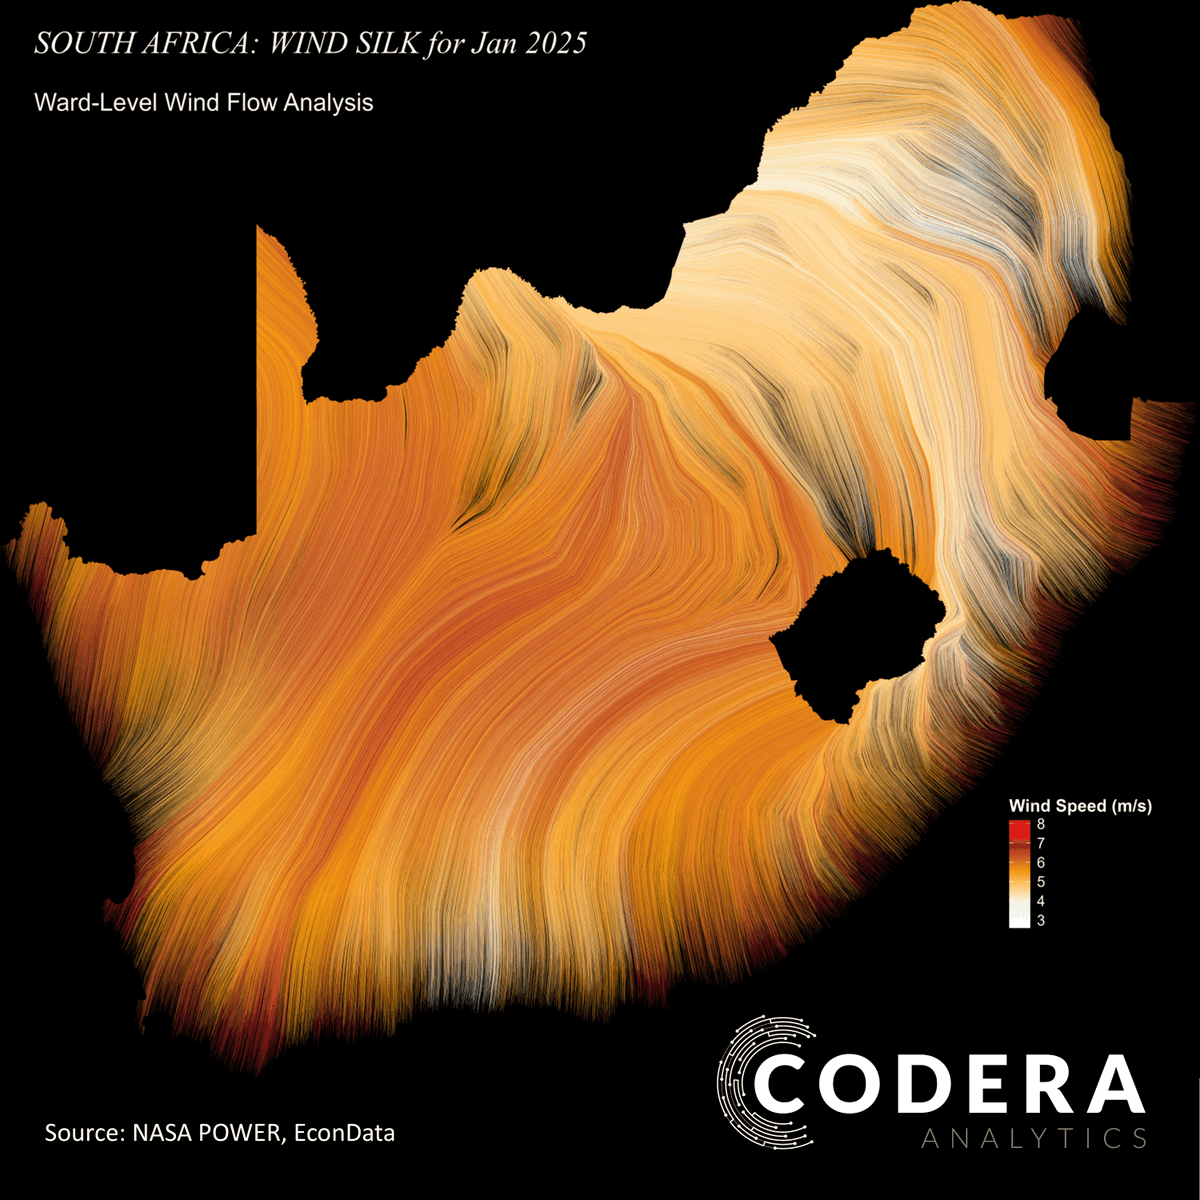
Today’s @CoderaAnalytics post by Riaan Grobler shows wind intensity and direction in South Africa in January 2025.
Codera has added spatial climate data to our EconData platform. Contact us for a demo.
1
2
5
226
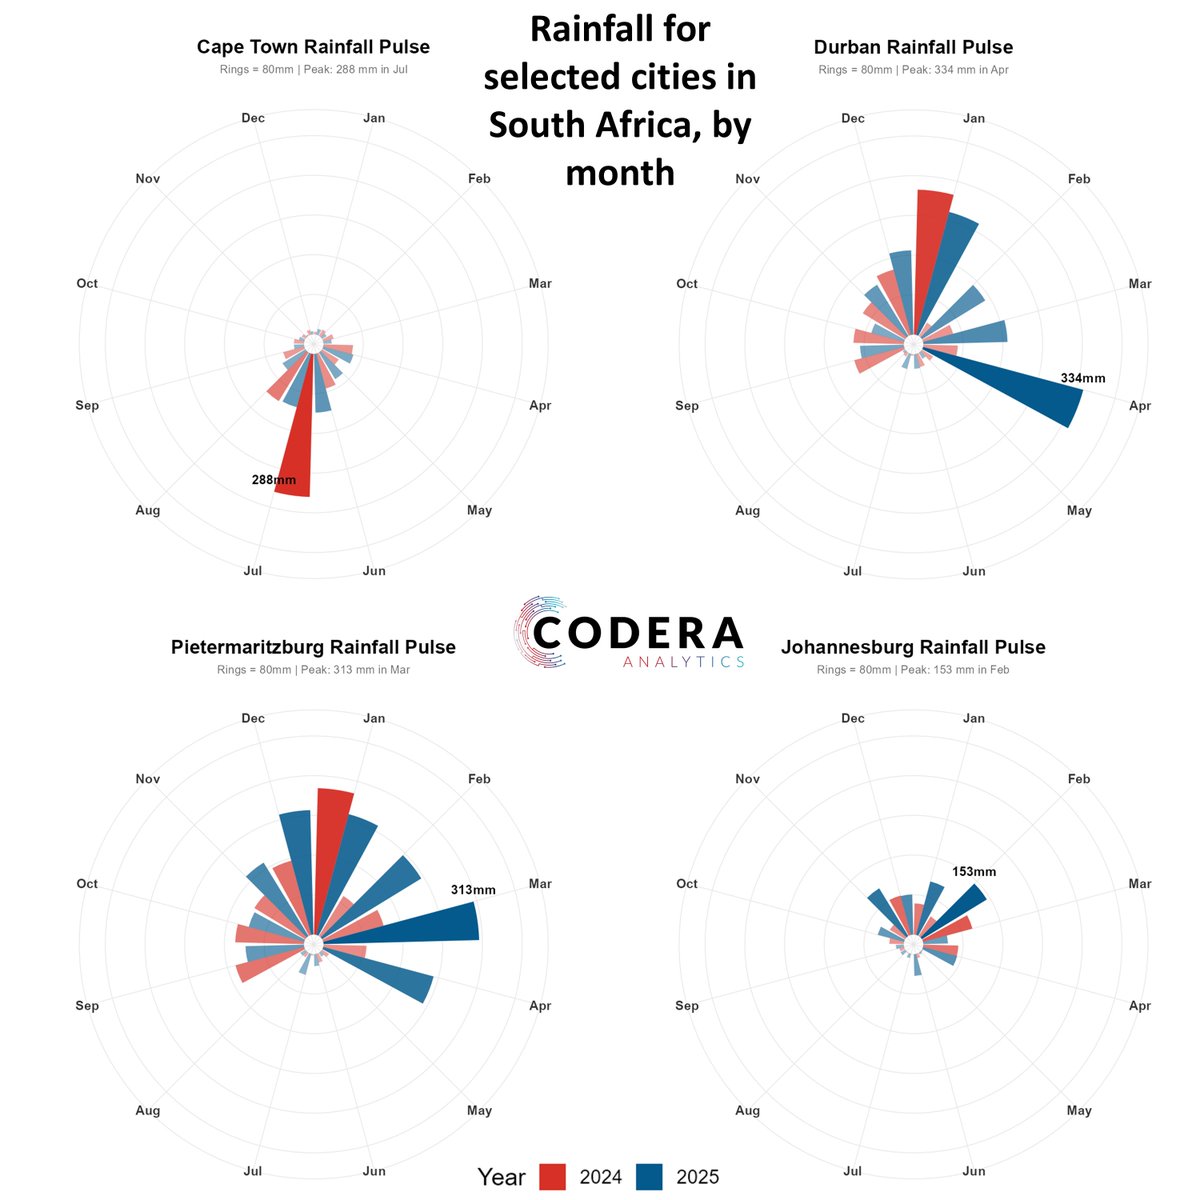
Today’s @CoderaAnalytics post by Riaan Grobler shows the monthly distribution of rainfall in selected cities in South Africa in 2024 and 2025.
Codera is working on adding rainfall data to our EconData platform. Contact us for a demo.
1
3
132
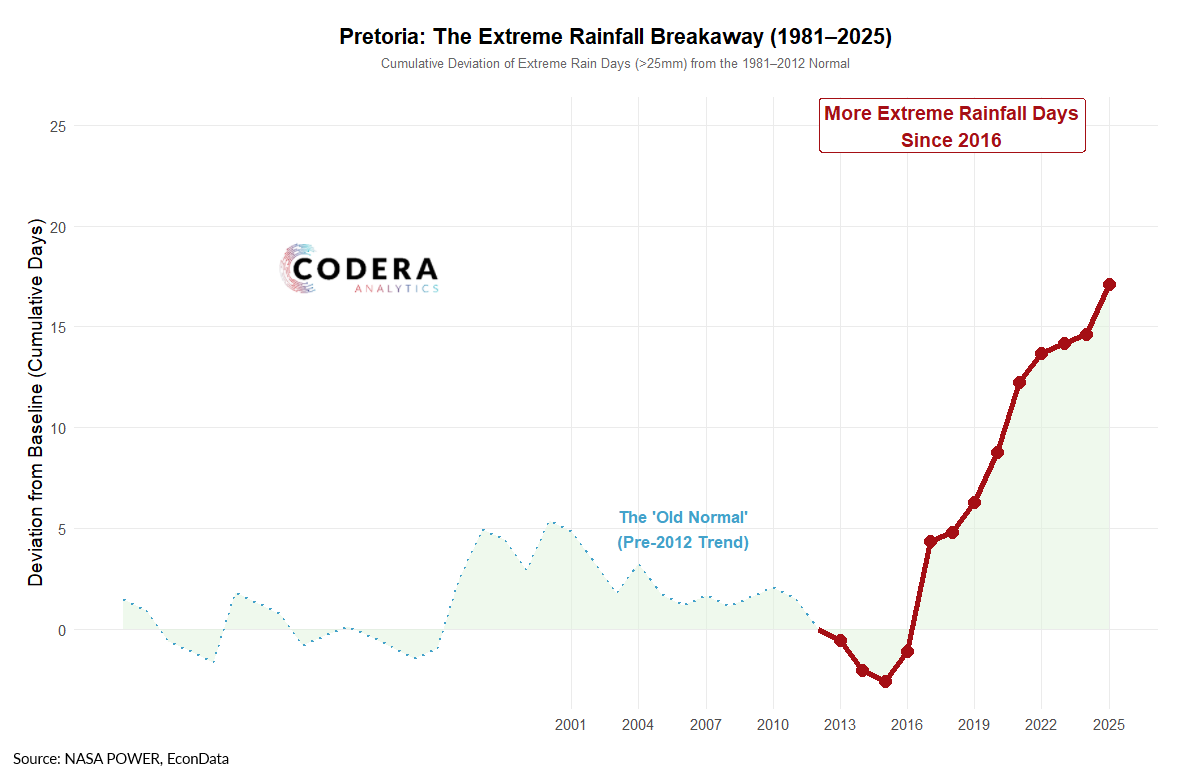
Today’s @CoderaAnalytics post by Riaan Grobler shows that there has been a recent increase in extreme rainfall days (>=25mm) in Pretoria compared to history. Codera is working on adding climate data to our EconData platform. Contact us for a demo.
1
2
108
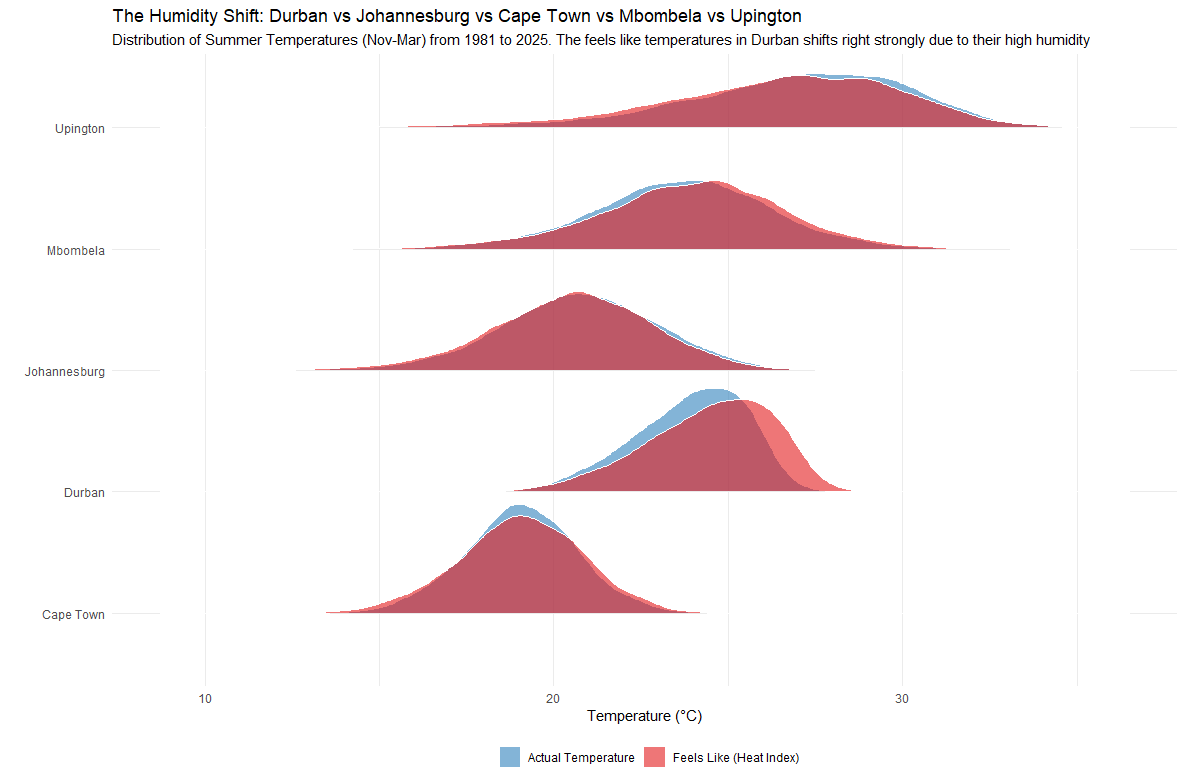
Today’s @CoderaAnalytics post by Riaan Grobler compares the variation in summer temperatures in selected South African cities to humidity-adjusted temperatures. Codera is working on adding spatial climate data to our EconData platform. Contact us for a demo.
1
2
145
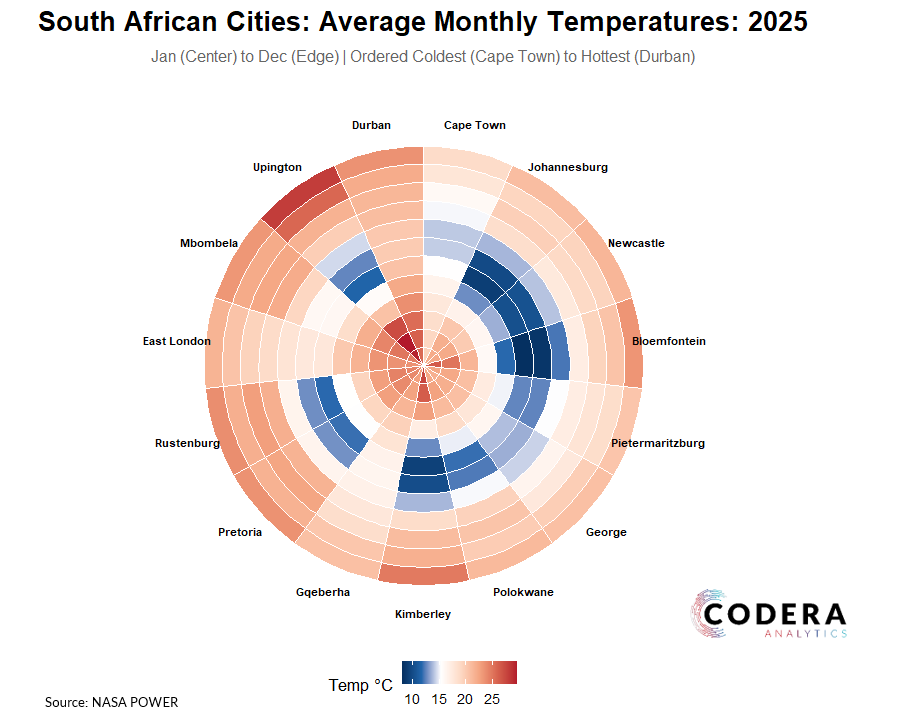
Today's post by Riaan Grobler summarises South African city temperatures over the course of 2025. @CoderaAnalytics is adding spatial temperature and rainfall data to our EconData platform. Contact us for a demo.
1
2
1
178
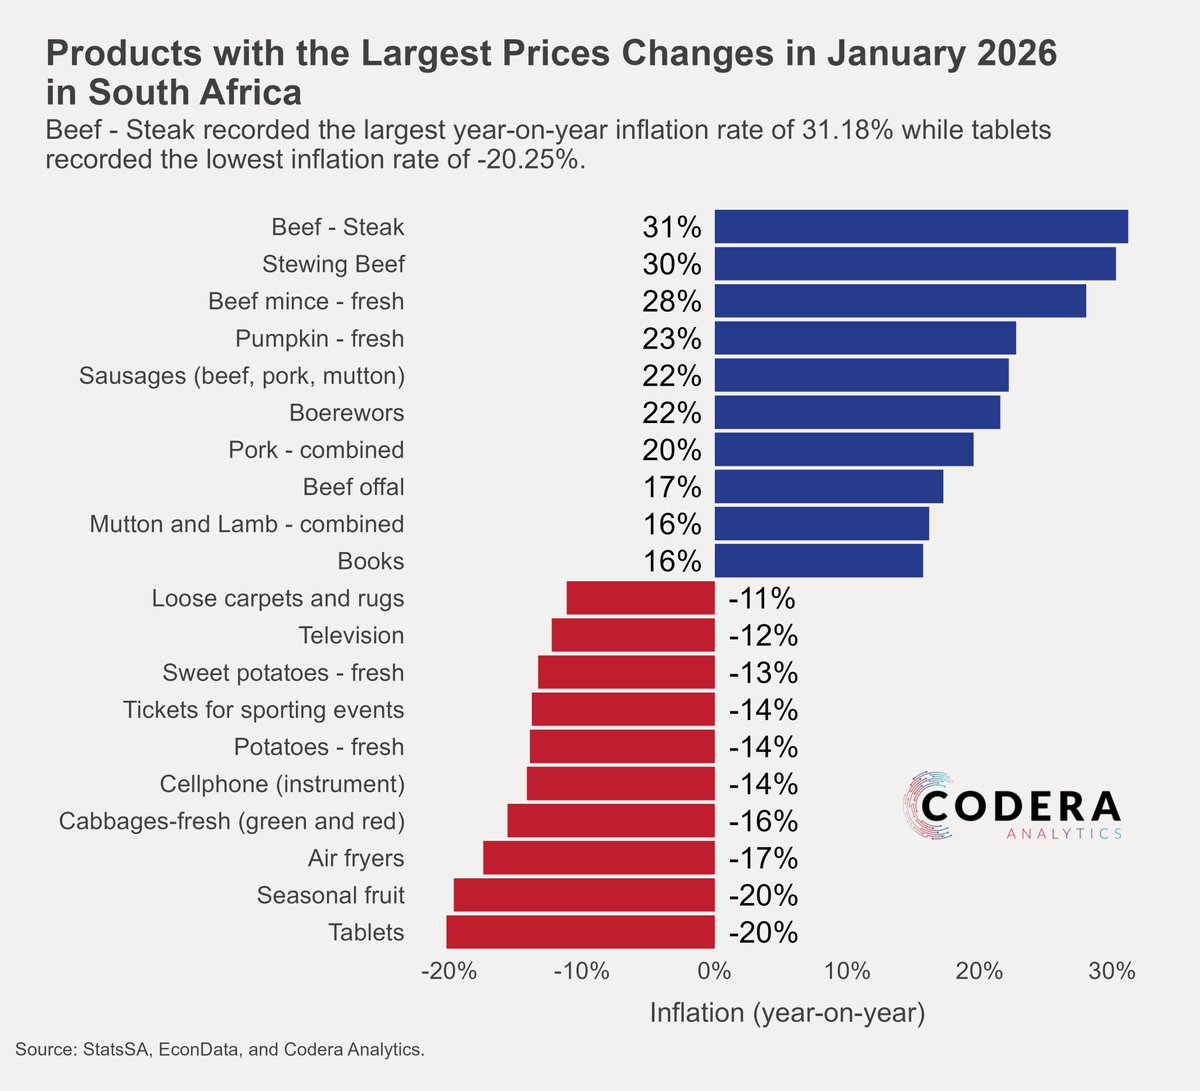
Today's @CoderaAnalytics post by Oliver Guest shows the largest price changes in South Africa's CPI in January 2026.
EconData makes this kind of analysis easy and automatable. Contact us for a demo.
3
108
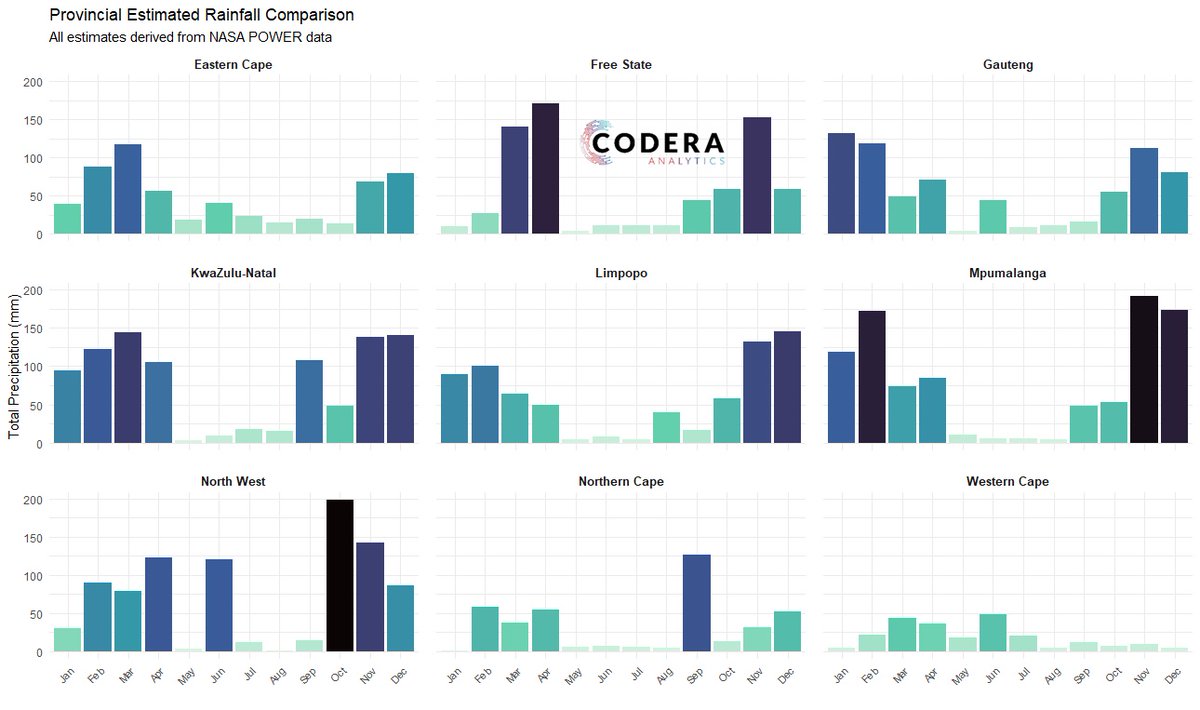
Today's @CoderaAnalytics post by Riaan Grobler shows monthly rainfall by month in each province in 2025. Contact us for a demo of our EconData spatial data module.
1
1
128

Feb 17
🍀✨️Tomorrow (Tuesday, 5:30 AM PT) features a massive "Data Dump" including Retail Sales and the Empire State Mfg Index. Expect immediate volatility at the market open. Source: NY Fed #EconData @REALCULTNEWS
4
70