
Wishing everyone an amazing #KGC2026! 🎓✨
Counting down to Friday, May 8, where yWorks joins the Tools & Demo Track. Join to see the latest in #GraphVisualization and how to optimize your stack.
Explore our Knowledge Graph Demo: 👉 yfiles.com/demos/showcase/kn…
#KnowledgeGraph
4
63

Apr 6
몇주간 주말을 이용해서 만든 프로젝트를 공유합니다.
kpopatlas.com
K-Pop Atlas는 K-pop 그룹, 세대, 그리고 그들의 타임라인을 시각적으로 탐험할 수 있도록 도와주는 인터랙티브 탐색 도구입니다.
몇 년 전 K-pop에 입문하면서 “4세대 그룹”, “최애(bias)” 같은 새로운 용어들을 배우게 되었고, 동시에 그룹, 소속사, 세대가 어떻게 서로 연결되어 있는지 이해하려고 여러 정보를 찾아보게 되었습니다. 좋은 콘텐츠를 제공하는 사이트들은 많았지만, 전체 구조를 한눈에 보여주는 곳은 찾기 어려웠습니다.
비교적 늦게 입덕한 팬으로서(ONCE, ARMY, DIVE), 각 그룹이 시간에 따라 어떻게 발전해왔는지, 주요 활동과 전환점, 그리고 서로 간의 관계를 더 잘 이해하고 싶었습니다. 그래서 직접 만들어보게 되었습니다.
AI를 이용해 공개된 데이터를 모으고, 구조화하여 그룹과 소속사 간의 관계를 정리하고, 세대별로 흥미로운 흐름과 타임라인을 구성할 수 있었습니다. K-Pop Atlas는 이러한 연결 구조를 그래프로 시각화하고, 지속적으로 확장되는 데이터를 기반으로 그룹의 히스토리를 인터랙티브 타임라인으로 보여줍니다.
K-pop을 처음 접하는 분들이나, 지금 좋아하는 그룹을 넘어 더 넓게 탐험해보고 싶은 분들께 이 도구가 조금이나마 도움이 되었으면 합니다. 모바일에서도 동작하지만, 보다 자유로운 탐색을 위해서는 데스크탑 환경에서의 사용을 추천드립니다.
#Kpop #KpopFans #MusicDiscovery #한국 #DataVisualization #GraphVisualization #입덕 #케이팝 #케이팝팬 #케이팝추천 #신곡추천 #SideProject #IndieDev #IndieMaker #UXDesign #ProductDesign #WebApp #AI #AIDriven #GenerativeAI
1
4
384

Understanding trigonometry becomes easier when you visualize the graph.
#Trigonometry #SinGraph #MathVisualization #Maths #MathEducation #MathCommunity #GraphVisualization #STEM #MathTeacher #Engineering #PhysicsMath #Calculus #Precalculus #MathStudents #LearnMath #MathIsFun #MathArt #Mathematics #STEMLearning
1
2
4
740
Introducing yFiles Graphs for @streamlit🚀 The free component that brings superior #GraphVisualization right into your #Python Streamlit apps.
Stop struggling with messy #diagrams. Build beautiful, interactive, data-driven #applications!
🔗 yworks.com/products/yfiles-g…
1
4
81

23 Oct 2025
🚀 @Nitrograph — high-speed, high-fidelity graph visualization.
Handle millions of nodes with real-time rendering ⚡
Designed for developers, analysts, and data lovers.
Fast. Scalable. Beautiful.
community.nitrograph.com/
REF CODE: I76V5NFK
#Nitrograph #GraphVisualization #DevTools
2
19

17 Jul 2025
📣 New in Perspectives 13.3: Kuzu Graph Database Support!
Perspectives now supports Kuzu, a lightweight, open-source graph database with Cypher support and optional commercial backing. This embeddable database runs locally on desktops and mobile devices—no server required. With our new Kuzu connector, you can analyze and visualize graph data using the full power of Perspectives, while avoiding the complexity and cost of traditional commercial graph databases.
🆓 Start your free trial of Perspectives today: bit.ly/40g9Hzn
#kuzu #OpenSource #graphdatabases #Cypher #CypherQueries #GraphDB #graphvisualization #datavisualization

3
4,479
Heatmaps are now available in Data Explorer for @neo4j v2! Use color-coded maps to visualize patterns in your graph and gain new insights.
Analyze your data with ease and try it free: yworks.com/neo4j-explorer
#Neo4j #DataExplorer #GraphVisualization #DataScience
2
6
615
29 Apr 2025
Yes, we're still talking about it! Tom Sawyer Explorations 1.2 was released on April 16th and features many updates:
The best graph layout just got better. Hierarchical drawings now deliver clearer, more readable visualizations for complex data structures, and improved layout algorithms reduce edge crossings 30-50% on average in orthogonal edge routing making it easier to interpret relationships and dependencies in your data. These refinements ensure cleaner, more structured diagrams helping users quickly uncover insights and navigate intricate networks with ease. Try it for free and see what all the hype is about: bit.ly/4lIykhb
#graphvisualization #graphtechnology #graphlayouts #tomsawyersoftware #datavisualization

ALT Reduced crossings in orthogonal clustering
2
32
From text to interactive #diagrams — powered by yFiles.
🧠✨ Discover how Splotch leverages #AI and yFiles to create smart, dynamic #visualizations — including the key challenges and solutions behind the process.
yworks.com/blog/interactive-…
#DataVisualization #GraphVisualization
3
77

4 Apr 2025
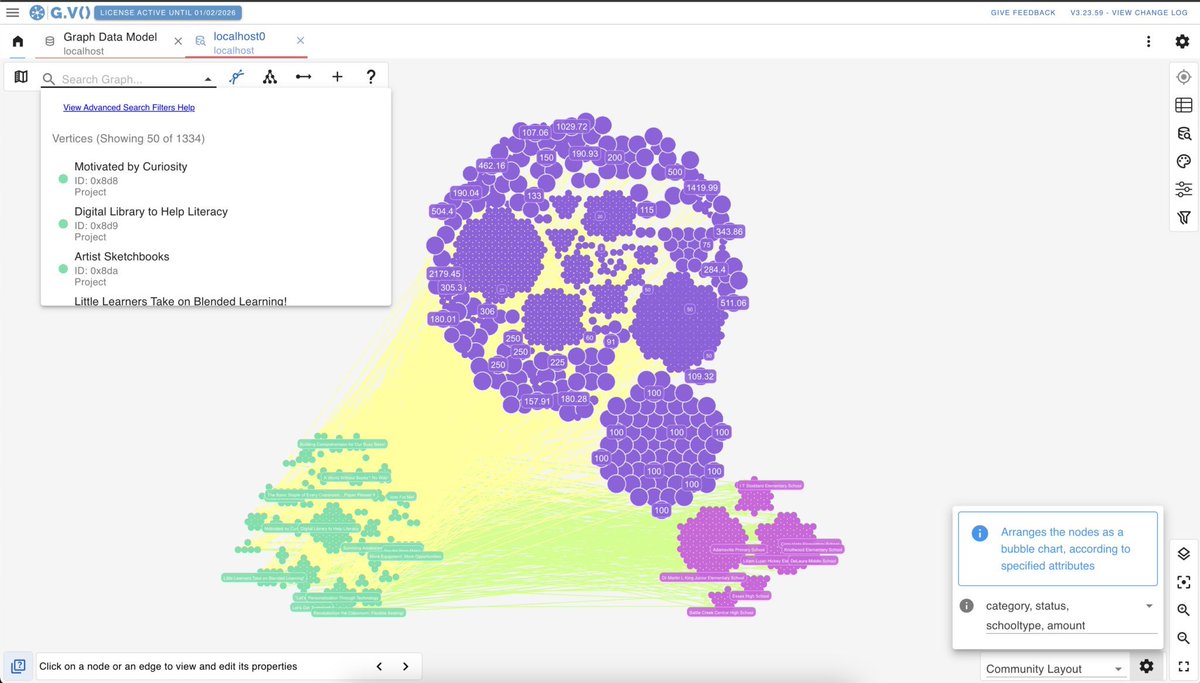
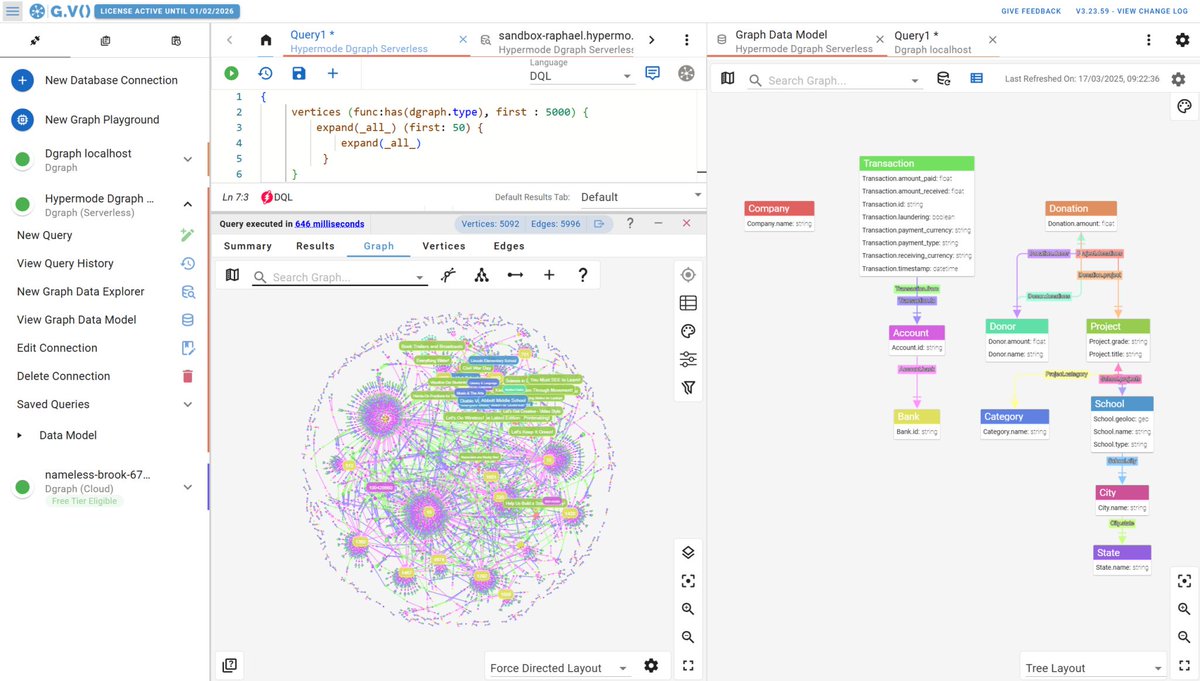
Enhance your Dgraph experience with G.V()'s interactive visualization features. Explore complex data relationships intuitively and share insights seamlessly.
Learn how: hypermode.com/blog/G-V-bring…
#DataExploration #Dgraph #GraphVisualization #GV
1
2
500
2 Apr 2025
Exciting news! G.V() now supports Dgraph, bringing interactive graph visualization to your data exploration toolkit. Connect, query, and visualize your Dgraph data effortlessly.
Discover more: hypermode.com/blog/G-V-bring…
#GraphVisualization #Dgraph #GV
1
2
4
553
21 Mar 2025
Our newest blog discusses Javascript Graph Visualization. Learn how to build dynamic Javascript graph visualizations to explore data, from social networks to network topologies, with powerful tools and libraries. 📚
#javascript #graphvisualization #to...
hubs.li/Q03cZc310
2
50
6 Mar 2025
New in Tom Sawyer Perspectives 13.2: Data exploration with Cypher and Gremlin queries is now more flexible and developer integration easier. End users can now enter their own Cypher or Gremlin queries directly, enabling more powerful and customized graph analysis. For developers, adding this capability is now seamless—with a built-in, ready-to-use dialog that requires no custom code. This update empowers users with greater control over their queries while significantly reducing development effort. 👩💻 Learn more: bit.ly/3XmaUDW
#graphvisualization #cypher #gremlin #developerintegration #tomsawyersoftware #developer #graphanalysis

2
30
24 Feb 2025
Tom Sawyer Explorations enhances risk management, compliance, and #frauddetection with advanced graph visualization and #analytics. Learn more: bit.ly/4352m7S #knowledgegraphs #graphvisualization #graphtechnology

1
3
44
14 Jan 2025
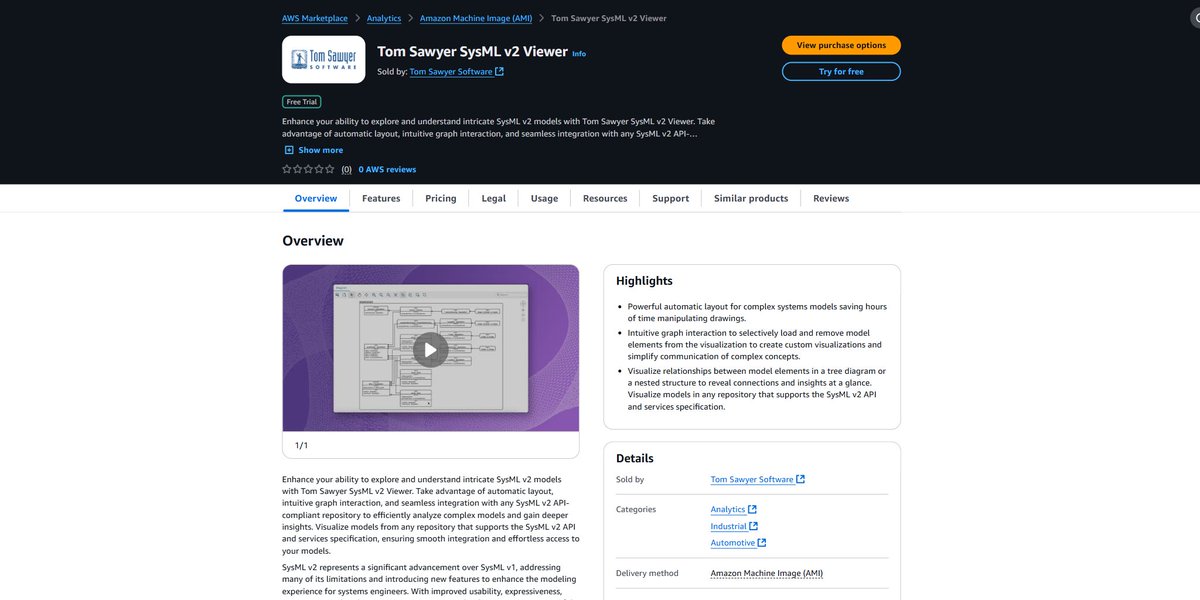
Save hours with powerful auto-layouts and intuitive visualizations! How? Try a FREE trial of Tom Sawyer SysML v2 Viewer on #AWS! Simplify complex systems and uncover hidden insights here: go.aws/3WjFTj8 #SysML #MBSE #graphvisualization #graphtechnology
1
49

18 Dec 2024
Easily manage multiple nodes and edges with the new expandable side panel — view, search, filter, and sort properties all in one place. You can even export your data directly from there! Learn more: eu1.hubs.ly/H0f3Yl-0
#GraphTechnology #GraphVisualization #Technology
2
4
245

8 Dec 2024
#AdventOfCode 2024 - Day 8
Easy one today. Indexes, MERGEs #Cypher and #GraphVisualization with #Neo4j #Bloom
puzzle: adventofcode.com/2024/day/8
solution: github.com/halftermeyer/AoC_…
4
211
Big thanks to @neo4j for hosting us at #NODES2024! 🙌 Dr. Benjamin Niedermann shared insights on Advanced #GraphVisualization in #Jupyter Notebooks using #Neo4j & GDS for powerful data storytelling.
🔗 Notebook on Colab: colab.research.google.com/dr…
📺 Watch: youtu.be/pIXFd58uZhQ
6
104
📺 Have you checked out our #YouTube channel @yWorksTube? We share recorded #webinars, quick #tutorials, videos on how to use our tools and products, and much more. Visit, subscribe, and stay updated! 🎥✨
youtube.com/user/yWorksTube
#Graphs #GraphVisualization #DataVisualization
2
73
24 Sep 2024
As companies accumulate more data, using it effectively for informed #decisionmaking becomes increasingly challenging.
Get to know how graph databases and #graphvisualization can transform the way organizations access and gain actionable insights: eu1.hubs.ly/H0ct3M40
2
91