
Mar 22
Interpolation is a method used to estimate unknown values within the range of a known data set. It is widely applied in data science, engineering, and computer graphics to reconstruct missing data points or create smooth transitions between values. Choosing the right interpolation technique is important, as different methods are suited for different types of data. Common methods include linear, polynomial, spline, and radial basis function interpolation, each with its own trade-offs in accuracy and computational efficiency.
✔️ Fills in missing values and improves data continuity
✔️ Creates smooth curves for visualization and modeling
✔️ Used in image processing, signal reconstruction, and geographic data
✔️ Enhances machine learning features and numerical methods
❌ Can introduce errors if the method doesn't fit the data
❌ High-degree polynomial interpolation may cause oscillations
❌ Extrapolation beyond known points is often unreliable
❌ Some methods may smooth out important variations
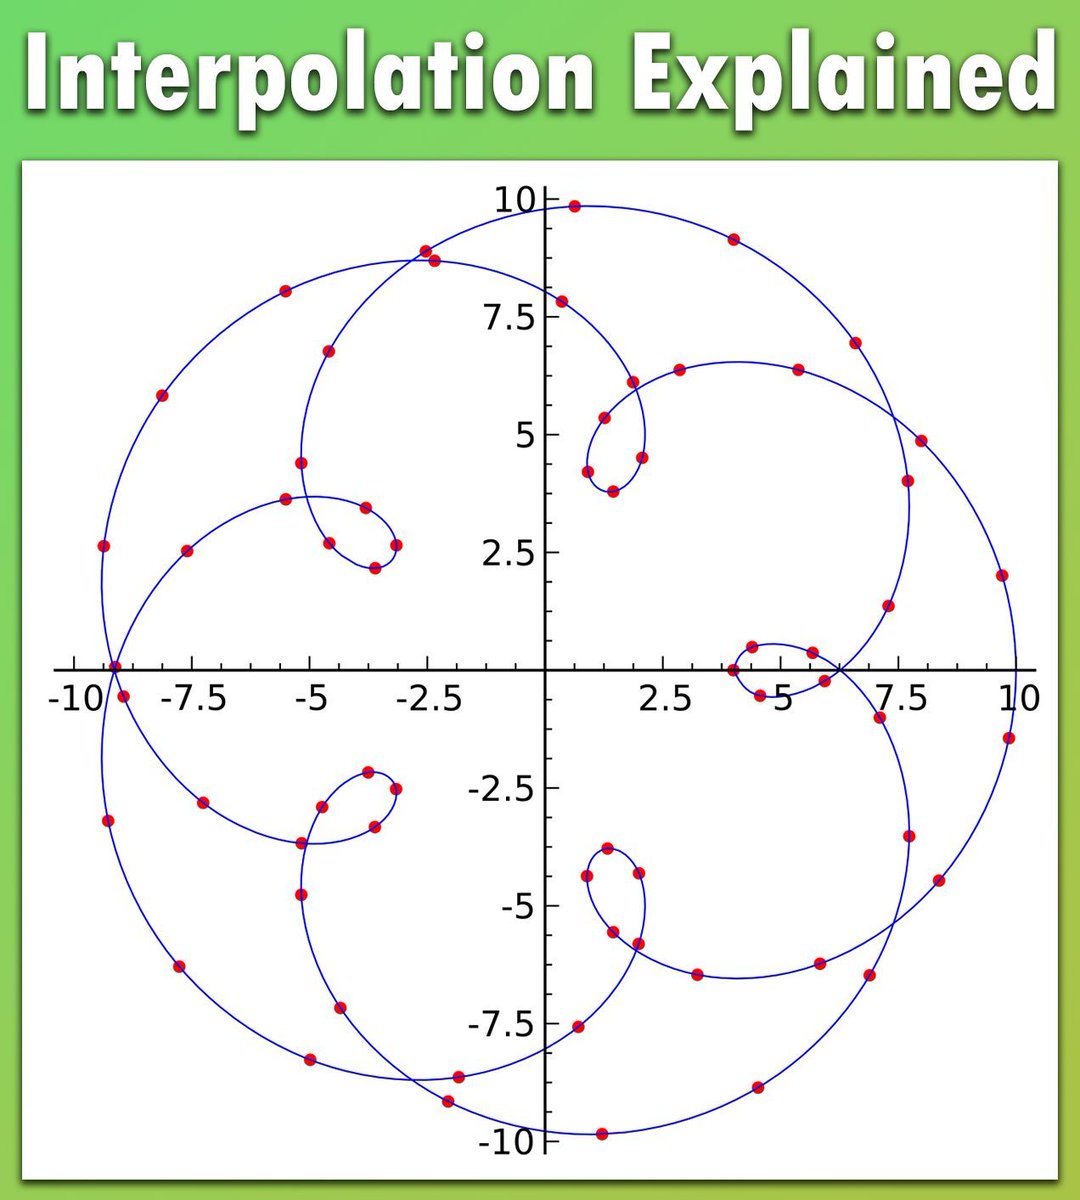
The visualization below shows interpolation on an epitrochoid, where red points are known values, and blue curves connect them with simpler polynomial formulas. This demonstrates how interpolation approximates complex structures while preserving patterns. Image adapted from Wikipedia: en.wikipedia.org/wiki/Interp…
🔹 R: The approx() and spline() functions handle linear and spline interpolation, while akima provides bicubic interpolation for 2D data.
🔹 Python: The scipy.interpolate module offers interp1d for linear and spline interpolation, griddata for multidimensional data, and Rbf for scattered data.
Want to learn more about Statistics, Data Science, R, and Python? Join my newsletter for valuable insights! Learn more: statisticsglobe.com/newslett…
#DataViz #RStudio #datastructure #RStats #Data #programming
2
9
38
1,605
Feb 20
Multivariate interpolation estimates unknown values based on multiple variables, making it useful in physics, finance, and machine learning. It allows for smoother approximations and more accurate predictions in multidimensional spaces. Common methods include bilinear, bicubic, radial basis function (RBF), and kriging interpolation, each suited for different data structures, accuracy needs, and computational efficiency. Selecting the right method depends on factors such as data smoothness, sparsity, and dimensionality.
✔️ Helps estimate missing values in multi-variable data sets
✔️ Improves accuracy in simulations, spatial modeling, and scientific computing
✔️ Supports applications in computer graphics, meteorology, and geostatistics
✔️ Enables better surface and volume reconstructions in 3D modeling
❌ More computationally intensive than single-variable interpolation
❌ Can introduce errors if the method does not fit the data structure or distribution
❌ High-dimensional interpolation may suffer from the curse of dimensionality, increasing complexity and reducing accuracy
❌ Some methods, like kriging, require careful parameter tuning for optimal results
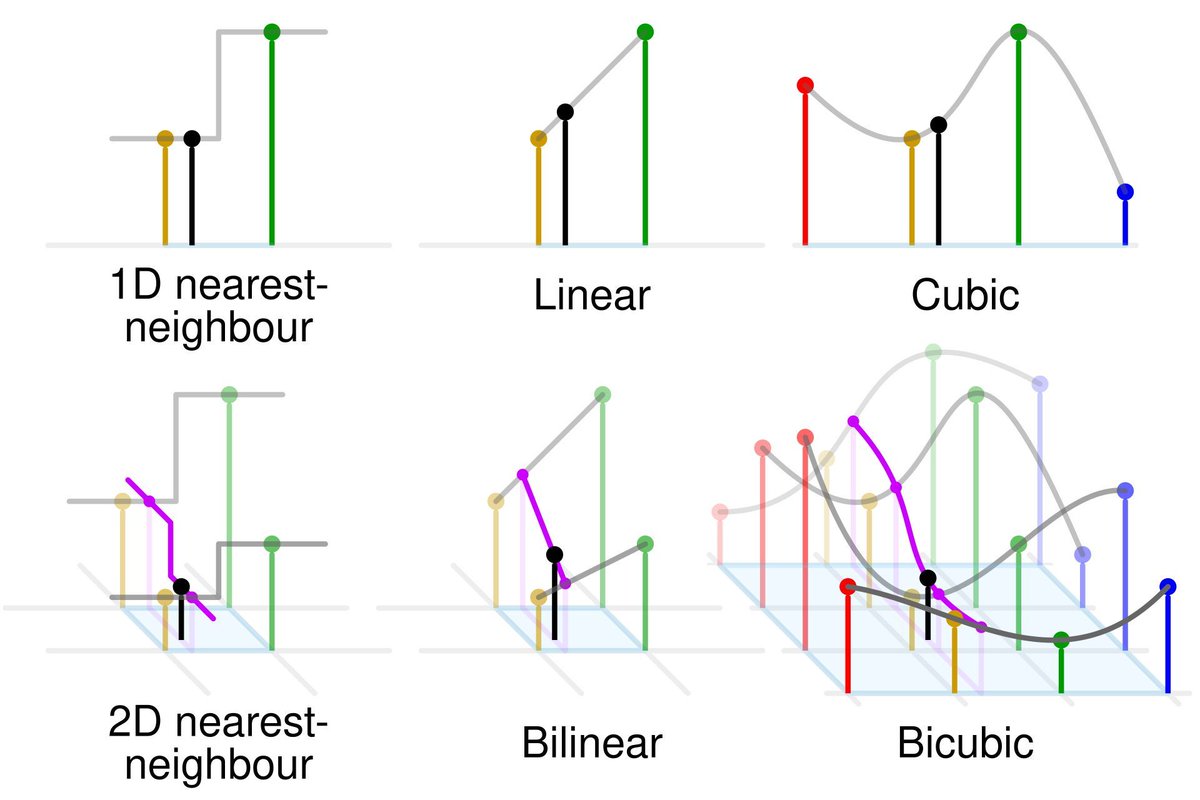
The visualization below compares different interpolation methods in one and two dimensions. The top row illustrates 1D interpolation techniques, including nearest-neighbor, linear, and cubic interpolation, showing how the black interpolated point is estimated using surrounding samples. The bottom row extends this concept to 2D interpolation, demonstrating nearest-neighbor, bilinear, and bicubic methods. Image from Wikipedia: en.wikipedia.org/wiki/Multiv…
🔹 R: The akima package provides bicubic interpolation, while fields supports kriging for spatial data. The mgcv package offers smoothing methods for complex multivariate data, and MBA implements multilevel B-spline interpolation.
🔹 Python: The scipy.interpolate module offers griddata for scattered data, RegularGridInterpolator for structured grids, and pykrige for kriging-based interpolation. The sklearn.gaussian_process module supports Gaussian process regression for flexible multivariate interpolation.
Want to expand your knowledge of Statistics, Data Science, R, and Python? Subscribe to my newsletter for more insights! Learn more by visiting this link: statisticsglobe.com/newslett…
#StatisticalAnalysis #datastructure #Data
2
24
105
3,670

ocean.iap.ac.cn/pages/dataSe… > Ocean Heat Content
①griddataは10月までアップされているんで、いちおう全球平均の時系列を作ってプロット:
加速が止まらんねぇ…
②御本家のは2024まで
どうでもいいけど、中国とは仲良くしてもらわないと、ネットが途切れたら我輩の暇つぶしのネタが減っちゃう😅
1
2
2
191
2 Dec 2025
Interpolation is a method used to estimate unknown values within the range of a known data set. It is widely applied in data science, engineering, and computer graphics to reconstruct missing data points or create smooth transitions between values. Choosing the right interpolation technique is important, as different methods are suited for different types of data. Common methods include linear, polynomial, spline, and radial basis function interpolation, each with its own trade-offs in accuracy and computational efficiency.
✔️ Fills in missing values and improves data continuity
✔️ Creates smooth curves for visualization and modeling
✔️ Used in image processing, signal reconstruction, and geographic data
✔️ Enhances machine learning features and numerical methods
❌ Can introduce errors if the method doesn't fit the data
❌ High-degree polynomial interpolation may cause oscillations
❌ Extrapolation beyond known points is often unreliable
❌ Some methods may smooth out important variations
The visualization below shows interpolation on an epitrochoid, where red points are known values, and blue curves connect them with simpler polynomial formulas. This demonstrates how interpolation approximates complex structures while preserving patterns. Image adapted from Wikipedia: en.wikipedia.org/wiki/Interp…
🔹 R: The approx() and spline() functions handle linear and spline interpolation, while akima provides bicubic interpolation for 2D data.
🔹 Python: The scipy.interpolate module offers interp1d for linear and spline interpolation, griddata for multidimensional data, and Rbf for scattered data.
Want to learn more about Statistics, Data Science, R, and Python? Join my newsletter for valuable insights! Click this link for detailed information: eepurl.com/gH6myT
#VisualAnalytics #rstudioglobal #database #RStats #pythoncode #coding #Data #Python #datascienceenthusiast #DataVisualization

2
26
1,441
24 Oct 2025
Multivariate interpolation estimates unknown values based on multiple variables, making it useful in physics, finance, and machine learning. It allows for smoother approximations and more accurate predictions in multidimensional spaces. Common methods include bilinear, bicubic, radial basis function (RBF), and kriging interpolation, each suited for different data structures, accuracy needs, and computational efficiency. Selecting the right method depends on factors such as data smoothness, sparsity, and dimensionality.
✔️ Helps estimate missing values in multi-variable data sets
✔️ Improves accuracy in simulations, spatial modeling, and scientific computing
✔️ Supports applications in computer graphics, meteorology, and geostatistics
✔️ Enables better surface and volume reconstructions in 3D modeling
❌ More computationally intensive than single-variable interpolation
❌ Can introduce errors if the method does not fit the data structure or distribution
❌ High-dimensional interpolation may suffer from the curse of dimensionality, increasing complexity and reducing accuracy
❌ Some methods, like kriging, require careful parameter tuning for optimal results
The visualization below compares different interpolation methods in one and two dimensions. The top row illustrates 1D interpolation techniques, including nearest-neighbor, linear, and cubic interpolation, showing how the black interpolated point is estimated using surrounding samples. The bottom row extends this concept to 2D interpolation, demonstrating nearest-neighbor, bilinear, and bicubic methods. Image from Wikipedia: en.wikipedia.org/wiki/Multiv…
🔹 R: The akima package provides bicubic interpolation, while fields supports kriging for spatial data. The mgcv package offers smoothing methods for complex multivariate data, and MBA implements multilevel B-spline interpolation.
🔹 Python: The scipy.interpolate module offers griddata for scattered data, RegularGridInterpolator for structured grids, and pykrige for kriging-based interpolation. The sklearn.gaussian_process module supports Gaussian process regression for flexible multivariate interpolation.
Want to expand your knowledge of Statistics, Data Science, R, and Python? Subscribe to my newsletter for more insights!
See this link for additional information: eepurl.com/gH6myT
#R #Python #RStats #pythonlearning #DataAnalytics

3
69
479
19,144
18 Jul 2025
Interpolation is a method used to estimate unknown values within the range of a known data set. It is widely applied in data science, engineering, and computer graphics to reconstruct missing data points or create smooth transitions between values. Choosing the right interpolation technique is important, as different methods are suited for different types of data. Common methods include linear, polynomial, spline, and radial basis function interpolation, each with its own trade-offs in accuracy and computational efficiency.
✔️ Fills in missing values and improves data continuity
✔️ Creates smooth curves for visualization and modeling
✔️ Used in image processing, signal reconstruction, and geographic data
✔️ Enhances machine learning features and numerical methods
❌ Can introduce errors if the method doesn't fit the data
❌ High-degree polynomial interpolation may cause oscillations
❌ Extrapolation beyond known points is often unreliable
❌ Some methods may smooth out important variations
The visualization below shows interpolation on an epitrochoid, where red points are known values, and blue curves connect them with simpler polynomial formulas. This demonstrates how interpolation approximates complex structures while preserving patterns. Image adapted from Wikipedia: en.wikipedia.org/wiki/Interp…
🔹 R: The approx() and spline() functions handle linear and spline interpolation, while akima provides bicubic interpolation for 2D data.
🔹 Python: The scipy.interpolate module offers interp1d for linear and spline interpolation, griddata for multidimensional data, and Rbf for scattered data.
Want to learn more about Statistics, Data Science, R, and Python? Join my newsletter for valuable insights!
Further details: eepurl.com/gH6myT
#VisualAnalytics #programming #RStats #DataAnalytics #datastructure #Python

3
39
1,677

4 Jul 2025
Ma vuoi mettere che segna e poi ti hitta una griddata…….
1
9
241
1 Jul 2025
Multivariate interpolation estimates unknown values based on multiple variables, making it useful in physics, finance, and machine learning. It allows for smoother approximations and more accurate predictions in multidimensional spaces. Common methods include bilinear, bicubic, radial basis function (RBF), and kriging interpolation, each suited for different data structures, accuracy needs, and computational efficiency. Selecting the right method depends on factors such as data smoothness, sparsity, and dimensionality.
✔️ Helps estimate missing values in multi-variable data sets
✔️ Improves accuracy in simulations, spatial modeling, and scientific computing
✔️ Supports applications in computer graphics, meteorology, and geostatistics
✔️ Enables better surface and volume reconstructions in 3D modeling
❌ More computationally intensive than single-variable interpolation
❌ Can introduce errors if the method does not fit the data structure or distribution
❌ High-dimensional interpolation may suffer from the curse of dimensionality, increasing complexity and reducing accuracy
❌ Some methods, like kriging, require careful parameter tuning for optimal results
The visualization below compares different interpolation methods in one and two dimensions. The top row illustrates 1D interpolation techniques, including nearest-neighbor, linear, and cubic interpolation, showing how the black interpolated point is estimated using surrounding samples. The bottom row extends this concept to 2D interpolation, demonstrating nearest-neighbor, bilinear, and bicubic methods. Image from Wikipedia: en.wikipedia.org/wiki/Multiv…
🔹 R: The akima package provides bicubic interpolation, while fields supports kriging for spatial data. The mgcv package offers smoothing methods for complex multivariate data, and MBA implements multilevel B-spline interpolation.
🔹 Python: The scipy.interpolate module offers griddata for scattered data, RegularGridInterpolator for structured grids, and pykrige for kriging-based interpolation. The sklearn.gaussian_process module supports Gaussian process regression for flexible multivariate interpolation.
Want to expand your knowledge of Statistics, Data Science, R, and Python? Subscribe to my newsletter for more insights! Further details: eepurl.com/gH6myT
#Data #Rpackage #pythonprogramming #Python #StatisticalAnalysis #RStats

14
97
4,122

19 May 2025
Bisognerebbe capire che rapporti hanno Holm e Kean, magari si conoscono e si scherniscono in amicizia. Anche perchè diversamente la risata in faccia di Holm alla griddata di Kean di ieri è abbastanza eloquente visto anche il momento di stagione e risultati.
2
4
284

19 May 2025
La griddata su holm onestamente poteva risparmiarsela…ieri dovevano stare zitti e a cuccia per l’umiliazione che abbiamo subito indirettamente noi tifosi
5
28
2,539


17 Mar 2025
Multivariate interpolation estimates unknown values based on multiple variables, making it useful in physics, finance, and machine learning. It allows for smoother approximations and more accurate predictions in multidimensional spaces. Common methods include bilinear, bicubic, radial basis function (RBF), and kriging interpolation, each suited for different data structures, accuracy needs, and computational efficiency. Selecting the right method depends on factors such as data smoothness, sparsity, and dimensionality.
✔️ Helps estimate missing values in multi-variable data sets
✔️ Improves accuracy in simulations, spatial modeling, and scientific computing
✔️ Supports applications in computer graphics, meteorology, and geostatistics
✔️ Enables better surface and volume reconstructions in 3D modeling
❌ More computationally intensive than single-variable interpolation
❌ Can introduce errors if the method does not fit the data structure or distribution
❌ High-dimensional interpolation may suffer from the curse of dimensionality, increasing complexity and reducing accuracy
❌ Some methods, like kriging, require careful parameter tuning for optimal results
The visualization below compares different interpolation methods in one and two dimensions. The top row illustrates 1D interpolation techniques, including nearest-neighbor, linear, and cubic interpolation, showing how the black interpolated point is estimated using surrounding samples. The bottom row extends this concept to 2D interpolation, demonstrating nearest-neighbor, bilinear, and bicubic methods. Image from Wikipedia: en.wikipedia.org/wiki/Multiv…
🔹 R: The akima package provides bicubic interpolation, while fields supports kriging for spatial data. The mgcv package offers smoothing methods for complex multivariate data, and MBA implements multilevel B-spline interpolation.
🔹 Python: The scipy.interpolate module offers griddata for scattered data, RegularGridInterpolator for structured grids, and pykrige for kriging-based interpolation. The sklearn.gaussian_process module supports Gaussian process regression for flexible multivariate interpolation.
Want to expand your knowledge of Statistics, Data Science, R, and Python? Subscribe to my newsletter for more insights! For more information, visit this link: eepurl.com/gH6myT
#statisticians #database #R #RStats #datasciencetraining #Rpackage #datastructure

7
73
3,841
3 Mar 2025
Interpolation is a method used to estimate unknown values within the range of a known data set. It is widely applied in data science, engineering, and computer graphics to reconstruct missing data points or create smooth transitions between values. Choosing the right interpolation technique is important, as different methods are suited for different types of data. Common methods include linear, polynomial, spline, and radial basis function interpolation, each with its own trade-offs in accuracy and computational efficiency.
✔️ Fills in missing values and improves data continuity
✔️ Creates smooth curves for visualization and modeling
✔️ Used in image processing, signal reconstruction, and geographic data
✔️ Enhances machine learning features and numerical methods
❌ Can introduce errors if the method doesn't fit the data
❌ High-degree polynomial interpolation may cause oscillations
❌ Extrapolation beyond known points is often unreliable
❌ Some methods may smooth out important variations
The visualization below shows interpolation on an epitrochoid, where red points are known values, and blue curves connect them with simpler polynomial formulas. This demonstrates how interpolation approximates complex structures while preserving patterns. Image adapted from Wikipedia: en.wikipedia.org/wiki/Interp…
🔹 R: The approx() and spline() functions handle linear and spline interpolation, while akima provides bicubic interpolation for 2D data.
🔹 Python: The scipy.interpolate module offers interp1d for linear and spline interpolation, griddata for multidimensional data, and Rbf for scattered data.
Want to learn more about Statistics, Data Science, R, and Python? Join my newsletter for valuable insights! More information: eepurl.com/gH6myT
#DataVisualization #datasciencetraining #RStats #DataAnalytics #statisticians #database

1
2
21
1,469

16 Jan 2025
Se quella griddata la fai in terza categoria finisci dentro un pilone
16 Jan 2025

A San Siro ferma tutto 𝐄𝐦𝐢𝐥 𝐇𝐨𝐥𝐦 🎯
Lo svedese firma il 2️⃣-2️⃣ contro l'Inter
#InterBologna #SerieAEnilive #DAZN

2
14
1,230

26 Mar 2024
Não acredito que gastei menos tempo implementando uma interpolação bilinear numa imagem do que todo o tempo que já tinha gasto procurando implementações prontas em Python.
Eu não achei a API de `griddata` da Scipy intuitiva pro caso "tenho a imagem e as coordenadas, interpole".
14
781

8 May 2023
[#NewBlogAlert] [#IntertrustBlog] [#Blog] Grid data sharing explained 👉
intertrust.com/blog/grid-dat…
Grid data sharing is among the most powerful tools available in the drive for a clean energy world. Though it does face significant obstacles, these can be overcome through the use of secure data exchange technology. @IntertrustTech, as proven through #CleanGrid, creates fast and effective data sharing environments, essential for uncovering new efficiencies in the energy ecosphere. Find out in our blog!
#Intertrust #GridData #GridDataSharing #DataCompliance #SecureCollaboration #DataInteroperability

2
4
73

17 Dec 2022
最新のSciPyが使える環境であれば、RegularGridInterpolatorを使ってもらった方がいいかもしれません。今後griddataは廃止され、こちらをメインで拡張される予定ですので。docs.scipy.org/doc/scipy/ref…
1
1
3
2,022

9 Dec 2022
Your energy week⚡️
Nächste Woche mit spannenden Veranstaltungen von
@DFB_EW, GridData GmbH, Business Angels Frankfurt und @Hessian_AI / AI Startup Rising / Städtische Werke Kassel / @HoE_Hessen.
Weitere #Termine unter house-of-energy.org/terminka…
#Energiewende #PV #Startup #Strom

1
2

20 Oct 2022
Reference data set for a Norwegian medium voltage power distribution system #TechRxiv #GridData #LoadData #TestGrid #TestNetwork #TestSystem #BenchmarkSystem
techrxiv.org/articles/prepri…
1
9 Nov 2021
It’s your last chance to register for tomorrow’s webinar - Accelerate #EVInfrastructure and #GridPlanning with #Intertrust and @envelio. Learn how we’re solving #DataManagement challenges around #GridData and more here - bit.ly/3qjkaJ6
#IntertrustPlatform #CleanGrid
1
2