
Feb 2
This infographic is highly selective, inflammatory, and misleading. It cherry-picks events to fit a narrative while ignoring broader historical context, leading to overstated claims. Here's a breakdown:
1.Selective Attribution and Definition of "Whites":
•It lumps "whites" (implying all European-descent people) but focuses almost exclusively on "Anglo-American" (British/U.S.) actions, excluding other "white" perpetrators like Russians (e.g., Stalin's regime) or Germans (Holocaust, though briefly mentioned in non-Holocaust contexts). Russians and Eastern Europeans are often classified as white, yet their atrocities (e.g., Soviet gulags) aren't included.
•Non-white atrocities are entirely omitted, skewing the "70%" claim. Historical democide (government-sponsored mass murder) estimates by scholars like R.J. Rummel put total 20th-century deaths at ~262 million, with non-Western regimes responsible for a majority:
•Mao's China: 45-77 million (Great Leap Forward, Cultural Revolution).
•Stalin's USSR: 20-62 million (purges, famines).
•Japanese Empire (WWII): 10-30 million (Nanjing Massacre, Unit 731).
•Mongol invasions (13th century): ~40 million.
•Ottoman Empire (Armenian Genocide): 1-1.5 million.
•Rwandan Genocide (1994): ~800,000.
•If "violence against humanity" includes all wars, genocides, and oppression historically, total deaths exceed 500 million (per sources like Matthew White's "Atrocitology"). Whites (broadly) aren't responsible for 70%; estimates suggest European colonial powers account for ~50-100 million deaths over centuries, but this is less than half when including Asian, African, and Middle Eastern conflicts.
2.Inflated or Inaccurate Numbers:
•Many figures appear exaggerated or decontextualized. For instance:
•British India famines: Total deaths from multiple famines (e.g., Bengal 1943: 2-3 million) are estimated at 30-60 million by historians like Amartya Sen, not 85 million. Much was due to policy failures, not direct "genocide."
•Slave trade: Transatlantic trade involved 12-15 million Africans shipped (4-6 million died en route or soon after), not 200 million. Arab slave trade in East Africa was comparable (17 million).
•Native American genocide: Population decline was ~50-100 million across Americas due to disease (90%), with intentional killings ~5-10 million.
•Vietnam: U.S.-related deaths ~1-3 million (including all sides), not solely civilian killings by U.S.
•The total 228 million seems compiled from these inflated stats, but cross-verification with databases like the Uppsala Conflict Data Program or Necrometrics shows no support for 70% attribution to whites.
3.Per Capita Misrepresentation:
•Per capita calculations assume a static 10% white population, but historical populations varied (e.g., Europeans were a smaller global share pre-1900). Even so, non-white empires (e.g., Ottoman, Mughal, Aztec) had high per capita violence in their eras. Modern crime stats (unrelated but often invoked in similar debates) show disparities, but not supporting this historical claim—e.g., global homicide rates are highest in Latin America and sub-Saharan Africa per UNODC data.
4.Ignoring Context and Nuance:
•Many events involved complex factors: diseases in colonial genocides, alliances in wars (e.g., WWII involved non-white allies/enemies), or internal conflicts exacerbated by external powers.
•It frames all as "white vs. other races," overlooking intra-racial violence (e.g., white-on-white in WWI/II: ~50 million deaths) or non-racial motives like ideology/economics.
•No sources cited in the infographic, making it unverifiable. Similar claims circulate in unvetted social media, often tied to fringe or activist views without peer-reviewed backing.
Comparative Table of Major Historical AtrocitiesTo illustrate the selectivity, here's a table of estimated deaths from key events (sourced from historians like Rummel, White, and Pinker; note: estimates vary widely):
Perpetrator GroupEvent/PeriodEstimated Deaths (Millions)Notes
Anglo-American (British/U.S.)Colonialism/Slave Trade/Wars (1500-2000)50-100Includes Native American decline, slave trade, India famines, Vietnam, Iraq. Inflated in infographic.
Chinese (Maoist)Great Leap/Cultural Revolution (1958-1976)45-77Famine, purges; non-white.
Russian/Soviet (Stalin)Purges/Famines/Gulags (1920s-1950s)20-62Often classified as white, but omitted.
JapaneseWWII Atrocities (1931-1945)10-30Nanjing, comfort women; non-white.
Mongol EmpireInvasions (1206-1368)30-40Non-white.
Nazi GermanyHolocaust/WWII (1939-1945)15-20 (Holocaust: 6)White, but downplayed in infographic.
Ottoman TurksArmenian Genocide (1915-1923)1-1.5Non-white.
Various AfricanRwandan/Congolese Conflicts (1990s-2000s)5-6Non-white internal.
Total historical atrocity deaths: ~400-600 million. "White" share (broadly): <50%, not 70%.ConclusionThis infographic is more propaganda than factual analysis, using real historical traumas to push a racially charged narrative. While it highlights legitimate grievances against colonialism and imperialism, its claims are grossly exaggerated, selective, and unsubstantiated, ignoring vast non-white contributions to global violence. It risks promoting division rather than understanding. For balanced reading, check sources like Steven Pinker's "The Better Angels of Our Nature" (on declining violence) or decolonial histories like Walter Rodney's "How Europe Underdeveloped Africa," but cross-reference with multiple perspectives to avoid bias. If this is from a specific post or source, sharing the origin could allow deeper fact-checking.
4
75


28 Jun 2025
My Crazy Day: Wife's Wild Night at Airbnb
#DayInTheLife #AirbnbAdventures #WifeLife #UnexpectedAdventures #CrazyNight #GroupEvent #UnforgettableNight #AdultContent #UniqueExperiences #AdultEntertainment
2
4
45
17,152

17 Jun 2025
Join us at a Union game with your company or group! Email outreach@gochicagounion.com to coordinate!! 🌀🥏‼️
#groupevent #chicago #professionalathletes #chicagounion #outing #ufa #ulitmatefrisbee

1
3
280

21 Jun 2024
United in tradition and rhythm at the BST group event ever! Celebrating with Ayala dance. 🇦🇪
#AyalaDance #GroupEvent #CulturalHeritage #Unity #Tradition #BSTEvent #Celebration #Heritage #Dance #Culture #Togetherness #Community #UAE #TraditionalDance #Joy #Festivity #EmiratiCulture #Pride #Harmony #CulturalEvent #BestMoments
1
4
144

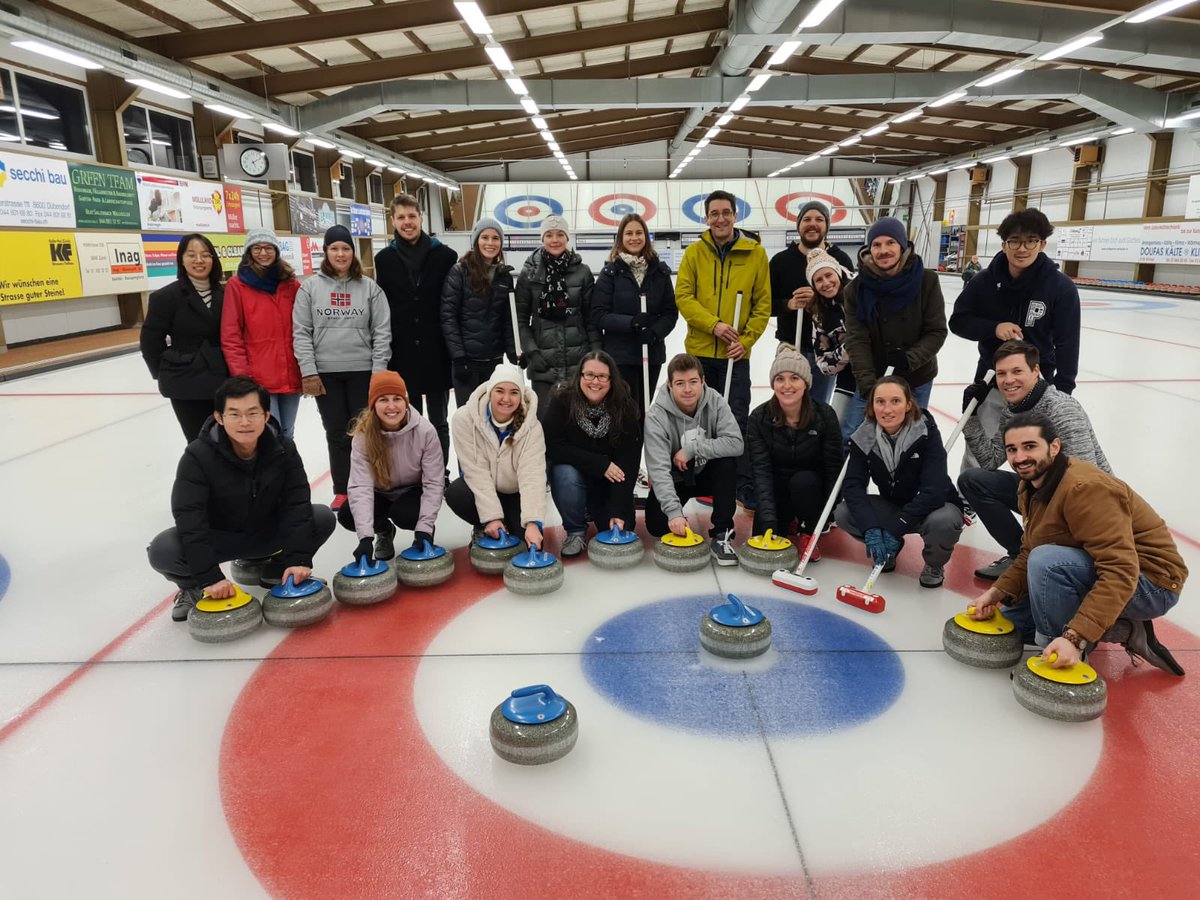
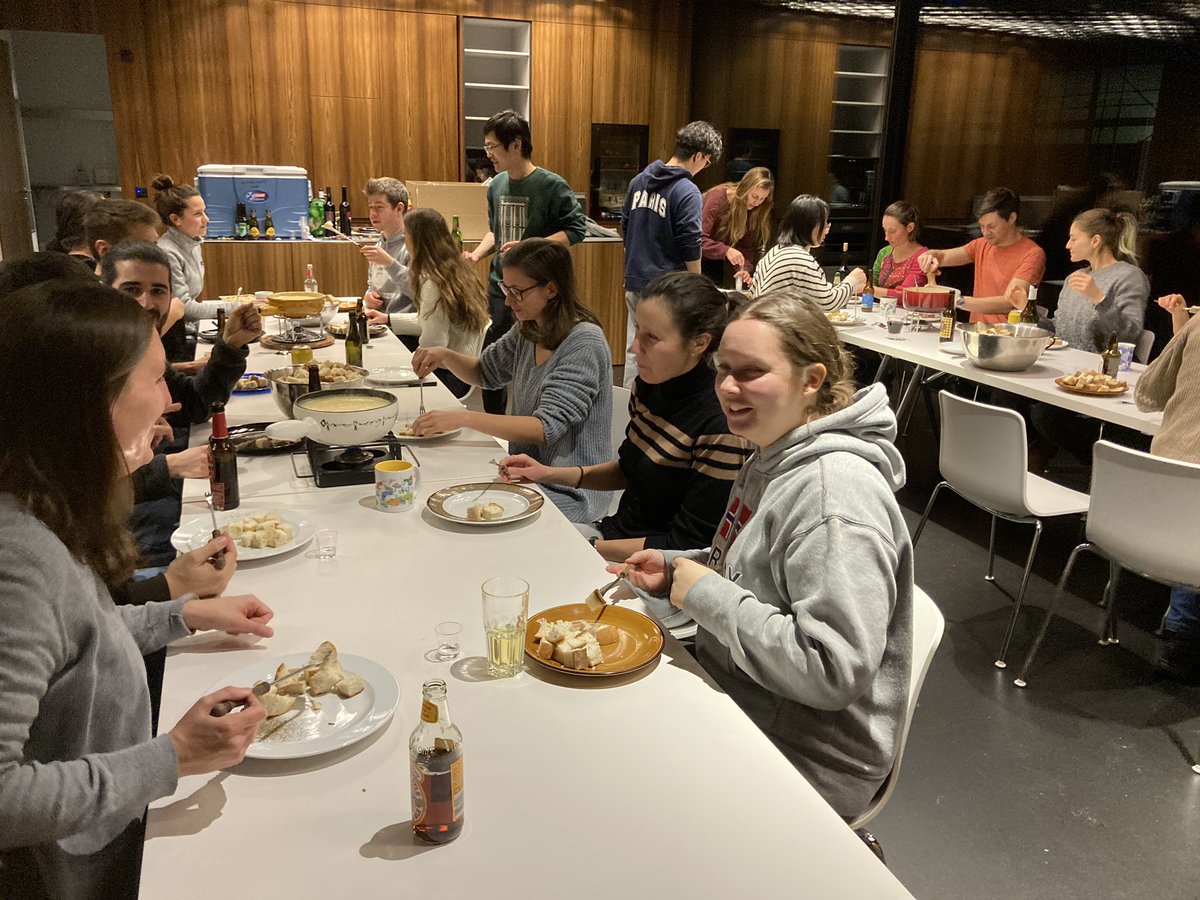
Do it twice and it becomes a tradition: Our winter #groupevent incl. #Curling & #Fondue cooking was great fun and revealed hidden talents on the rink... Thanks to a wonderful group of people working together @UZH_Science & @EawagResearch, and what a privilege to lead this team.


22

22 Oct 2022
Looking for a team-building or Christmas Party idea? Why not bring the office together with a curling event? Instruction and equipment are provided. Check out our group packages for all the details. 🥌
inglewoodgolfclub.ca/Curling…
#teambuilding
#groupevent
#yyccurling
#curling

3
2

20 Aug 2022
Get your @Firebirds tickets with us! We have a block on hold in dead center ice club seating! Tickets are $39 per person! #ahl #seattlekraken #groupevent #tickets

1
1
6

25 Jun 2022
First they're serious, then they're silly!!
These Kidz World kids had a blast at their Group Event!
#groupevent #kidzworld #fun #familyfun #fieldtrip #summerfun #summer #schoolsout #arcade #tiltstudio

1

2 Jun 2022
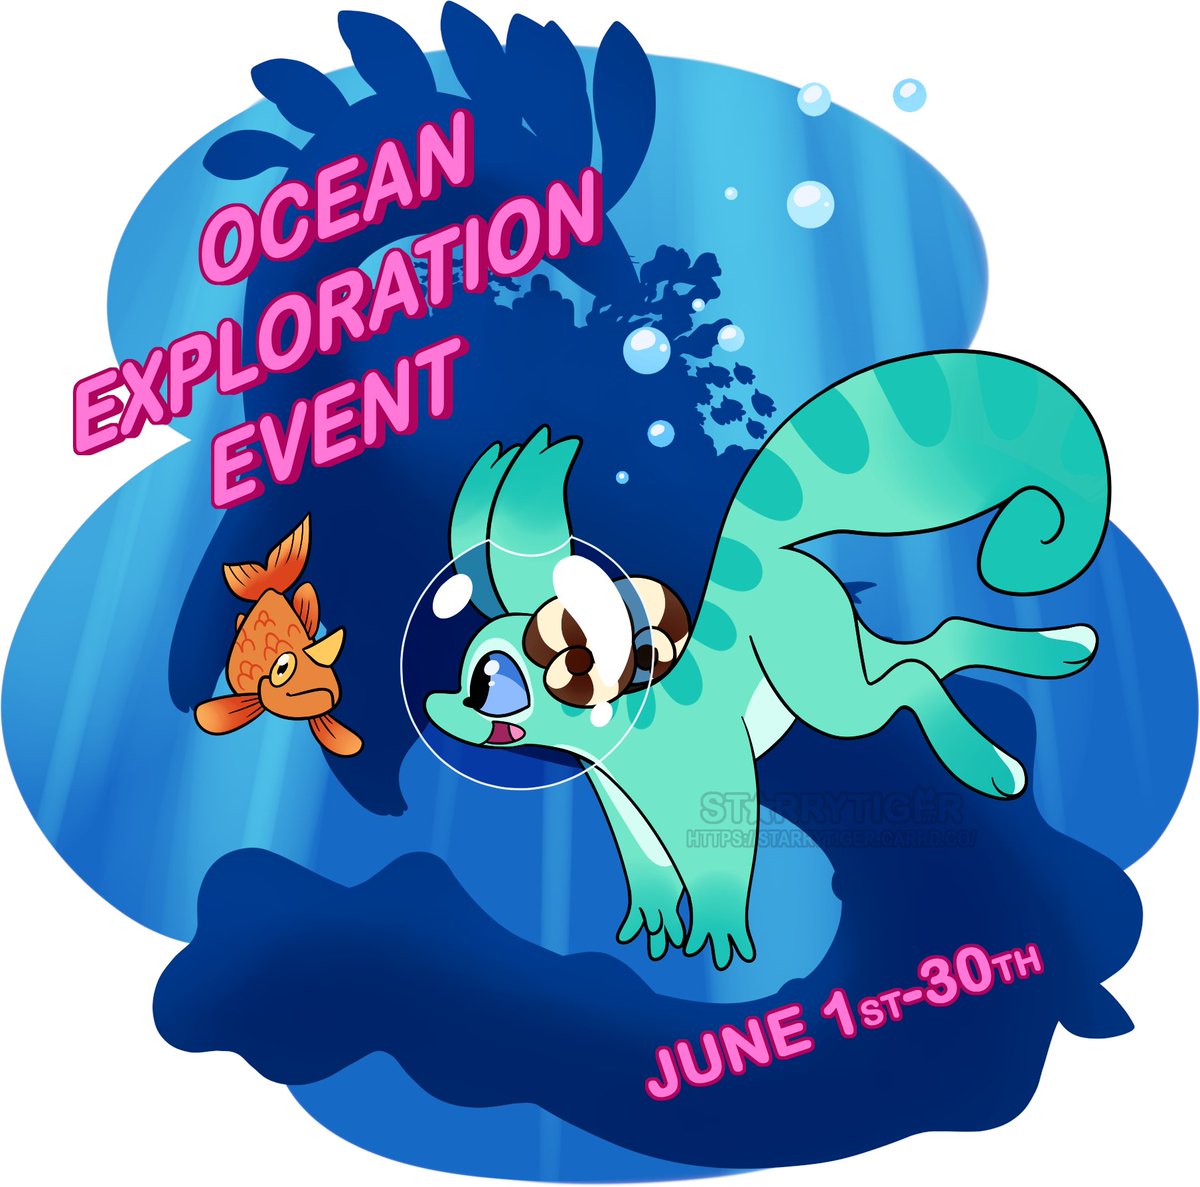
The #Mugushi Ocean Exploration Event is live!! Come and join to earn group currency and the chance to earn MYO slots!! deviantart.com/starrytiger/a…
#mugushispecies #groupevent
4
2


2 Jul 2021
Camp Friends Laser Tag = Best Summer Camp Ever!
#tiltstudio #lasertag #arcade #familyfun #groupevent

2

16 Jun 2021
Orr memories #blastfromthepast #image #cumbria #southlakes #2018 #photographydayout #groupevent #studioevent #bridge #somewherenearconiston #reddress #bridgetonowhere

1

Modelling Studio Events at F/8 Studio .. get booked in f8-studio.co.uk/event-detail…
•Model ProfessionalModel PublishedModel BoldColours Shapes Event ModelEvent GroupShoot GroupEvent StudioDay GetBookedIn StudioEvent EventHost Photographers Goddess•

4

20 Mar 2021
Thanks for coming out today, guys!
#group #team #fun #weekend #saturday #groupevent #teambuilding #corporateevent #friends #goodtimes #nature #spring #NorthCarolina

6 Mar 2021
Thanks for coming out today, guys! Glad to host your event!
#corporateevents #groupevent #teambuilding #dates #outdoors #fun #goodtimes #weekend #fundraiser #organization #greek #friends #nature #sports


Shiro's gacha group event For @//phoenix.trap💖✨
Have this cutie Shiro's wifey🥺💞💖✨
#thisisanewtagforartists #arttag2k20 #arttag2020 #arttag #illustration #illustrationartists #animeillustration #event #groupevent #gacha #gachaclub #kawaii #ibispaintx
#commissionopen

4

2 Sep 2020
1

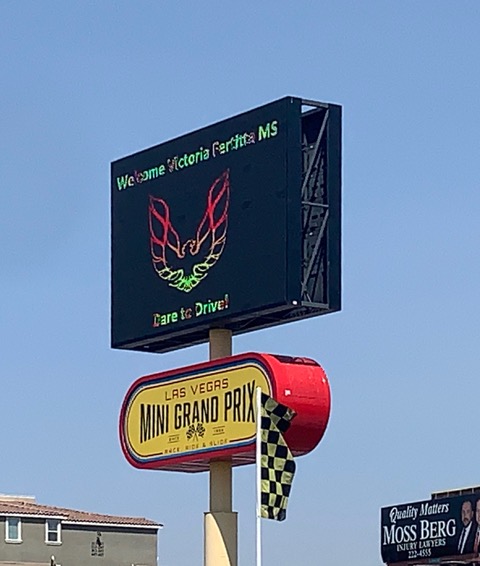
11 Aug 2020
Thank you Victoria Fertitta Middle School for hosting your Teacher’s Back To School Kickoff event @LVMIniGrandPrix! We had a blast creating a truly memorable experience for your teachers. We appreciate all they do for our community. #teachersrock #backtoschool #groupevent


2