
1 Aug 2025
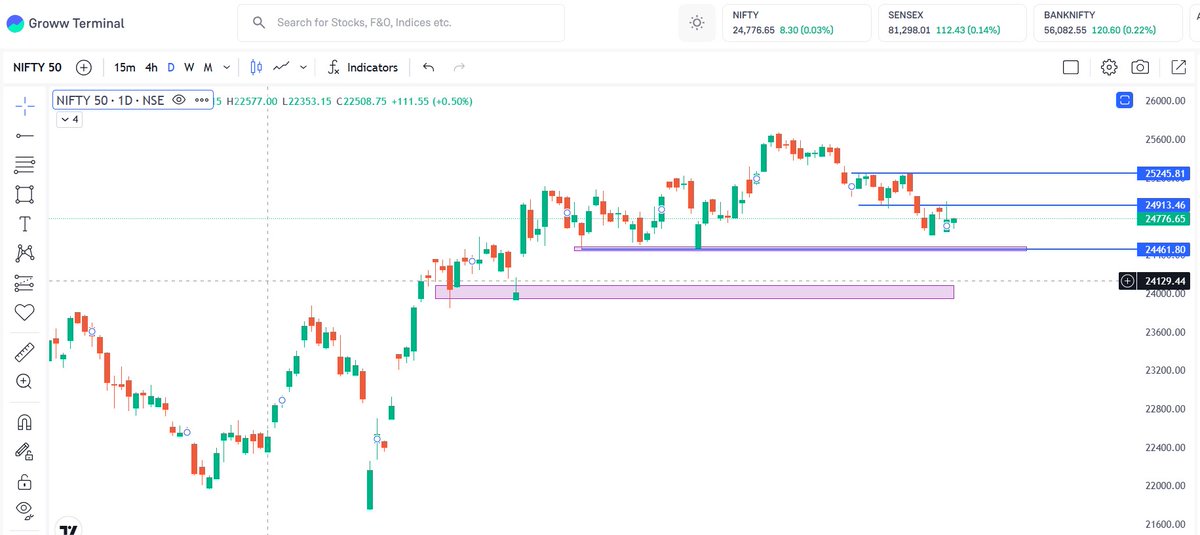
Key Level To Watch #NIFTYSPOT #NIFTY50
Shorterm Trend :DOWN
Mediumterm trend : Sideways
24910-50 R1
25222-250 R2
Downside Support
24460/80 S1
23935-860 S2
200SMA 24050
If price will consolidate here then in next 1/2week downside confirmation will come.. #WATCH
#LevelTOWatch
6
10
101
157,998

8 Apr 2025
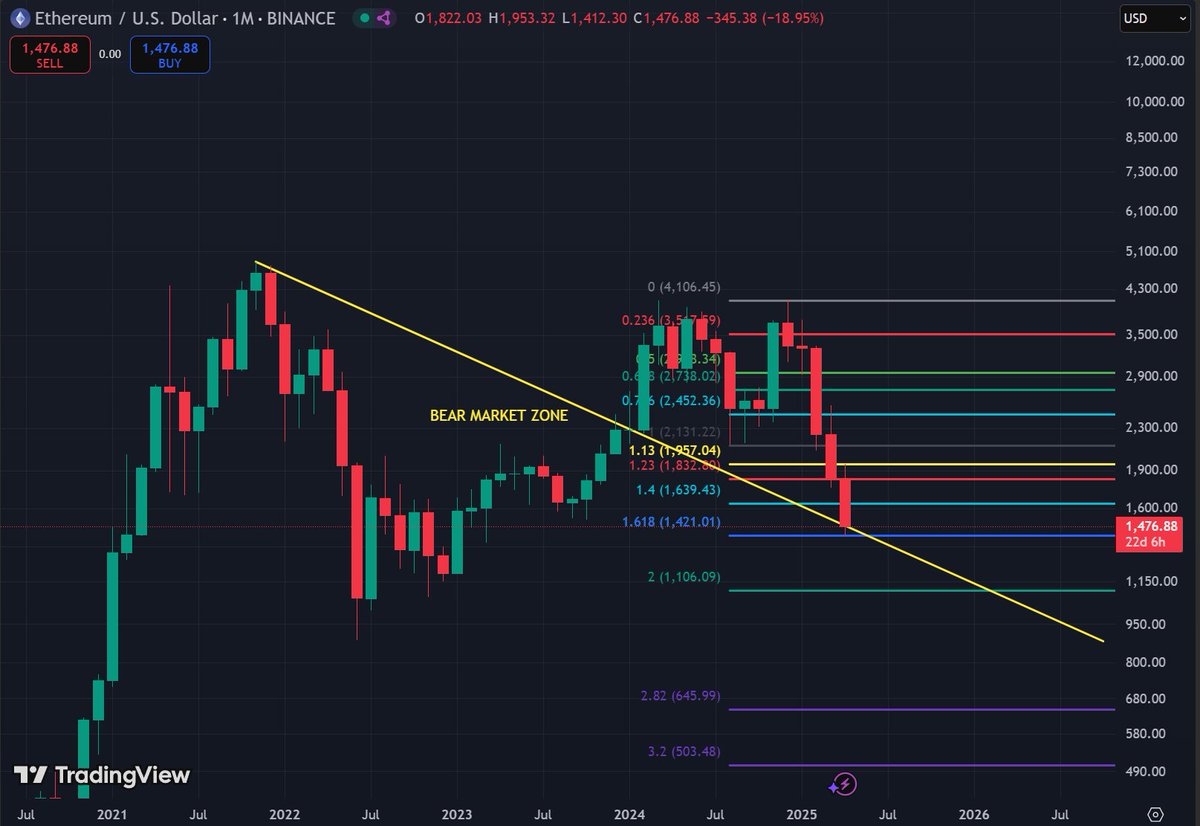
#Ethereum at a Make-or-Break Moment: Will It Crash Below $1,400 or Explode Toward $2,500?
(You NEED to See This Chart!)
1. Bear Market Trendline:
The upper yellow line clearly marks the bear market zone that was recently retested, but acted as a strong resistance. #ETH failed to close a monthly candle above it.
2. Current candle:
It’s very bearish, with strong downside momentum, and it broke clearly below $1,832.
Now it's testing 1.618 Fibonacci – the last stronghold of support.
3. Technical and Probabilistic Analysis:
#ETH is in a confirmed downtrend on the monthly timeframe.
A confirmed trend reversal (bullish) would require:
A quick recovery above 1.618 ($1,421) with a strong close.
Then reclaiming $1,832 and breaking the bear market trendline.
But at this moment:
Momentum is clearly bearish.
Selling volume is rising.
A weekly close below 1.618 may trigger a panic sell down toward the $1,100 area.
4. Bearish scenario (if the week closes below 1.421):
Mid-term target: $1,106 (FIB 2.0).
Panic wick possible down to $645, but only in case of a macro shock/black swan event (e.g., BTC below 50k, stock market crash, etc.).
5. Bullish scenario (if ETH reclaims 1.421 and closes above 1.832):
Retest of the bear trendline, which lies around $2,100–$2,300.
If #ETH closes a monthly candle above that trendline, then we can talk about a confirmed reversal on the higher timeframe.
6. Correlation with traditional markets:
If Nasdaq or SP500 correct in Q2, ETH will likely follow.
#BTC dominance is rising – meaning altcoins (including #ETH) struggle to hold value, even if #BTC trades sideways or climbs slightly.
🔚 Conclusion:
The current zone ($1,421) is critical. This is the decision point.
If #ETH closes April below 1.421, we’re likely heading to $1,100–$1,200.
If it holds and reclaims $1,832, it's a show of strength and could lead to a significant bounce.
#Ethereum #ETH #CryptoAnalysis #CryptoNews #CryptoTrader
#Altcoins #TechnicalAnalysis #FibonacciLevels #BearMarket #BullishOrBearish
#ETHPrice #CryptoCommunity #TradingSetup #CryptoSignals #PriceAction
#WhalesAreWatching #LastSupport #ETHEmergency #DontMissThis
#PumpOrDump #NextMove #BigDecision #LevelToWatch
1
199
29 Nov 2021
19

27 Jul 2021
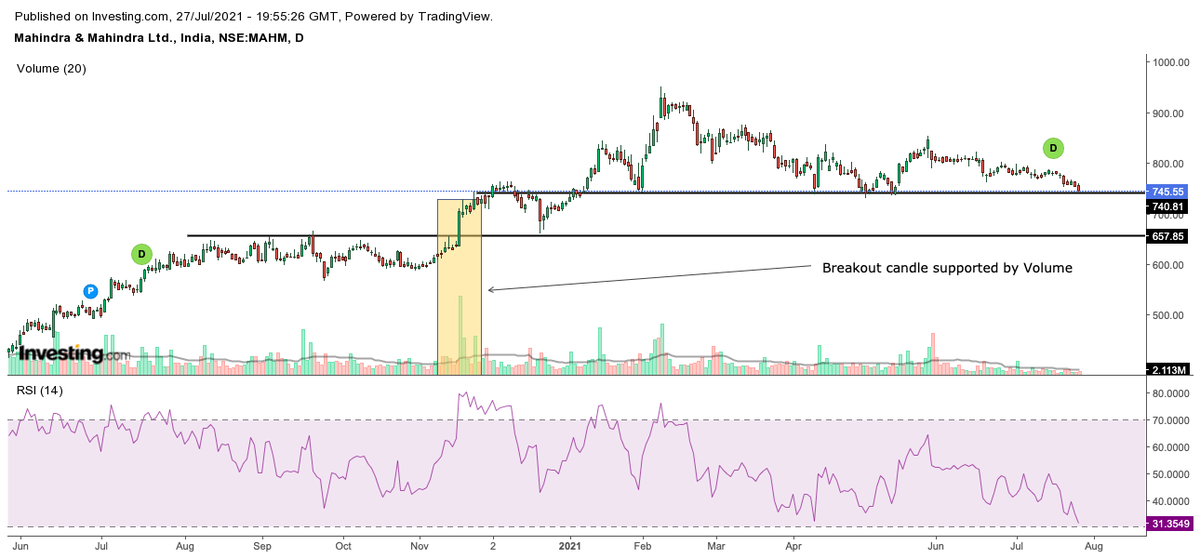
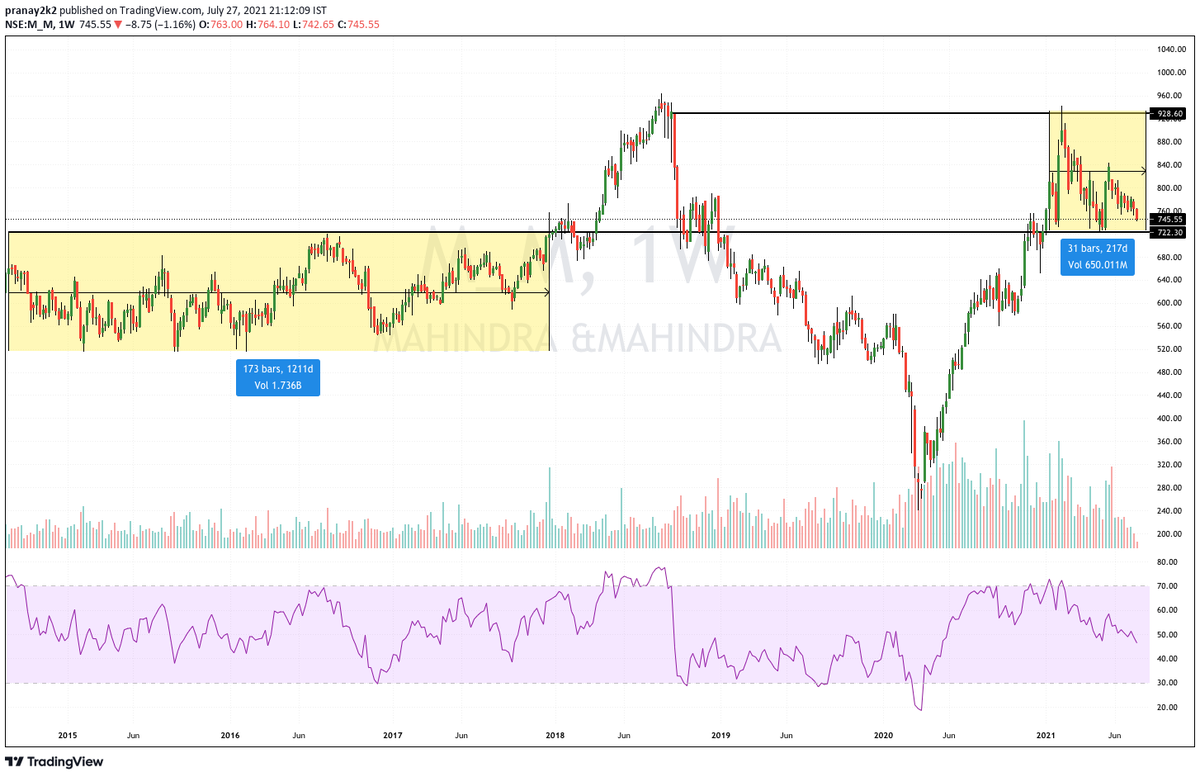
#MAHINDRA
Near huge support as per daily chart but next big support at 650 level and which is supported by volume🧐
#leveltowatch

1
3
22 Jul 2021
#KotakBank
💥1669 Key Level 💥
Resistance 1760
Close Above 1760 TGT 2030
Momentum will back abv 1760.
#LevelToWatch #bank
6
7
120

5 Nov 2020
4 Nov 2020

Trade only and only at
major support / resistance
with strict SL
Gann Roadmap,
11400--11570--11740--11910--12080--12250--12430
If Trump wins expect a major major short covering !! 🔥
#catchytrader
#cautious
#avoidtradingifpossible
#USElections2020
3

5 Jul 2019
Nifty Key Level to Watchout for tody
11995-12000 Resistance Zone
11815-11795 Support Zone
5SMA=11885
20SMA=11831
Highest OI in CE :12000
Highest OI in PE:11800
#Nifty #LevelToWatch

1
1
7
3 Jul 2019
#NiftySpot 11916.75
Key Level To WatchOut for 05.07.2019
11935-45 Resistance Zone
11845-55 Support Zone
Dynamic Support level:
5SMA=11873 & 20SMA=11826
Highest OI in Call :12000
Highest OI in Put :11800
#Nifty #LevelTOwatch #Homework #RSP #nifty-50

1
11
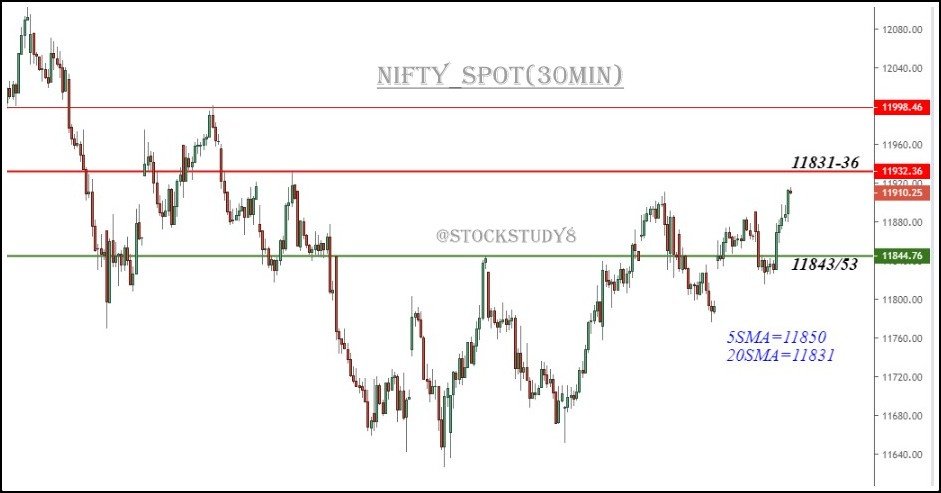
2 Jul 2019
#NIFTY 11910
KeyLevel To Watch for 03.07.2019
11931-35 Resistance Zone
11843/53 Support Zone
Dynamic Support
5SMA=11850 20SMA=11831
Highest OI in Call :12000
Highest OI in Put :11800
#Nifty #LevelTOwatch #Homework #RSP
1
1
8