


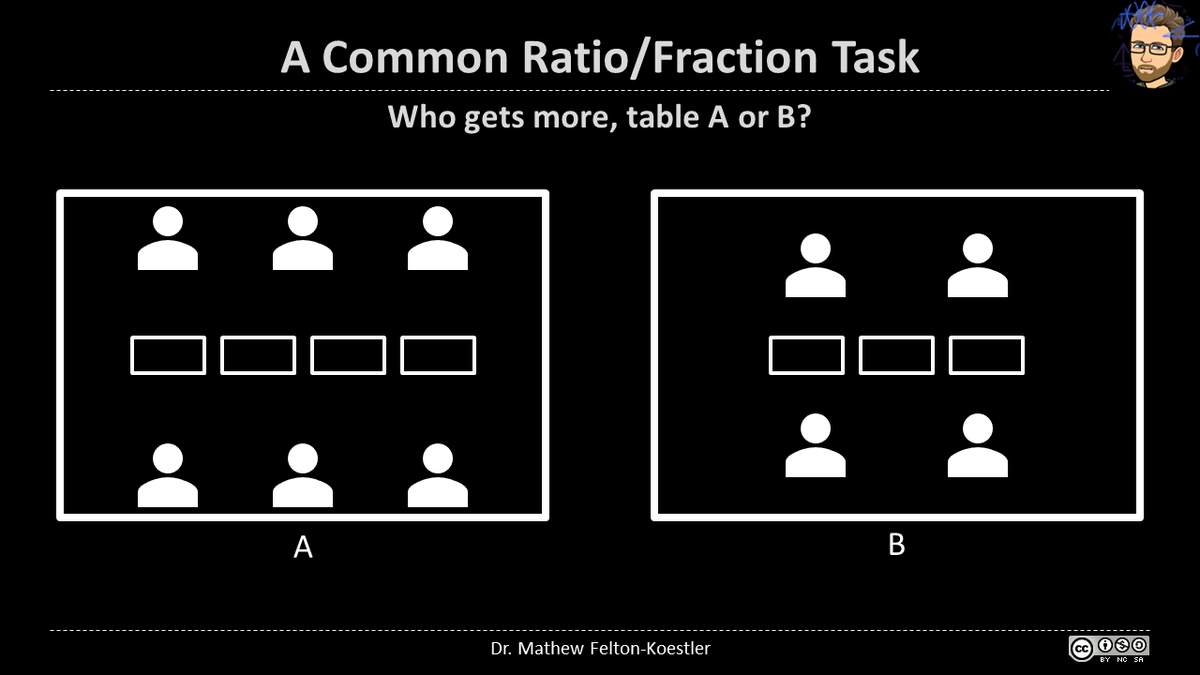
ALT Power point slide. Text: "A common ratio/fraction task. Who gets more table A or table B?" Image: Table A with 6 people and 4 rectangles. Table B with 4 people and 3 rectangles.
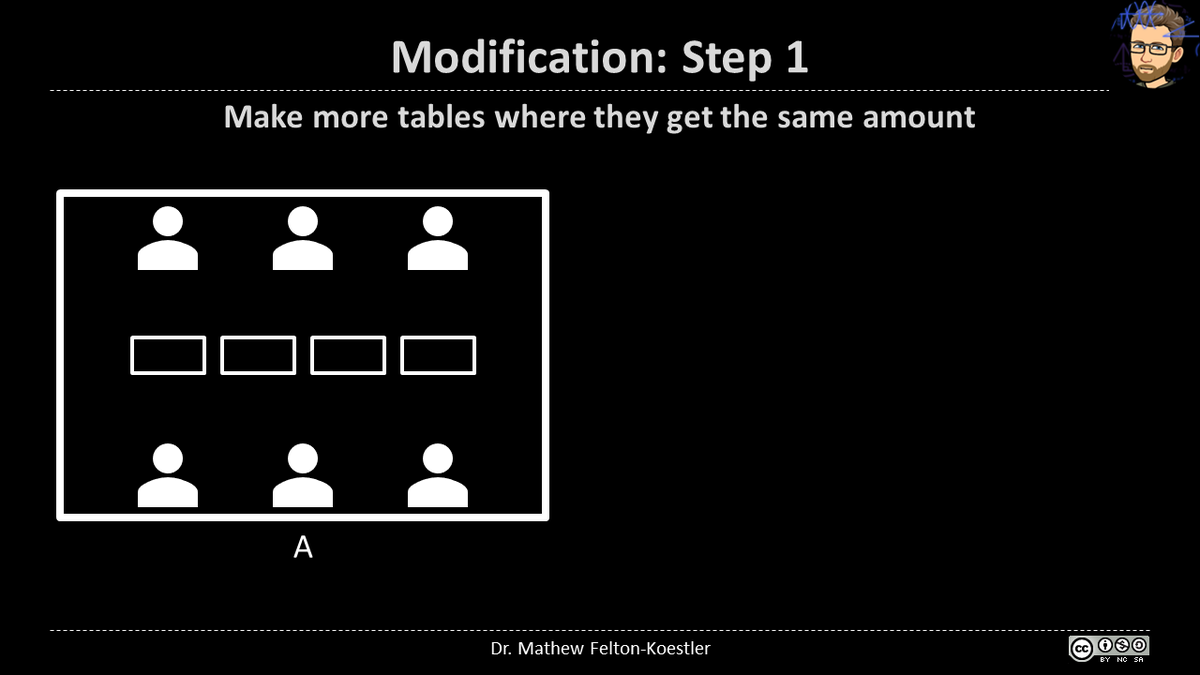
ALT Power point slide. Text: "Modification: Step 1. Make more tables where they get the same amount." Image: Table A with 6 people and 4 rectangles.
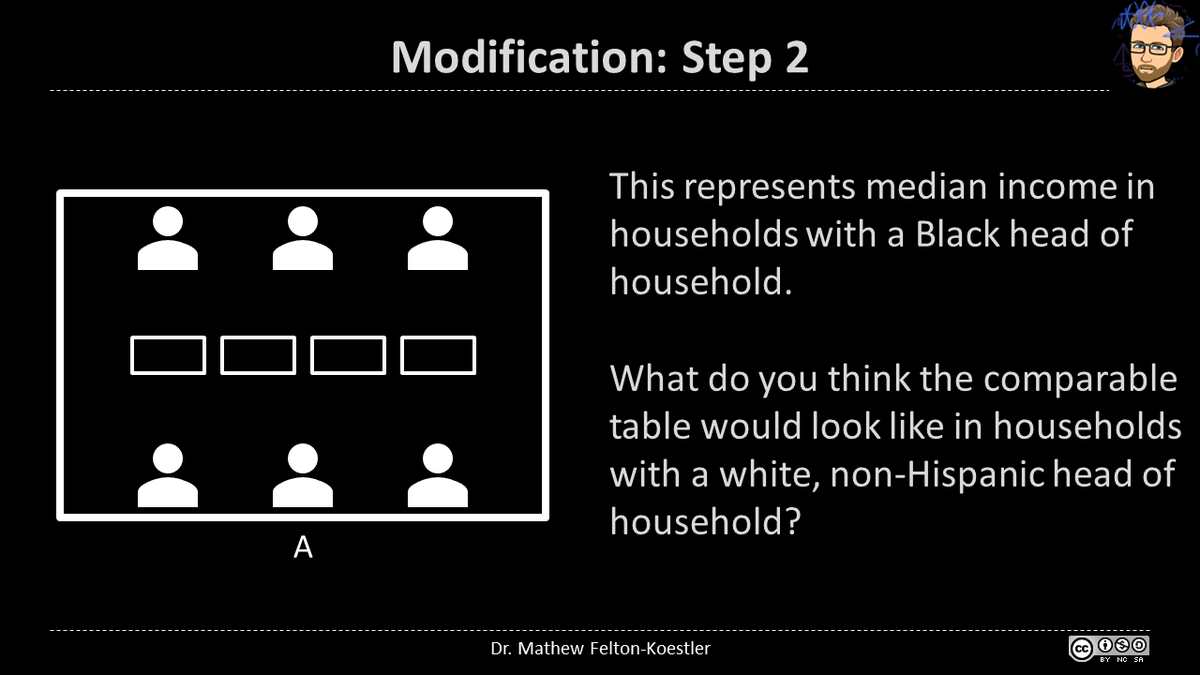
ALT Power point slide. Text: "Modification: Step 2. This represents median income in households with a Black head of household. What do you think the comparable table would look like in households with a white, non-Hispanic head of household?" Image: Table A with 6 people and 4 rectangles.
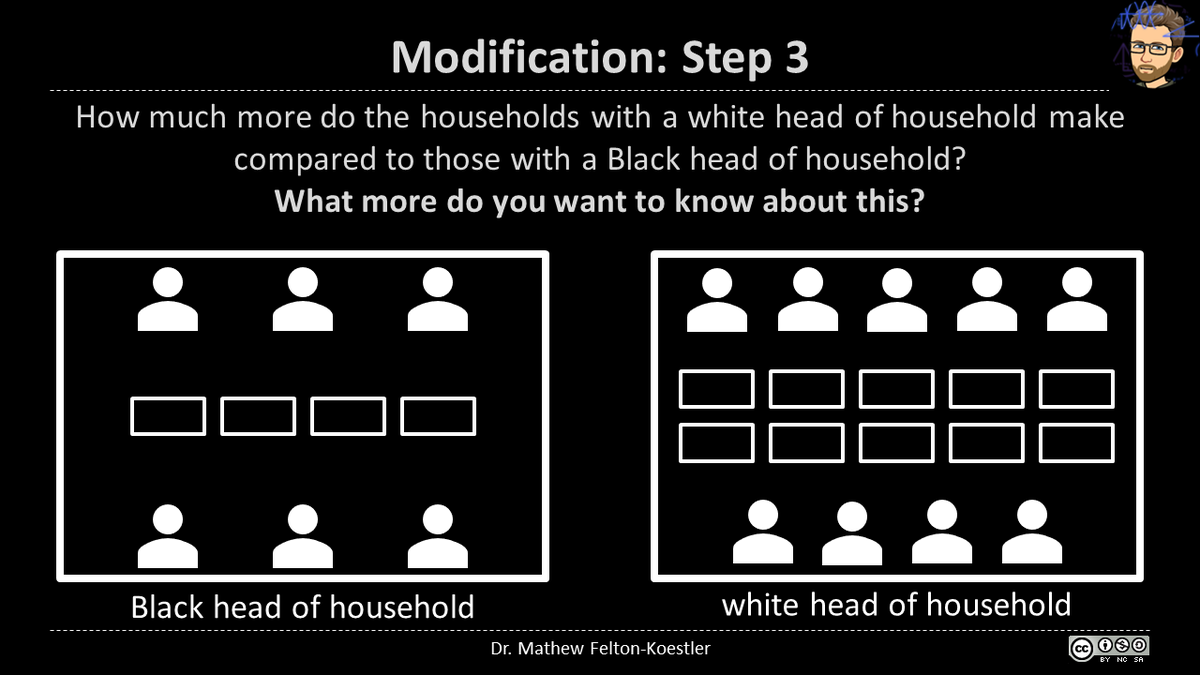
ALT Power point slide. Text: "Modification: Step 3. How much more do the households with a white head of household make compared to those with a Black head of household? What more do you want to know about this?" Image: Table "Black head of household" with 6 people and 4 rectangles. Table "white head of household" with 9 people and 10 rectangles.