Jun 14
IQM Quantum Computers Appoints Barbara Venneman to Board, Accelerates Nasdaq ... - Minichart minichart.com.sg/2026/06/13/… #QuantumComputing
9

May 1
(MT5) #EDGE-MT5# Template Caster for MiniChart (任意のミニチャートに任意のテンプレートを適用できるインジ)
mt4indi.officialblog.jp/arch…
3
130

Apr 22
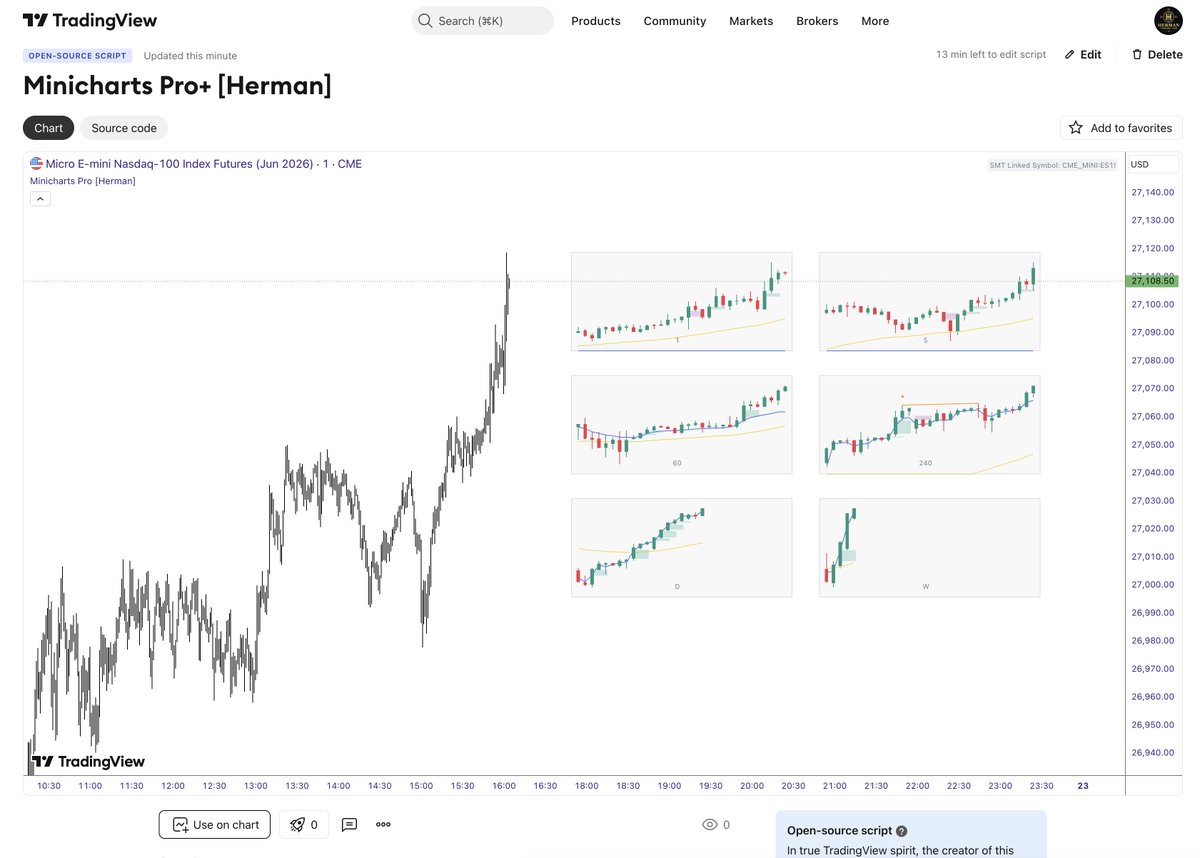
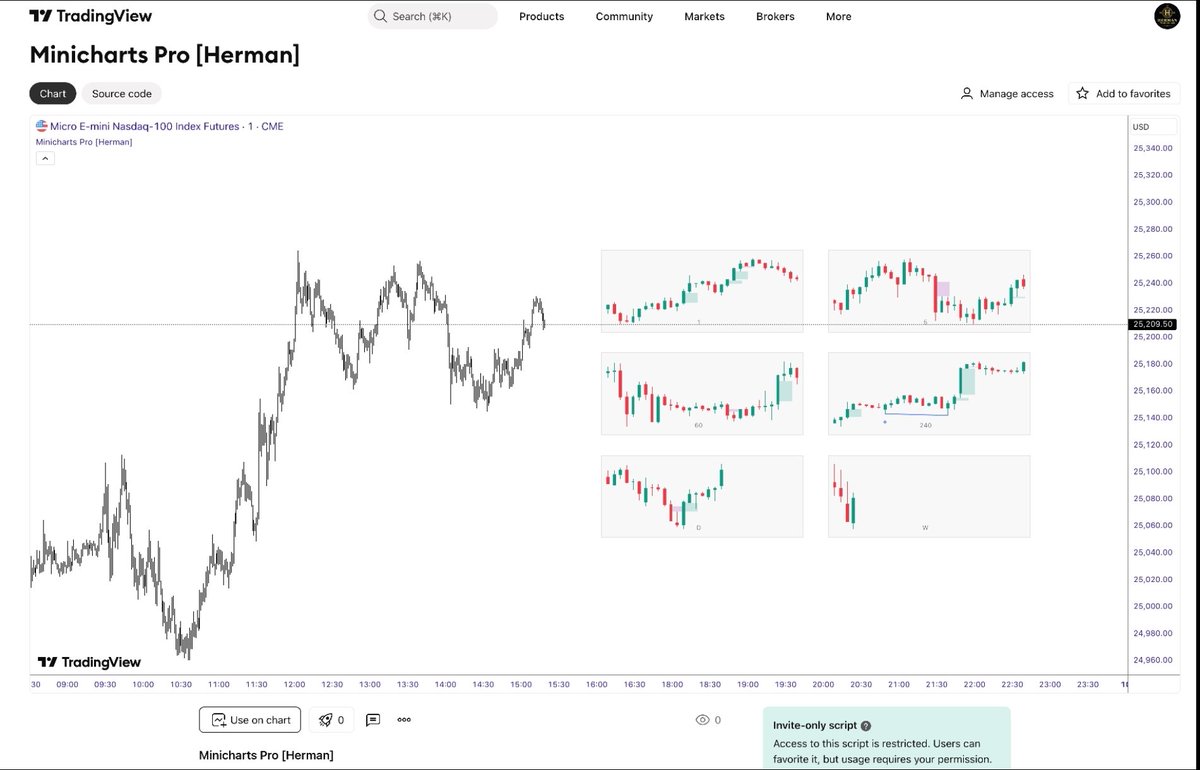
🚨 I DIDN’T PLAN TO RELEASE THIS… but here we are.
Minicharts Pro [Herman] is now LIVE on TradingView.
100% FREE.
100% OPEN SOURCE.
Most traders don’t lose because of bad entries.
They lose because they trade without CONTEXT.
• Jumping between timeframes
• Missing HTF structure
• Forcing bias on incomplete information
• Losing the bigger picture the moment price starts moving
That’s the real problem.
So I built the solution.
Now every timeframe you trade lives on ONE screen.
No switching.
No chaos.
No guessing.
Just structure.
Clarity.
Execution.
This is not “just another indicator.”
This is how multi-timeframe trading should have always been done.
Built-in from day one:
• FVG iFVG
• EMA (toggle per minichart)
• VWAP (toggle per minichart)
• HTF FVG Zones
• SMT Comparison
• Fully customizable layout
And yes
It’s OPEN SOURCE.
The code is yours.
The community can build it.
Improve it.
Evolve it.
Built for traders who refuse to lose HTF context the second price starts moving.
This will be one of those tools you actually use every single day.
Link in first comment below 👇
Who’s adding Minicharts Pro to their layout immediately? 🔥
#TradingView
Apr 20

Free @tradingview indicator dropping Wednesday.
Every timeframe you trade on.
One screen.
Zero switching.
Built for traders who lose HTF context the moment price starts moving.
44
59
706
110,331

Apr 6
I basically asked it to scan the S&P for all market cap greater than 10b, adr>2.5, 8 ema above 20,50,100 and 200 sma with a pullback to the 8ema on low volume showing a bullish hammer at the 8ema touch and show that in a dashboard and show the minichart when you hover over the symbol
1
8
780

1/2 China Real Estate
China Aerospace International Holdings Limited (HK: 31) anticipates a net loss in the range of HK $270 million to HK $290 million for 2025. This represents a considerable widening of losses compared to the net loss of HK $83.85 million recorded in 2024.
The main reason for the further deterioration in results is the ongoing downturn in the commercial real estate leasing market in mainland China, with a particular impact in Nanshan District, Shenzhen.
-minichart
#commercialrealestate

2
3
21
1,388

18 Aug 2025
@martypartymusic please switch the chart please, there is only the S&P minichart ... thx cheers
3
1
31

14 May 2025
Today, we're joined by @madiator, co-founder and CEO of @bespokelabsai, to discuss how reinforcement learning (RL) is reshaping the way we build custom agents on top of foundation models. Mahesh highlights the crucial role of data curation, evaluation, and error analysis in model performance, and explains why RL offers a more robust alternative to prompting, and how it can improve multi-step tool use capabilities. We also explore the limitations of supervised fine-tuning (SFT) for tool-augmented reasoning tasks, the reward-shaping strategies they’ve used, and Bespoke Labs’ open-source libraries like Curator. We also touch on the models MiniCheck for hallucination detection and MiniChart for chart-based QA.
🗒️ For the full list of resources for this episode, visit the show notes page: twimlai.com/go/731.
📖 CHAPTERS
===============================
00:00 - Introduction
3:54 - Importance of data
7:50 - RL as a tool in data curation
10:21 - Curator
12:34 - Contemporary applications of reinforcement learning (RL)
22:33 - Improving models with RL fine-tuning
24:05 - Improving Multi-Turn Tool Use with RL
26:04 - Advantages of RL
31:06 - Reward shaping
33:50 - Findings in applying RL to tool use
35:42 - Examples of applying RL in tool use
40:57 - Compute of RL vs. SFT
43:25 - Future of democritizing agentic tools
46:20 - Evaluation of results
49:45 - Difference of multi-turn from single-turn tool use
52:46 - MiniChart and MiniCheck
57:32 - Bespoke Labs
58:57 - Future directions
4
12
3,505

23 Apr 2025
Happy to announce Bespoke-Minichart-7B!
This was a tough cookie to crack, and involved a lot of data curation and modeling work, but overall very happy with the results!
Congrats to the team and especially to @LiyanTang4 for running so many experiments that helped us understand the problem better and proposing many tricks.
Check out the model at playground and give us feedback. Links below.
23 Apr 2025

Announcing Bespoke-MiniChart-7B, a new SOTA in chart understanding for models of comparable size on seven benchmarks, on par with Gemini-1.5-Pro and Claude-3.5! 🚀
Beyond its real-world applications, chart understanding is a good challenging problem for VLMs, since it requires both mathematical as well as visual reasoning. 1/n🧵
4
7
36
2,779

23 Apr 2025
Excited to announce our MiniChart model: Its 7B SOTA VLM , open weights, and punches way above its weight!
Playground: playground.bespokelabs.ai/mi…
Model, Colab and more info:
huggingface.co/bespokelabs/B…
23 Apr 2025
Announcing Bespoke-MiniChart-7B, a new SOTA in chart understanding for models of comparable size on seven benchmarks, on par with Gemini-1.5-Pro and Claude-3.5! 🚀
Beyond its real-world applications, chart understanding is a good challenging problem for VLMs, since it requires both mathematical as well as visual reasoning. 1/n🧵
2
4
38
3,803

23 Apr 2025
New work led by @LiyanTang4 with a strong new model for chart understanding! Check out the blog post, model, and playground!
Very fun to play around with Bespoke-MiniChart-7B and see what a 7B VLM can do!
23 Apr 2025
Announcing Bespoke-MiniChart-7B, a new SOTA in chart understanding for models of comparable size on seven benchmarks, on par with Gemini-1.5-Pro and Claude-3.5! 🚀
Beyond its real-world applications, chart understanding is a good challenging problem for VLMs, since it requires both mathematical as well as visual reasoning. 1/n🧵
1
10
32
2,707

23 Apr 2025
Check out my work at @bespokelabsai We release Bespoke-MiniChart-7B, a new SOTA in chart understanding of its size
Chart understanding is really fun and challenging and requires reasoning skills beyond math reasoning
It's a great starting point for open chart model development!
23 Apr 2025
Announcing Bespoke-MiniChart-7B, a new SOTA in chart understanding for models of comparable size on seven benchmarks, on par with Gemini-1.5-Pro and Claude-3.5! 🚀
Beyond its real-world applications, chart understanding is a good challenging problem for VLMs, since it requires both mathematical as well as visual reasoning. 1/n🧵
13
31
1,907

23 Apr 2025
We think the Bespoke-MiniChart-7B model is a great starting point for further open model development as well as research!
Model development and usage: The model is open-sourced and is free for non-commercial use.
Research: Visual reasoning 🔍 presents an interesting testbed and shows differences from mathematical reasoning, and a good direction for future research. 6/n
1
6
302
23 Apr 2025
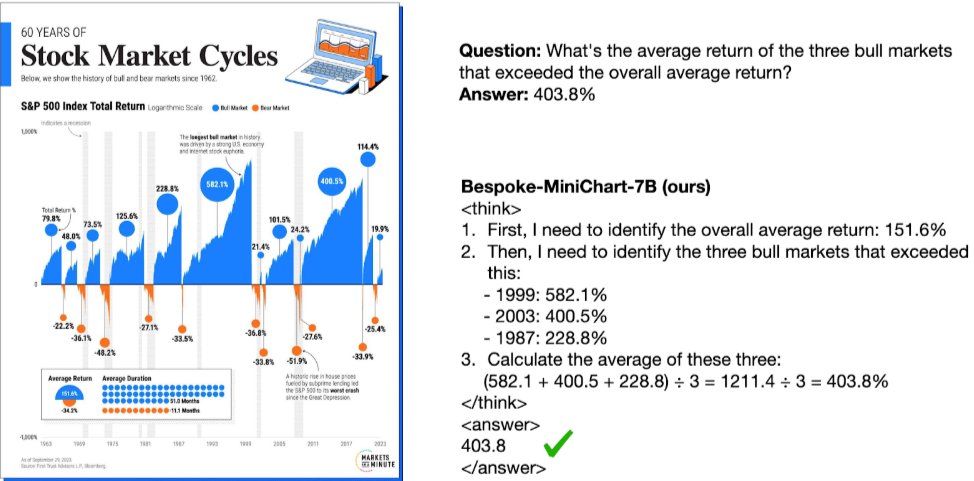
Bespoke-MiniChart-7B is able to analyze complex charts/infographics. Here’s an example below.
You can try more examples yourself in the playground (link below) 5/n
1
1
9
371
23 Apr 2025
Bespoke-MiniChart-7B is not only the SOTA upto 8B category but also outperforms other larger models.
4/n

1
1
9
1,983
23 Apr 2025
Bespoke-MiniChart-7B is trained on carefully curated synthetic data, which follows a four-step pipeline to ensure data quality 📈
1️⃣ Atomic fact extraction (useful for grounding the questions)
2️⃣ Question generation
3️⃣ Answer generation
4️⃣ Question augmentation
Bespoke Curator makes it easy to set up complex data curation pipelines!
2/n
1
8
524
23 Apr 2025
Announcing Bespoke-MiniChart-7B, a new SOTA in chart understanding for models of comparable size on seven benchmarks, on par with Gemini-1.5-Pro and Claude-3.5! 🚀
Beyond its real-world applications, chart understanding is a good challenging problem for VLMs, since it requires both mathematical as well as visual reasoning. 1/n🧵
2
14
67
19,870

17 Mar 2025
It appears you are correct. I am wondering if that also is being used to demonstrate (whether accurately or not), that China's markets are good to invest in over time.
Key Points
It seems likely that the M1 money supply spike in China in January 2025 is due to a definitional change by the People's Bank of China (PBOC), not a sudden economic increase.
The evidence leans toward this spike reflecting the inclusion of new components like personal demand deposits and funds from non-bank payment institutions, effective from January 2025.
Research suggests this revision aims to better measure liquidity, showing stable or slightly improving economic activity, especially during the Chinese New Year.
Background on M1 Money Supply
M1 money supply includes the most liquid forms of money, such as cash and checking accounts, which are readily available for spending. A spike in M1 typically indicates increased liquidity, potentially boosting economic activity.
Reason for the Spike
The spike in January 2025 appears to be largely a statistical artifact. The PBOC revised the M1 definition to include residential demand deposits and customer reserve funds held by non-bank payment institutions, starting in January 2025. This change broadened the scope, leading to a significant jump in measured M1 compared to previous months under the old definition.
Economic Implications
Under the new definition, M1 grew by 0.4% year-on-year in January 2025, an improvement from -1.4% in December 2024, likely driven by seasonal demand during the Chinese New Year. This suggests stable or slightly improving liquidity, which could support consumption. However, the spike itself is not a genuine increase in money supply but a reclassification, so its economic impact needs careful interpretation alongside other indicators.
An unexpected detail is that this revision aligns M1 with practices in other major economies, potentially offering a clearer picture of China's liquidity, which could influence future monetary policy and economic analysis.
Survey Note: Detailed Analysis of China's M1 Money Supply Spike in January 2025
This note provides a comprehensive analysis of the recent spike in China's M1 money supply, focusing on the reasons behind it and its implications for the economy. The analysis is based on recent data and official announcements, aiming to offer a detailed understanding for readers interested in economic trends.
Introduction to M1 Money Supply
M1 money supply is a critical economic indicator, encompassing the most liquid forms of money, including currency in circulation and demand deposits. In China, it traditionally included cash (M0) and corporate demand deposits, reflecting the immediate payment capacity and liquidity available for short-term economic activities. A spike in M1 typically signals increased liquidity, which can stimulate consumption and investment, but it requires careful interpretation, especially when influenced by definitional changes.
Observed Spike in January 2025
Recent data indicates a significant increase in China's M1 money supply from December 2024 to January 2025, with reports suggesting a jump from approximately 67.1 trillion CNY to 112.4 trillion CNY, representing a 68% month-over-month increase. However, this figure raised concerns due to its magnitude, prompting a deeper investigation into the underlying causes.
Reason for the Spike: Definitional Revision by the PBOC
The primary reason for this spike is a revision in the statistical scope of M1 by the People's Bank of China (PBOC), effective from January 2025. According to an announcement on December 1, 2024, by China Daily, the PBOC expanded M1 to include:
Currencies in circulation (M0)
Corporate demand deposits
Residential demand deposits
Customer reserve funds held by non-bank payment institutions
This revision reflects changes in financial product categories due to rapid advancements in payment technologies, such as mobile payments and digital wallets. Previously, personal demand deposits were excluded from M1 because they were less liquid, but with modern payment systems, they now support instant transfers and payments, aligning their liquidity with corporate demand deposits. This inclusion significantly broadened the M1 measure, leading to the observed spike in January 2025 data.
The first reading under the new definition was released in early February 2025, covering January 2025, and included revised figures for previous periods to ensure consistency. For instance, China Daily noted that revised M1 outstanding figures and growth rates from January 2024 would also be provided, facilitating historical comparisons.
Analysis of Growth Rates Under the New Definition
Under the revised definition, M1 growth turned positive at 0.4% year-on-year (yoy) in January 2025, marking an improvement from -1.4% yoy in December 2024, as reported by Minichart. This growth outperformed consensus expectations of -0.5% yoy, suggesting stronger transactional demand, particularly during the Chinese New Year festivities. The following table summarizes key monetary indicators:
Indicator
Jan 2025 (yoy % change)
Consensus
Dec 2024
Nov 2024
M1 Money Supply
0.4
-0.5
-1.4
-3.7
This positive growth indicates that, under the new measure, the economy's liquidity is stable or slightly improving, potentially supporting consumption and economic activity during the festive season.
Economic Implications of the Revision
The inclusion of personal demand deposits and funds from non-bank payment institutions in M1 provides a more comprehensive view of liquid money available in the economy. This is particularly relevant in China, where digital payment platforms like Alipay and WeChat Pay have become dominant, holding significant customer reserves. The revision aligns M1 with practices in other major economies, offering a clearer picture of liquidity dynamics.
However, the spike itself is largely a statistical artifact, not a genuine increase in money supply from monetary policy actions. The actual economic impact depends on how these new components behave. For instance, personal demand deposits reflect individual spending power, which could indicate consumer confidence and potential consumption growth. The Global Times article on December 2, 2024, Global Times, highlighted that Wang Qing, chief macroeconomic analyst at Golden Credit Rating International, suggested M1 growth may further recover following the revision, implying potential positive effects on economic activity.
The 0.4% yoy growth in January 2025, driven by seasonal demand, suggests that liquidity conditions are supportive, especially during high-consumption periods like the Chinese New Year. However, comparisons with previous years need caution, as the new definition may inflate growth rates compared to the old measure. For example, the -1.4% yoy in December 2024 was under the old definition, while January 2025's 0.4% is under the new, making direct year-over-year comparisons less straightforward without revised historical data.
Broader Economic Context
China's economy has been facing challenges, including slowing productivity growth and a declining workforce, with potential growth projected to slow to around 3.8% between 2025-30 without major reforms, according to IMF Working Papers. The M1 revision could help policymakers better monitor liquidity, especially as the economy transitions toward more consumption-based growth. The positive M1 growth in January 2025, even if partly seasonal, could signal early signs of recovery in liquidity, supporting consumption and investment.
An unexpected detail is that this revision may influence future monetary policy, as the PBOC aims to strengthen monitoring of M2 and overall social liquidity, as mentioned by Governor Pan Gongsheng in China Daily. This could lead to more targeted interventions to manage liquidity and support economic stability, especially in light of global economic pressures and potential trade tensions.
Conclusion
The spike in China's M1 money supply in January 2025 is primarily due to the PBOC's definitional revision, including new components like personal demand deposits and non-bank payment institution funds. This change aims to better reflect the economy's liquidity, showing a 0.4% yoy growth under the new measure, suggesting stable or slightly improving conditions, particularly during the Chinese New Year. While the spike is not a genuine economic increase, it provides a more accurate measure of liquid money, potentially supporting consumption and economic activity, though comparisons with past data require caution due to the definitional shift.
Key Citations
China broadens M1 money supply measure Chinadaily.com.cn
China’s January Money Supply M1 Growth Turns Positive Amid Seasonal Demand Minichart
China Money Supply M1 TradingEconomics
China Money Supply M1 1997 – 2024 CEIC Data
China M1 money supply 2023 Statista
China’s central bank revises statistical scope of M1 Global Times
China’s Path to Sustainable and Balanced Growth IMF Working Papers
1
1
57

14 May 2024
pretty happy with the financials / ratios overview so far. i'd welcome any feedback on how to improve it/make more legible. thanks @TTL_TM for pointing out that the minichart should be red/green (was blue before). it's such a small detail that makes a huge difference tho.
bonus points if you can guess which company this cashflow statement is of

4
1
6
841