
7 Dec 2025
🚀 New Post: See It All
Unlock full visibility into your systems with monitoring and observability best practices....
🔗 Read more: kubaik.github.io/see-it-all
#CloudNative #MonitoringStack #Metaverse #developer #technology
1
10
3 Dec 2025
🚀 New Post: See It All
Unlock full visibility into your systems with monitoring and observability insights....
🔗 Read more: kubaik.github.io/see-it-all
#CloudNative #DevOpsTools #Observability #VectorDB #MonitoringStack
1
14

3 Dec 2025
From Raw Metrics to Real-Time Alerts — Instant Insight
buff.ly/EMABvsH
#Observability #MonitoringStack #DevOpsTools #ServerAlerting #GrafanaMonitoring #PrometheusMetrics #HostnExtra #CloudInfra
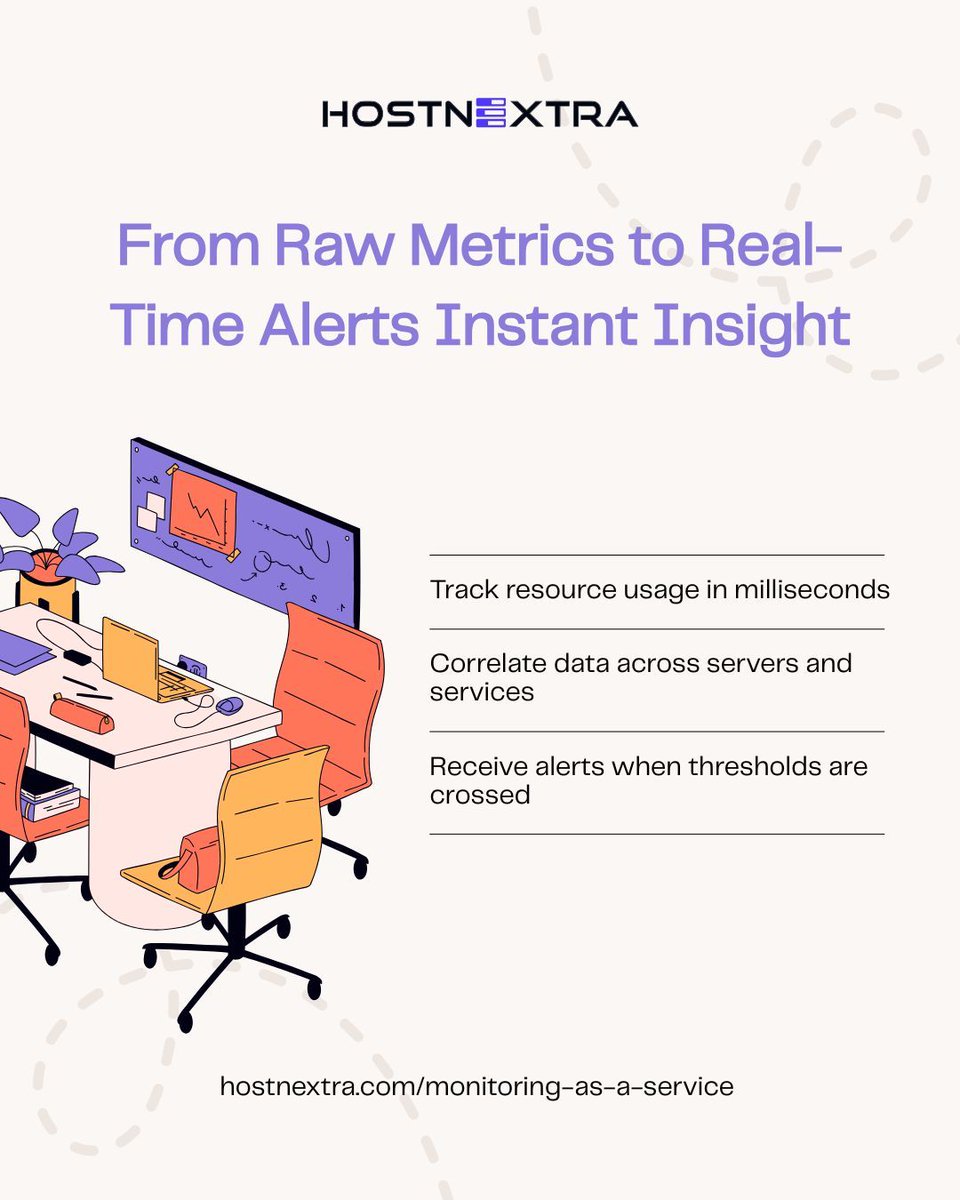
ALT Monitoring as a Service HostnExtra
7

19 Jul 2025
Try this:
Push logs from microservices to Loki ➡️ Correlate with Prometheus metrics ➡️ Display in Grafana.
Boom — Instant war room starter pack 🚀 #MonitoringStack #Grafana #Prometheus #Loki
1
72

19 Jun 2025
Popular tools:
🟣 Datadog
🟢 New Relic
🔵 Sentry
🟠 Prometheus Grafana Cloud
🔴 AWS CloudWatch
🔷 Azure Monitor
Plug into your LMS, SIS, DBaaS, or FaaS pipeline. Instant insights, no DIY dashboards.
webarclight.com
#CloudInfra #MonitoringStack
4
58

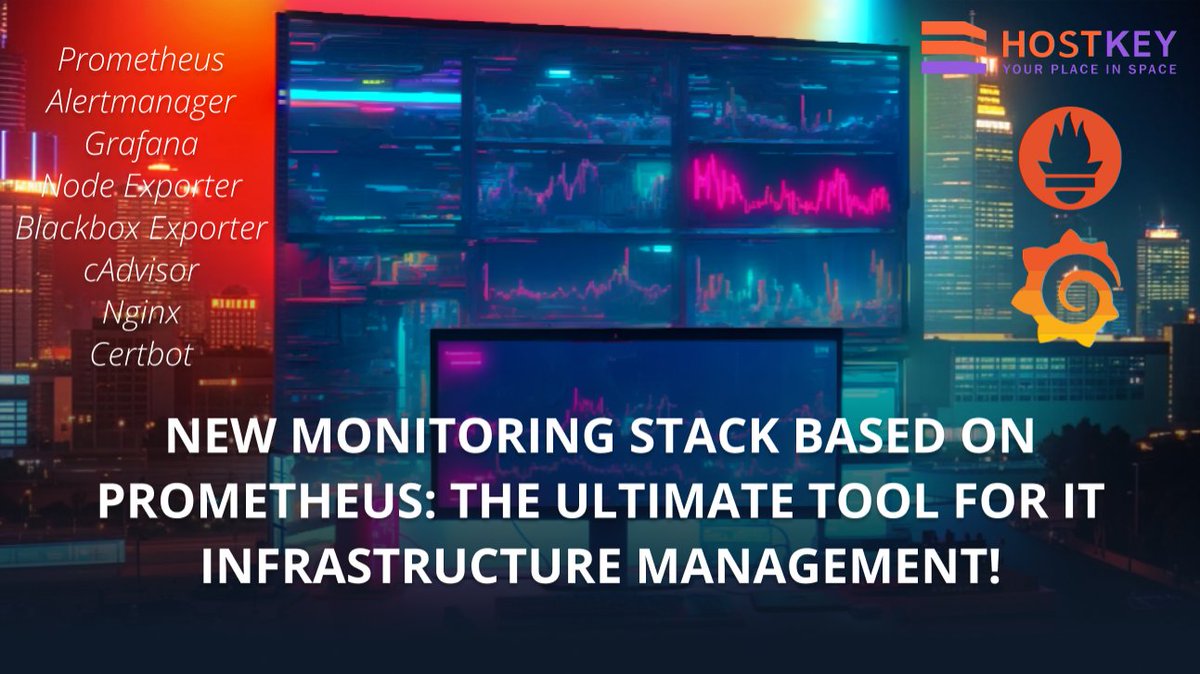
Boost IT infrastructure performance with our Monitoring Stack! 🔒 Collects, stores & queries metrics in real-time. Get alerts via Telegram bot when issues arise. 💻
hostkey.com/apps/monitoring/…
#MonitoringStack #ITInfrastructureManagement #Automation
46

19 Apr 2024
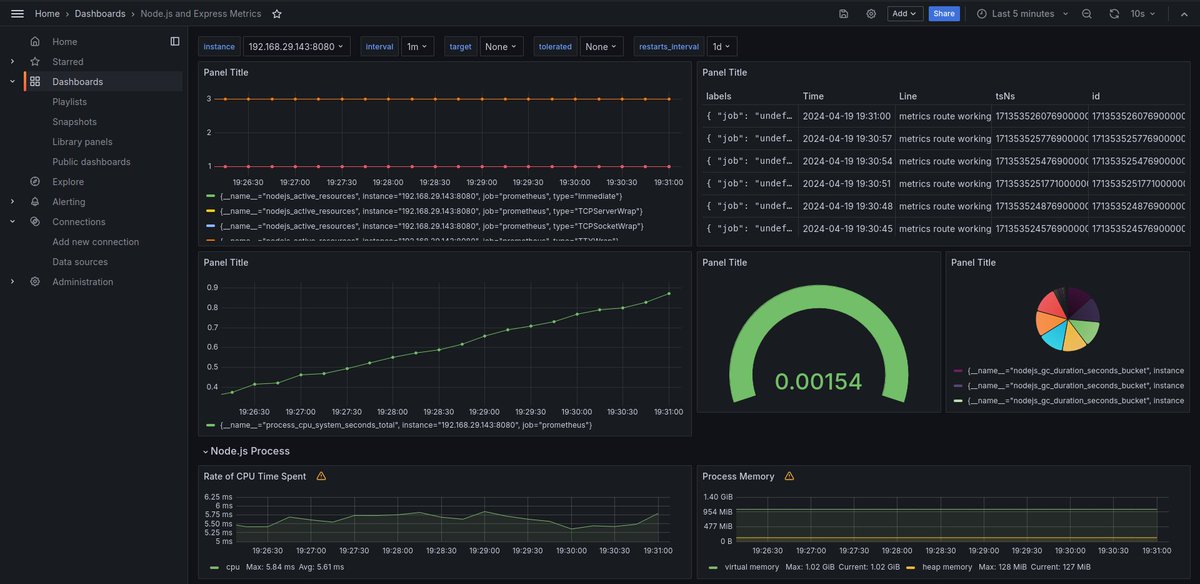
🚀 Introducing Grafana Prometheus Monitoring Stack! 📊 Visualize metrics with Prometheus, track logs with Grafana Loki, and optimize performance in Grafana. Elevate your monitoring experience! github.com/skushagra9/Grafan…
#Grafana #Prometheus #MonitoringStack
1
150

21 May 2023
📢 Discover the Power of Prometheus Monitoring Stack in your Cloud Environment! ⚡️🌩️
#cloudenvironments, #metrics, 📊🔍 Explore the incredible features of Prometheus and Grafana. 🚀
youtu.be/Xg-uOaI7eaA
#Prometheus #MonitoringStack #OpenSource #Grafana #DevOps #Observability
1
18

15 May 2023
🌟 Want to know more about how I did it? Let's connect and share knowledge! 🤝💬 #Networking #LearningTogether #ConnectWithMe
#TechEnthusiast #MonitoringStack #ApplicationDeployment #KubernetesJourney
1
45