
Jun 17
Polymarket official trading bot is now out, take a look:
x.com/RepPeteStauber/status/…
@KellenPDL @kwjo__ @PiCycleTop x.com/i/broadcasts/BBqtMv3oJ…
This tweet is unavailable
4

Mar 1
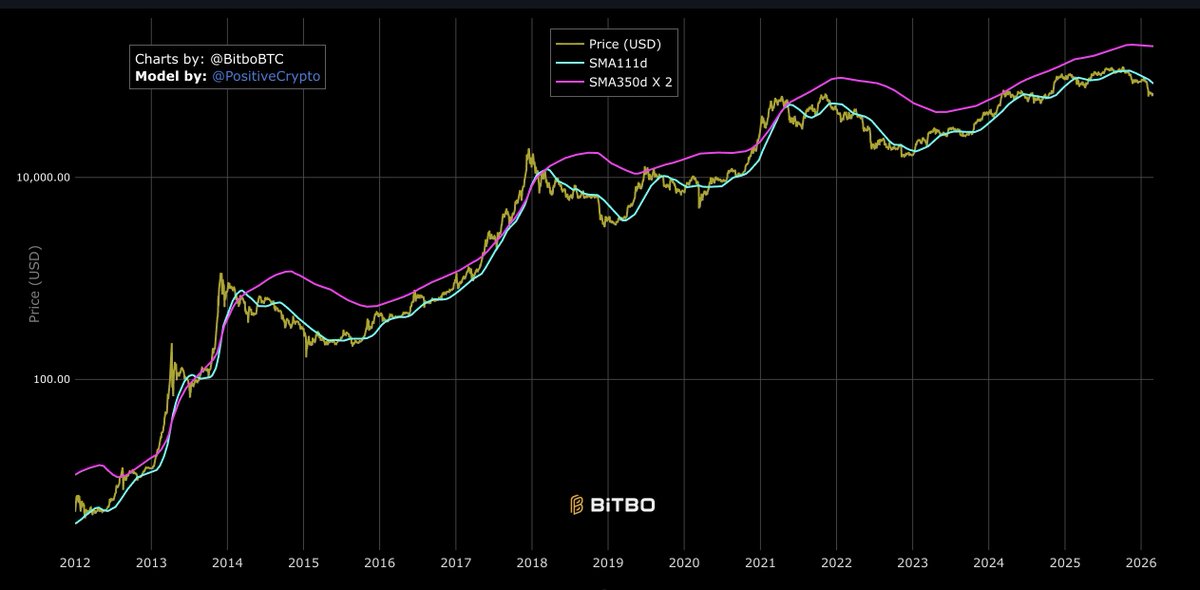
Ở các chu kỳ trước có thể dùng chỉ báo Pi Cycle Top để xác định vùng đỉnh giá Bitcoin: Khi nào đường SMA111d cắt lên SMA350dx2 thì lúc đó chính là đỉnh!
=> Nhưng chu kỳ này thì SMA111d chưa cắt hoặc không cắt lên SMA350dx2 như những lần trước.
#SMA111d #SMA350dx2 #PiCycleTop
5
1
47
5,104

Feb 13
Feb 10

An individual with a distinguished history in crypto ( 2011 ) gave me privileged intel to perfectly trade #Bitcoin cycles
17
18
145
21,843

27 Nov 2025
🚨 $BTC euphoric?
The #PiCycleTop has flagged previous cycle peaks within DAYS.
Learn the rule (111D MA vs 2×350D MA), how to use it, and why it’s a risk signal—not a crystal ball.
Read:
medium.com/p/pi-cycle-top-in…
#CryptoTrading #TradingStrategy
1
202

7 Oct 2025
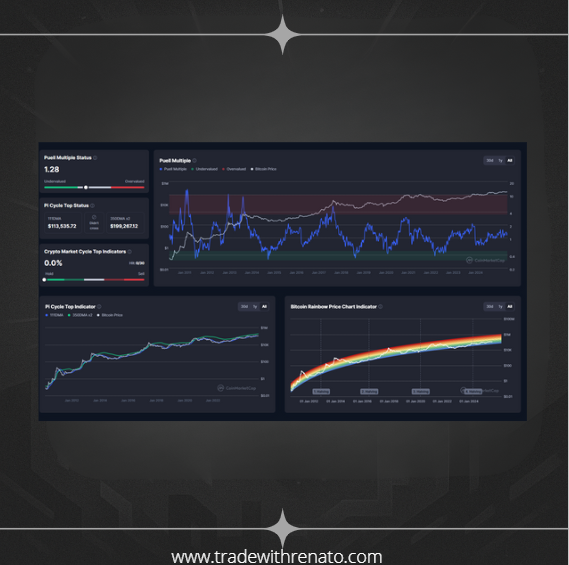
Indicators show that Bitcoin is in a mid-cycle phase, with a low probability of a top and high potential for future appreciation. The market appears to be in a healthy growth phase, ideal for those looking to catch the next big bullish move.
#ulianov #renatoulianov #BitcoinCycle #CryptoMarket #BTCAnalysis #PuellMultiple #PiCycleTop #RainbowChart #TradeWithRenato
13
12
173

29 Aug 2025
September/October FED Rate Cuts are coming.
How will the market perceive them?
Higher Altseason inc
#Bitcoin #btc #PiCycleTop

1
8
189

27 Aug 2025
Yo CKC,
If this chart is the holy grail, then we have much further to go in this cycle that I and the vast majority expect.
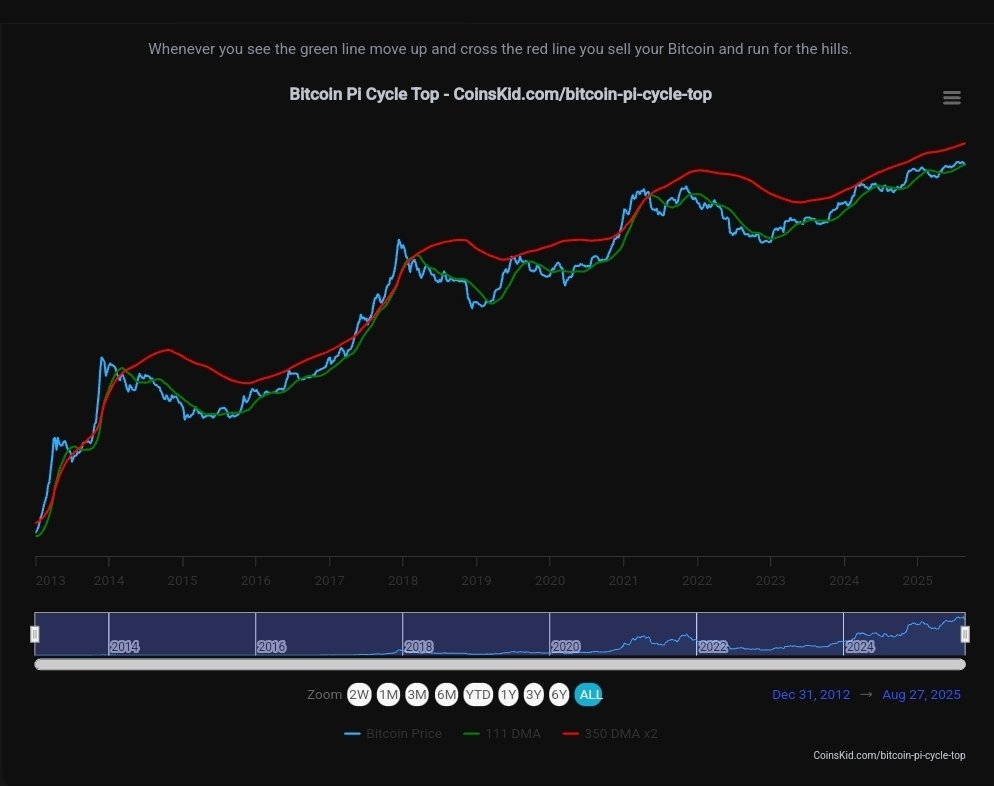
In every cycle, the true parabolic phase begins once we see #btc get above the 350 DMA x2 (red line) in the #picycletop.
It could be the reason why we have not seen the golden cross on the PI Cycle top yet which has nailed every top with pin point precision and also the structural characteristics of the top between #btc & #total2 that I have been patiently waiting for with you for many years.
If techdev's chart is the cheat sheet and we see $btc continue to trend up into 2026 then hold on, we are in for a very bumpy ride as the 4 year peak to peak cycle is out of the window and we are in unchartered waters for #crypto
STAY TUNED CKC
25 Aug 2025

It’s not just the tops.
Every “bear market” has ended precisely as red turned to green.
Every “ramp” has lasted as long as bars were green.
Every “hockey stick” has been marked by green flipping red (not the halving).
And yes, every “top” has been marked by a peak in red.
The business cycle’s dynamics are all that’s been needed to understand Bitcoin’s.
Even the profiles of the reds match the profiles of the bull runs ffs.
All I see is “this cycle is so different”, f*ck this cycle”, or “cycle almost over”…
What’s actually different?
Green has been longer, and thus the ramp has been longer - that’s all.
Red hasn’t even started. Doesn’t seem like most will be here when it does. Will you?

20
22
157
23,793

26 Aug 2025
The Pi Cycle Top has predicted every Bitcoin cycle peak… but will it catch the next one?
I break down why it works, introduce my Pi Cycle Top Oscillator, and show why BTC is still far from a blow-off top.
Watch here 👉🏼 youtu.be/_l8aifLSpVs
#Bitcoin #BTC #PiCycleTop #Crypto
2
6
42
1,643

1 Aug 2025
Just change the ascending line so it’s parallel with the top line and you have a bullish rectangle. Then the narrative remains unchanged.
1
2
32

24 Jul 2025
.
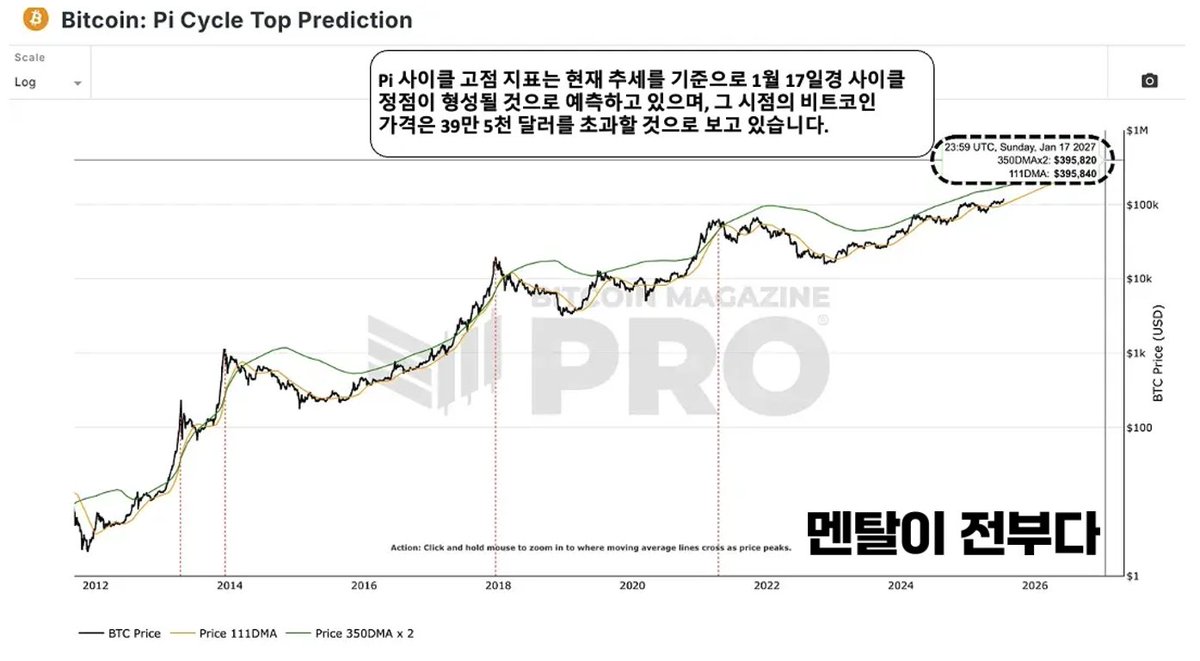
📈 Pi Cycle Top 지표 📈
이번 사이클 고점은?
350일 이동평균선×2와 111일 이동평균선의 교차로 고점을 예측하는 Pi Cycle 지표는 과거 사이클에서 정점 포착에 높은 정확도를 보여준 바 있습니다.
현재 추세를 기준으로 하면, 해당 지표는 2027년 1월 17일경 고점 도달을 시사하고 있으며 비트코인 예상 가격은 약 39만 5천 달러 수준입니다.
다만, 실제로 골든크로스가 발생하려면 BTC가 해당 구간(약 20만 달러 이상)을 수개월 이상 안정적으로 상회해야 하기 때문에 현실적인 관점도 함께 필요합니다.
✅ 리스크 관리용 보조지표로는 여전히 유효하지만 이번 사이클의 단일 고점 예측 근거로만 해석하는 것은 주의가 필요합니다.
#비트코인 #BTC #PiCycleTop #비트코인차트 #사이클분석 #암호화폐
2
1
14
1,225

23 Jul 2025
📈 Ce este Pi Cycle Top și de ce contează?
Unul dintre cei mai simpli și eficienți indicatori care a prezis fiecare vârf de Bitcoin din ultimii 10 ani.
⠀
🧠 Cum funcționează?
✅ 111-day MA (media mobilă)
✅ 2x 350-day MA
Când 111 MA depășește 2x 350 MA → istoric, urmează un top de ciclu.
⠀
🔍 În 2021 a semnalat topul la $64K, înainte de crash.
⠀
⏳ Acum? Suntem aproape. Indicatorul încă nu dat Semnalul
Bull-ul n-a murit, dar e obosit.
⠀
🎯 Pentru începători:
Nu intra all-in la FOMO.
Nu ignora semnalele vechi care chiar funcționează.
⠀
Bear-ul nu vine cu breaking news. Vine tăcut, după lăcomie extremă.
⠀
#Crypto #Bitcoin #Trading #EducatieCrypto #PiCycleTop
1
46
2,311

13 Jul 2025
INSIGHT: The Pi Cycle Top indicator pretty much nailed the last 3 bull market peaks — and currently it’s nowhere near signaling the top.
We are set to go much higher 👀🚀
#PiCycleTop #Bitcoin
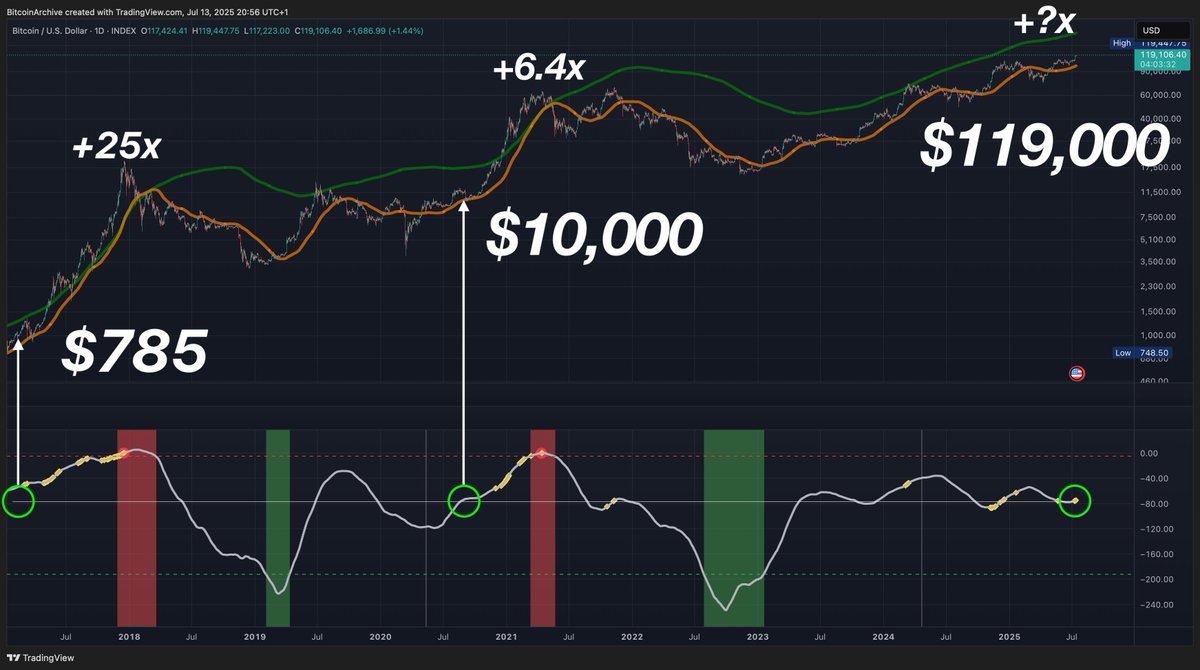
13 Jul 2025

The Pi Cycle Top indicator picked the precise top of the last 3 bull markets.
It is not even close to indicating the peak of this bull run.
At the same stage of the last 2 bull markets, Bitcoin went up 25x and 6.4x from this point in the cycle.
This time? 🤔
1
5
128

10 Jul 2025
Bugger off Pi Cycle Top - you're not welcome round here yet.
2
2
37

9 Jul 2025
1
1
17


7 Jun 2025
ok, then I apologize for assuming I was the main character 😂 my bad joe
3
146

7 Jun 2025
.@operationdanish I am was actually responding to this tweet — not you.
7 Jun 2025

Which is why residential real estate is a Ponzi scheme
The system constantly requires the younger generation to take out more and more leverage to keep values rising/not collapsing
Thanks for bringing this to light Joe
2
2
627

