
May 15
Want to learn Pine Script but don't know where to start?
I wrote a tiny indicator called "Volume X-Ray" — just ~60 lines. Perfect for your first hands-on practice, even if you've never coded before.
What it does: splits each candle into estimated Buy vs Sell volume and shows you a clean little table on the chart.
🧪 Try it yourself (takes 2 minutes):
1. Open any chart on TradingView
2. Click "Pine Editor" at the bottom
3. Delete everything in the editor
4. Paste the code from my reply below
5. Click "Add to chart"
6. You should see a small table in the top right corner
That's it — you just ran your first Pine Script.
📖 Now the fun part — learning by tweaking:
→ Change "3" to "5" in the Candles input — see more history
→ Open Settings and switch Source from "Volume" to "Footprint"
If you're on a Free or Essential plan, TradingView will show an upgrade message when you switch to Footprint. That's normal — it means footprint data needs Premium or Ultimate.
This is a great way to discover what different TradingView plans unlock for coders.
If you're on Premium/Ultimate, switch between both modes and compare — the estimated numbers vs real order flow data. The difference is eye-opening.
💬 Questions? Stuck on something? Drop a comment — I'll answer every single one. Seriously. That's why I'm posting this.
Code 👇
// Volume X-Ray · See buy/sell force inside every candle
// Free plan: estimated · Premium: real footprint data
// Switch modes in Settings → "Source"
//@version=6
indicator("Volume X-Ray", overlay = true)
string src = input.string("Volume", "Source", options = ["Volume", "Footprint"])
int N = input.int(3, "Candles", minval = 1, maxval = 5)
fv(float v) => v >= 1e6 ? str.tostring(v/1e6,"#.#") "M" : v >= 1e3 ? str.tostring(v/1e3,"#.#") "K" : str.tostring(v,"#.#")
var array<float> bArr = array.new<float>()
var array<float> sArr = array.new<float>()
var array<float> dArr = array.new<float>()
var array<float> pArr = array.new<float>()
float bv = 0.0, float sv = 0.0, float poc = na
if src == "Footprint"
footprint fp = request.footprint(1, 70)
if not na(fp)
bv := fp.buy_volume()
sv := fp.sell_volume()
volume_row pr = fp.poc()
poc := not na(pr) ? pr.down_price() : na
else
float d = high != low ? (close - open) / (high - low) : 0.0
bv := volume * (1 d) / 2
sv := volume * (1 - d) / 2
if not na(bv)
array.push(bArr, bv), array.push(sArr, sv)
array.push(dArr, bv - sv), array.push(pArr, poc)
while array.size(bArr) > N
array.shift(bArr), array.shift(sArr)
array.shift(dArr), array.shift(pArr)
var table t = na
if barstate.islast and array.size(bArr) > 0
if not na(t)
table.delete(t)
int nc = array.size(bArr)
int rows = src == "Footprint" ? 5 : 4
t := table.new(position.top_right, nc 1, rows, bgcolor = #131722, border_color = color.new(#363A45, 50), border_width = 1)
string lbl = src == "Footprint" ? "" : "~"
string[] rn = array.from(lbl "Buy", lbl "Sell", "Delta", "POC")
for r = 0 to (src == "Footprint" ? 3 : 2)
table.cell(t, 0, r 1, array.get(rn, r), bgcolor = #1E222D, text_color = color.gray, text_size = 10)
table.cell(t, 0, 0, src == "Footprint" ? "FP" : "Vol", bgcolor = #1E222D, text_color = #FF9800, text_size = 10, text_formatting = text.format_bold)
for i = 0 to nc - 1
float b = array.get(bArr, i), float s = array.get(sArr, i), float dl = array.get(dArr, i)
table.cell(t, i 1, 0, "C" str.tostring(i 1), bgcolor = #1E222D, text_color = color.white, text_size = 10, text_formatting = text.format_bold)
table.cell(t, i 1, 1, fv(b), bgcolor = color.new(#26A69A, 80), text_color = #26A69A, text_size = 10)
table.cell(t, i 1, 2, fv(s), bgcolor = color.new(#EF5350, 80), text_color = #EF5350, text_size = 10)
color dc = dl > 0 ? #26A69A : #EF5350
table.cell(t, i 1, 3, (dl>0?" ":"") fv(dl), bgcolor = color.new(dc, 85), text_color = dc, text_size = 10, text_formatting = text.format_bold)
if src == "Footprint"
float pc = array.get(pArr, i)
table.cell(t, i 1, 4, na(pc) ? "–" : str.tostring(pc,"#.####"), bgcolor = #131722, text_color = #FF9800, text_size = 10)
#PineScript #LearnToCode #TradingView #PineScriptV6 #CodingForBeginners #AlgoTrading #TradingEducation #VolumeAnalysis #OrderFlow #FootprintChart #TechnicalAnalysis #VolumeProfile #DayTrading #SwingTrading #CryptoTrading #ForexTrading #FuturesTrading #StockMarket #SmartMoney #TradingTools #BuySellDelta #MarketStructure #TradingCommunity #CodeNewbie #QuantTrading #ChartAnalysis #InstitutionalFlow #PriceAction #OpenSource #WallStreet
2
3
969
May 8
📰 News: just published Episode 07 of the Smart Trader series on TradingView 🧬
This one introduces a new metric called B that measures buyer/seller pressure purely through triangle geometry. No volume, no oscillators. It derives a single dimensionless number from the area ratio of two right triangles inside an isotropic coordinate system normalised by Yang-Zhang volatility.
B moves between −1 and 1, stays structurally comparable across instruments and timeframes, and can serve as an oscillator, a weighting coefficient, a divergence layer, or an entry filter.
Fully open-source. Pine Script v6. The complete derivation, formulas, and code are published transparently. Take it, build on it 🔸
Full description and code:
tradingview.com/script/uEmD9…
#TechnicalAnalysis #BuyerSellerPressure #PineScript #TradingView #OpenSource #MarketStructure #VolatilityMeasure #GeometricAnalysis #AlgoTrading #QuantFinance #PineScriptV6 #TradingTools #MarketAnalysis #CryptoAnalysis #ForexTrading #StockAnalysis #DataDrivenTrading #TrendAnalysis #RiskManagement #FinTech #TradingEducation #MarketMetrics #PriceAction #SmartTrader #AlgorithmicTrading #TradingStrategy #TradingCommunity #ChartAnalysis #WallStreet #ComputationalFinance

2
259
May 8
📰 Yeni haber dostlar,
Smart Trader serisinin 7. bölümünü TradingView'de yayınladım 🧬
Bu göstergede alıcı ve satıcı baskısını tamamen geometrik bir yöntemle ölçen yeni bir metrik geliştirdim: B. Hacim veya osilatör kullanmıyor. İki üçgenin alan oranından türetilen, −1 ile 1 arasında hareket eden, boyutsuz ve enstrümandan bağımsız tek bir sayı.
Kod tamamen açık kaynak. Formüller, türetim süreci, her şey şeffaf. İsteyen alıp üzerine inşa edebilir 🔸
Detaylı açıklama ve kodun tamamı için:
tradingview.com/script/uEmD9…
#TeknikAnaliz #AlımSatımBaskısı #PineScript #TradingView #GöstergeGeliştirme #AçıkKaynak #PiyasaAnalizi #VolatiliteÖlçümü #GeometrikAnaliz #HacimAnalizi #AlgoTrading #KantitatifFinans #PineScriptV6 #YatırımAraçları #BorsaStratejisi #KriptoAnaliz #ForexTeknik #HisseAnalizi #VeriOdaklıTicaret #PiyasaYapısı #TrendAnalizi #RiskYönetimi #FinansTeknoloji #BorsaEğitimi #YatırımcıAraçları #SermayePiyasaları #SmartTrader #AlgoritmikTicaret #Türkiye #MatematikselvFinans

3
5
62
4,002

Jan 18
Pine Script dünyasında "imkansız" diye bir şey olmadığını kanıtladık mı? 👀💻
Backtest sonuçları geldi ve sayılar yalan söylemez:
Kar Faktörü: 83,823 (Yanlış görmediniz!)
Başarı Oranı: �,71 (35 işlemin 30'u TP)
Maksimum Drawdown: Sadece %3,54
Algoritmik trade'de disiplin ve doğru matematik birleşince sonuçlar bu kadar keskinleşiyor. Bu strateji için "Kutsal Kase" (Holy Grail) desek çok mu ileri gitmiş oluruz? 🏆📈
Biraz daha optimize edip sonuçları paylaşmaya devam edeceğim. Detaylar yolda... 🔥
#PineScript #TradingView #AlgorithmicTrading #Backtest #BTC #KriptoPara #DayTrading #PinescriptV6

4
8
197

Jan 14
The gap between a "good analyst" and a "consistent trader" is systematic execution.
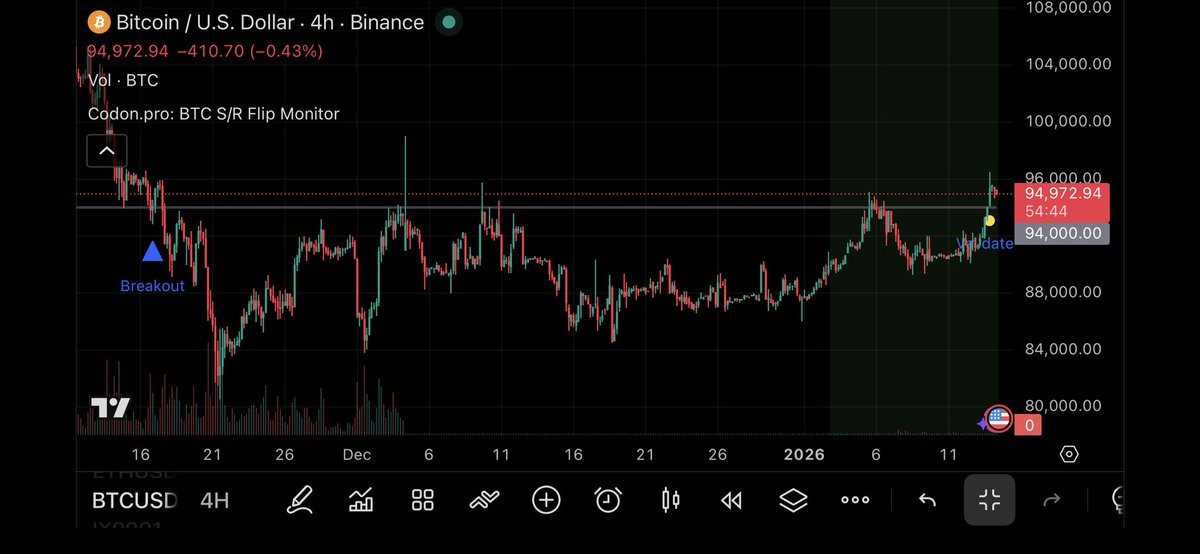
Popeye's 4H S/R flip isn't just a line on a chart; it’s a high-confluence mathematical trigger. I’ve deconstructed the logic behind this move into a Codon.pro monitoring framework.
Precision isn't a feeling. It's an architecture. ↓
#Bitcoin #TradingStrategy #AlgorithmicTrading #PineScriptV6 $BTC

Jan 14

$BTC
Yesterday's analysis ended up being extremely accurate, so here's a quick update.
1. Daily trend still clearly green with a fresh higher high being printed on the daily chart. RSI on the daily is holding above the 50 level. As pointed out several times, the dip to the 50 level was crucial.
2. Local accumulation has broken out. As long as we trade above the 94ish level, I will consider it a legitimate breakout.
3. Price has deviated back inside the higher time frame (HTF) range. As long as we hold here, focus remains on a long bias.
4. As expected, the 4-hour trend held perfectly and became the support level that fueled yesterday's impulsive move.
As long as we don't drop below 94K, I will be focusing on long exposure.

3
2
16
3,187

9 Sep 2025
#TradingStrategy
#VolatilityExpansionCloseStrategy
Here is a trading strategy that is based on volatility contraction expansion concept.
When price finally bursts beyond a narrow range, the move often continues with momentum. The "close breakout" captures this surge by entering on expansion beyond ATR bands.
This strategy keeps you in the market always and is a mini-trend following strategy completely based on ATR.
This strategy usually generates many trades and the average holding period is around 4-5 days. Hence suitable for swing traders.
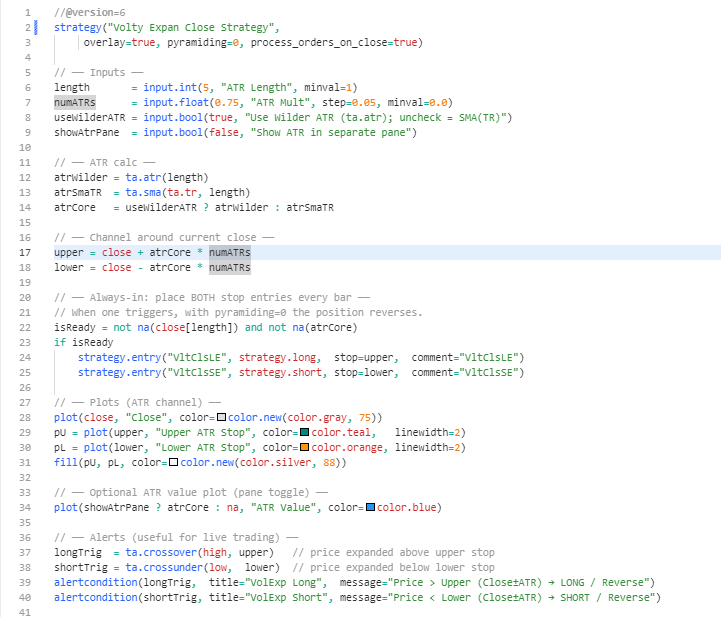
Channel = Close ± ATR(5) × 0.75
Long if price > Upper band
Short if price < Lower band
Always in market → reverses on signal
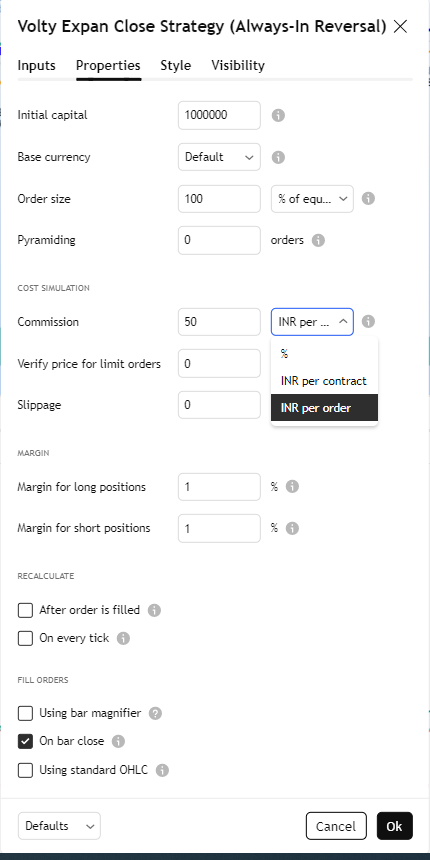
The backtest results on nifty since 1990 has generated multi-fold returns based on the impractical assumption that considers compounding of profits; in settings ensure you reset as per the picture. DO NOT GET CARRIED AWAY BY THE BACKTEST RESULTS.
This strategy is available in tradingview inbuilt indicator under the name "Volty Expan Close Strategy". But it does not plot any channel. Hence I have created one with channel. I have also included a pinescriptv6 for you to explore further hoping it will help few of you. Good Luck.


10
24
224
21,527
