Rahul K. Narayan retweeted
#ChartAnalysis #HarmanpreetKaur
Loaded 4H so captain of Indian womens cricket team
In #T20WorldCup INDIA W can be finalists too as Harmanpreet will be going through positive planetary phases under influence of Jupiter

5
1
27
2,739

🔖 BookMark
↘️↗️ 𝗢𝘃𝗲𝗿𝘀𝗼𝗹𝗱 𝗦𝘁𝗼𝗰𝗸𝘀 | 𝗕𝗲𝗹𝗼𝘄 𝗥𝘀. 500 𝗢𝗻𝗹𝘆 ✅
3️⃣ NTPC – 354
𝗖𝗼𝗺𝗺𝘂𝗻𝗶𝘁𝘆 📌
t.me/TechnicalTradesTT
-
#TechnicalAnalysis
#ChartAnalysis

1
1
152

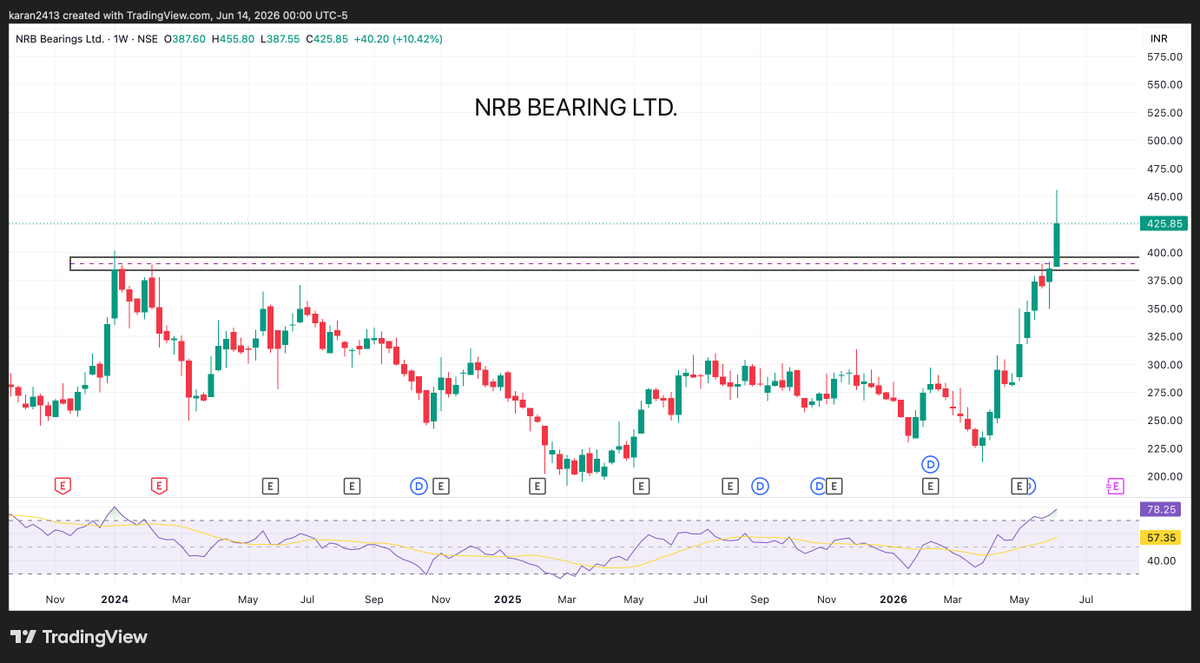
🔥 NRB Bearings Clears Major Resistance – Watching for Retest 👀📈 🔥
Strong weekly breakout above a multi-month resistance zone with momentum expanding. ⚡
✅ Weekly breakout confirmed
✅ Resistance zone cleared
✅ RSI showing strength
✅ Strong price expansion
✅ Watching for a healthy retest of the breakout area
No buying or selling recommendation — simply a chart worth keeping on the radar for price action around the breakout zone. 👀
📚 For Study & Educational Purposes Only
🚫 Not SEBI Registered
🚫 Not Financial Advice
🚫 Not a Buy/Sell Recommendation
#NRBBearings #NRB #BearingsSector #AutoAncillary #AutoComponents #Manufacturing #IndustrialStocks #BreakoutStocks #StocksToWatch #Watchlist #TechnicalAnalysis #PriceAction #VolumeAnalysis #MomentumTrading #MomentumInvesting #RSI #RelativeStrength #TrendFollowing #ChartAnalysis #SwingTrading #PositionTrading #MarketStructure #IndianStocks #StockMarketIndia #NSE #InvestingIndia #TradingView #WealthCreation #MultibaggerWatch #BullishCharts 👀📈🔥⚡🚀
5

📈 MARKET OUTLOOK FOR NEXT WEEK 📈
The Nifty 50 index is approaching a crucial resistance zone near the 24,000 mark. Market experts believe the coming trading sessions will play a key role in deciding whether the recent rebound develops into a stronger uptrend or remains a short-term recovery.
According to market analyst Sudeep Shah, the overall trend remains constructive, but Nifty needs a decisive breakout above key resistance levels to attract fresh buying momentum.
🔹 Key Level to Watch: 24,000 🔹 Breakout Above Resistance Could Trigger Fresh Rally 🔹 Traders Should Maintain Strict Risk Management 🔹 Focus on Strong Stocks Showing Relative Strength
📊 Market participants are advised to stay stock-specific and monitor price action closely as volatility may remain elevated due to global developments.
#Nifty50 #StockMarket #MarketOutlook #Trading #IntradayTrading #OptionTrading #TechnicalAnalysis #ChartAnalysis #Nifty #BankNifty #IndianStockMarket #MarketUpdate #TraderLife #PriceAction #TradingIndia
77

10h
Bitcoin hat es im 1 Stunden Chart geschafft, über den Widerstand sowie die 200er EMA auszubrechen. Jetzt muss weiteres Momentum in den Markt kommen, damit sich das Ascending Triangle vollständig nach oben hin ausspielen kann.
Sollte sich dieser Ausbruch bestätigen und die Stärke anhalten, rückt als nächstes die 800er EMA in den Fokus.
Damit bleibt das Szenario einer Bewegung in Richtung 70.000 $ weiterhin intakt genau das Ziel, das wir bereits seit längerer Zeit im Blick haben.
#Bitcoin #BTC #Crypto #Trading #TechnicalAnalysis #ChartAnalysis #PriceAction #AscendingTriangle #MarketStructure #Liquidity #BTCUSD #CryptoTrading #BitcoinAnalysis #Trader #CryptoMarkets

5
3
470

16h
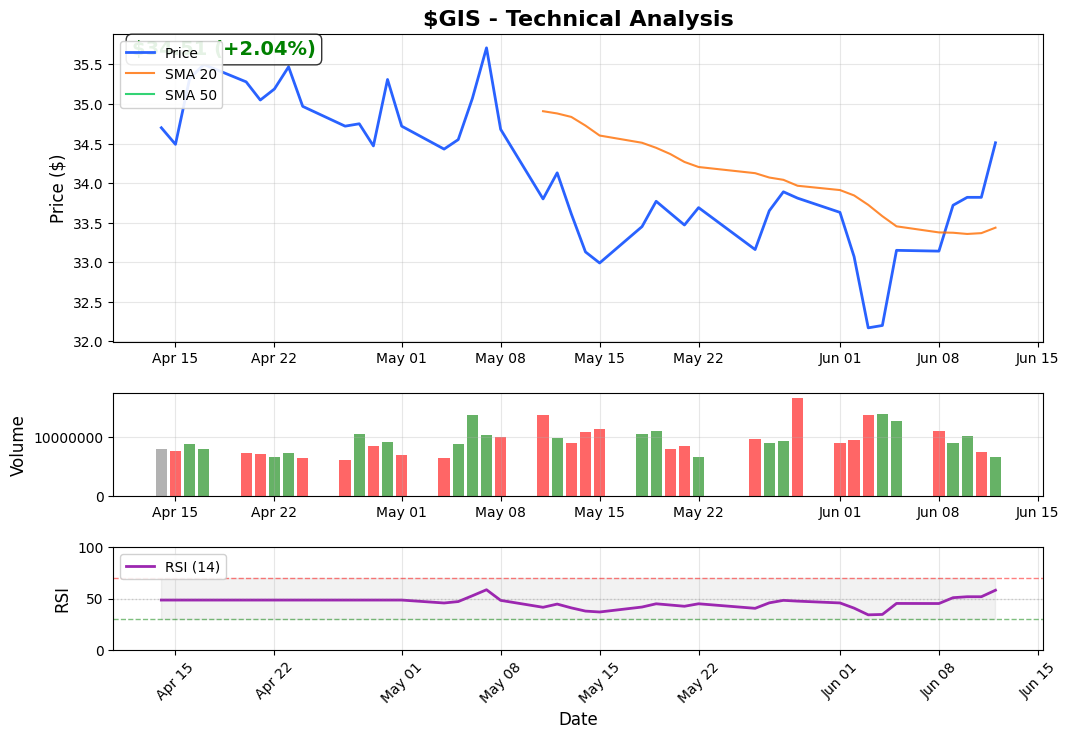
$GIS momentum accelerating at $34.51. 0.7x volume above $33.44, RSI 58.1. Bullish upside, strong trend.
Chart attached.
Not financial advice.
#FinTwit #TradingView #ChartAnalysis #Stocks #StockMarket
27

After-Hours Trading Recap Friday: stock charts for Monday’s Watchlist
Friday's Top 6 Breakouts in Stocks over high of day (HOD) during after-hours trading on June 12, 2026, ranked by range:
- $QH – $7.32 ( 0%) FLT: 88.0 M
- $ENVB – $1.70 ( 11%) FLT: 545.9 K
- $PECE – $10.11 ( 2%) FLT: 6.0 M
- $ITRG – $2.72 ( 8%) FLT: 153.3 M
- $VYX – $8.35 ( 6%) FLT: 117.0 M
- $PSKY – $10.76 ( 3%) FLT: 240.0 M
When volatility spills into after-hours, it's stocks like these that give clues for Monday's session.
🔔 Subscribe for daily breakouts and watchlist insights
💬 Comment on your favorite chart. What are you watching Monday?
#chartanalysis #technicalanalysis #stockmarket #daytrading
1
104

SIGNALS GIVE TRADES. SKILLS GIVE FREEDOM. THE CHOICE THAT DECIDES YOUR TRADING FUTURE
The Dangerous Comfort of Trading Signals
Every trader starts their journey searching for shortcuts. Most beginners believe that if they can find the right Telegram channel, WhatsApp group, YouTube expert, or paid signal service, profits will automatically follow. Signals feel attractive because they remove the responsibility of decision-making. Someone tells you what to buy, where to buy, where to place a stop loss, and where to exit. It seems simple and convenient.
However, there is a hidden problem. Signals may occasionally help you make money, but they rarely help you understand why a trade works or fails. The moment market conditions change, your confidence disappears because your success depends entirely on someone else's knowledge. If the signal provider stops posting, changes strategy, or suffers a losing streak, your trading business collapses with them. This creates dependency rather than growth.
Many traders spend years chasing better signals while never developing the ability to read charts, manage risk, or understand market behavior. They become followers instead of decision-makers. The reality is that signals can generate trades, but they cannot create confidence. Confidence comes only when you understand what you are doing and why you are doing it.
Twitter/X: x.com/@marketpulse247
Why Skills Create Long-Term Freedom
Trading skills are different from trading signals. Skills stay with you regardless of market conditions. When you learn price action, trend analysis, risk management, position sizing, and trading psychology, you gain something no one can take away from you.
A skilled trader does not panic when a trade loses money because they understand losses are part of the business. They know how to control risk and protect capital. Instead of asking others what stock to buy, they can independently scan opportunities, analyze charts, and build trading plans.
Skills also allow traders to adapt. Markets constantly evolve. A strategy that works today may struggle tomorrow. Skilled traders can recognize these changes and make adjustments. Signal followers often continue blindly until significant losses occur.
The greatest benefit of skills is freedom. Freedom means you are not waiting for alerts. Freedom means you do not need anyone's permission to enter a trade. Freedom means you can analyze opportunities confidently and execute your plan with discipline. In trading, true independence begins when your decisions are based on knowledge rather than external opinions.
Twitter/X: x.com/@marketpulse247
Consistency Comes From Process, Not Predictions
Many traders believe successful traders predict the market correctly most of the time. The truth is exactly the opposite. Consistent traders focus on process rather than prediction. They understand that nobody knows with certainty what the market will do next.
Instead of trying to predict every move, skilled traders create systems. They follow entry rules, stop-loss rules, position-sizing rules, and profit-taking rules. Their goal is not to be right on every trade. Their goal is to manage risk effectively and allow probabilities to work over time.
This is why two traders can take the same signal and achieve completely different results. One trader follows a structured process, while the other acts emotionally. The difference is not the signal; the difference is the skill level behind execution.
Professional traders understand that consistency is built through repetition and discipline. Every chart studied, every journal entry recorded, every mistake reviewed, and every lesson learned adds another layer of skill. Over time, these small improvements compound into significant results. Consistency is never purchased through subscriptions. It is earned through education, practice, and experience.
Twitter/X: x.com/@marketpulse247
The Choice That Determines Your Future
Every trader eventually reaches a crossroads. One path leads toward dependency. The other leads toward self-reliance. The dependency path is filled with endless searching for tips, signals, predictions, and market gurus. It may feel easier in the short term, but it rarely produces lasting success.
The self-reliance path requires effort. It demands study, patience, and continuous improvement. It requires learning how trends develop, how risk should be managed, how emotions affect decision-making, and how profitable systems are built. The journey is longer, but the rewards are significantly greater.
Imagine two traders five years from now. The first trader is still asking others what stock to buy. The second trader can confidently analyze any chart, manage risk professionally, and make decisions independently. The difference between them is not intelligence or luck. The difference is the decision they made years earlier between chasing signals and developing skills.
The market rewards those who invest in themselves. Signals may provide temporary opportunities, but skills provide lifelong advantages. One creates dependence. The other creates freedom. One offers short-term excitement. The other builds long-term consistency. The choice is yours.
Twitter/X: x.com/@marketpulse247
CONCLUSION
Signals can help you find opportunities, but they cannot build a successful trading career. Real success comes from developing skills that allow you to understand the market, manage risk, and make independent decisions. Traders who depend entirely on signals remain vulnerable to uncertainty, while traders who invest in learning become adaptable, confident, and consistent. The ultimate goal in trading is not simply to take more trades; it is to gain the freedom to trade with knowledge, discipline, and self-belief. Signals may open the door, but skills give you the keys to the entire house. Choose wisely, because the decision you make today will determine the trader you become tomorrow.
Twitter/X: x.com/@marketpulse247
#Trading #StockMarket #TradingPsychology #PriceAction #TradingEducation #LearnTrading #TraderMindset #TradingSuccess #RiskManagement #TradingDiscipline #StockTrading #IntradayTrading #SwingTrading #DayTrading #TechnicalAnalysis #ChartAnalysis #MarketAnalysis #StockMarketIndia #IndianStockMarket #Nifty50 #BankNifty #FinancialFreedom #WealthCreation #MoneyManagement #CapitalPreservation #ProfitableTrading #TradingTips #TradeSmart #SmartMoney #TradingCommunity #TraderLife #MarketPulse247 #Investing #InvestmentTips #FinancialEducation #StockMarketLearning #TrendFollowing #TradingJourney #SuccessMindset #Consistency #SelfImprovement #FinancialLiteracy #DisciplineEqualsFreedom #TradingSkills #MarketWisdom #LongTermSuccess #TraderGoals #MindsetMatters
सिग्नल आपको ट्रेड देते हैं, लेकिन स्किल आपको आज़ादी देती है
सिग्नल्स का आकर्षण और छिपा हुआ खतरा
हर नया ट्रेडर शेयर बाजार में जल्दी पैसा कमाने का सपना लेकर आता है। शुरुआत में अधिकांश लोग ऐसे टेलीग्राम चैनल, व्हाट्सऐप ग्रुप या तथाकथित मार्केट एक्सपर्ट की तलाश करते हैं जो उन्हें सीधे खरीदने और बेचने के सिग्नल दे सकें। यह रास्ता आसान लगता है क्योंकि आपको सोचने, सीखने या विश्लेषण करने की आवश्यकता नहीं पड़ती। कोई दूसरा व्यक्ति आपको बताता है कि कौन सा शेयर खरीदना है, कहाँ खरीदना है और कहाँ बेचना है।
लेकिन यही सुविधा धीरे-धीरे सबसे बड़ी कमजोरी बन जाती है। सिग्नल आपको कुछ सफल ट्रेड दिला सकते हैं, लेकिन वे आपको यह नहीं सिखाते कि ट्रेड सफल क्यों हुआ या असफल क्यों हुआ। यदि सिग्नल देने वाला व्यक्ति गलत हो जाए, रणनीति बदल दे या काम करना बंद कर दे, तो आपकी पूरी ट्रेडिंग रुक जाती है। इसका कारण यह है कि आपने ट्रेडिंग सीखी ही नहीं, केवल दूसरों पर निर्भर रहना सीखा।
कई लोग वर्षों तक बेहतर सिग्नल खोजते रहते हैं, लेकिन चार्ट पढ़ना, रिस्क मैनेजमेंट और मार्केट को समझना नहीं सीखते। परिणाम यह होता है कि वे हमेशा किसी और के फैसलों पर निर्भर रहते हैं। सिग्नल आपको ट्रेड दे सकते हैं, लेकिन आत्मविश्वास नहीं दे सकते।
स्किल क्यों देती है असली आज़ादी
ट्रेडिंग स्किल एक ऐसी संपत्ति है जिसे कोई आपसे छीन नहीं सकता। जब आप प्राइस एक्शन, ट्रेंड एनालिसिस, रिस्क मैनेजमेंट, पोजीशन साइजिंग और ट्रेडिंग साइकोलॉजी सीखते हैं, तो आप बाजार को समझने लगते हैं।
एक कुशल ट्रेडर हर नुकसान से डरता नहीं है क्योंकि उसे पता होता है कि नुकसान भी इस व्यवसाय का हिस्सा है। वह जानता है कि पूंजी को कैसे सुरक्षित रखना है और जोखिम को कैसे नियंत्रित करना है। उसे किसी टेलीग्राम मैसेज का इंतजार नहीं करना पड़ता। वह खुद अवसर खोज सकता है और अपने नियमों के अनुसार ट्रेड ले सकता है।
सबसे बड़ी बात यह है कि स्किल आपको स्वतंत्र बनाती है। जब बाजार बदलता है, तो कुशल ट्रेडर अपनी रणनीति को बदल सकता है। लेकिन जो केवल सिग्नल पर निर्भर है, वह भ्रमित हो जाता है। इसलिए स्किल केवल कमाई का साधन नहीं है, बल्कि यह आपको मानसिक और आर्थिक स्वतंत्रता भी देती है।
लगातार सफलता भविष्यवाणी से नहीं, प्रक्रिया से आती है
अधिकांश लोग सोचते हैं कि सफल ट्रेडर हमेशा बाजार की सही भविष्यवाणी करते हैं। वास्तविकता इससे बिल्कुल अलग है। सफल ट्रेडर भविष्यवाणी नहीं करते, बल्कि एक व्यवस्थित प्रक्रिया का पालन करते हैं।
उनके पास स्पष्ट एंट्री नियम, स्टॉप लॉस नियम, पोजीशन साइजिंग नियम और एग्जिट नियम होते हैं। उनका उद्देश्य हर ट्रेड में सही होना नहीं होता, बल्कि लंबे समय में लाभदायक बने रहना होता है।
इसी कारण दो लोग एक ही सिग्नल लेने के बाद भी अलग-अलग परिणाम प्राप्त करते हैं। एक व्यक्ति अनुशासन के साथ नियमों का पालन करता है जबकि दूसरा भावनाओं में निर्णय लेता है। अंतर सिग्नल में नहीं, बल्कि स्किल में होता है।
हर दिन चार्ट का अध्ययन करना, ट्रेडिंग जर्नल बनाना, गलतियों का विश्लेषण करना और नई चीजें सीखना धीरे-धीरे आपको बेहतर ट्रेडर बनाता है। यही छोटी-छोटी आदतें समय के साथ बड़ी सफलता में बदल जाती हैं। बाजार में स्थिरता खरीदकर नहीं मिलती, बल्कि सीखकर और अभ्यास करके मिलती है।
आज का चुनाव आपके भविष्य का निर्णय करेगा
हर ट्रेडर के सामने एक दिन दो रास्ते आते हैं। पहला रास्ता है हमेशा दूसरों पर निर्भर रहने का। दूसरा रास्ता है खुद को इतना सक्षम बनाने का कि आप अपने निर्णय स्वयं ले सकें।
पहले रास्ते पर चलने वाले लोग हमेशा नए सिग्नल, नए गुरु और नई भविष्यवाणियों की तलाश में रहते हैं। वे कभी पूरी तरह आत्मनिर्भर नहीं बन पाते। दूसरे रास्ते पर चलने वाले लोग समय लगाकर सीखते हैं, अभ्यास करते हैं और धीरे-धीरे अपनी खुद की ट्रेडिंग प्रणाली विकसित करते हैं।
कल्पना कीजिए कि पाँच साल बाद दो ट्रेडर कहाँ होंगे। पहला ट्रेडर अभी भी किसी से पूछ रहा होगा कि कौन सा शेयर खरीदना है। दूसरा ट्रेडर किसी भी चार्ट को देखकर स्वयं निर्णय ले सकता होगा। दोनों के बीच का अंतर किस्मत नहीं होगा, बल्कि आज लिया गया निर्णय होगा।
बाजार हमेशा उन्हीं लोगों को पुरस्कृत करता है जो खुद में निवेश करते हैं। सिग्नल आपको कुछ समय के लिए अवसर दे सकते हैं, लेकिन स्किल आपको जीवनभर का लाभ देती है।
निष्कर्ष
सिग्नल आपको ट्रेडिंग के अवसर दे सकते हैं, लेकिन वे आपको सफल ट्रेडर नहीं बना सकते। वास्तविक सफलता तब आती है जब आप बाजार को समझना, जोखिम को नियंत्रित करना और स्वतंत्र रूप से निर्णय लेना सीखते हैं। जो लोग केवल सिग्नल पर निर्भर रहते हैं, वे हमेशा असुरक्षित रहते हैं। वहीं जो लोग अपनी स्किल विकसित करते हैं, वे आत्मविश्वासी, अनुशासित और लगातार सफल बनते हैं। ट्रेडिंग का अंतिम लक्ष्य केवल पैसा कमाना नहीं होना चाहिए, बल्कि इतना सक्षम बनना होना चाहिए कि आप किसी पर निर्भर हुए बिना सही निर्णय ले सकें। सिग्नल दरवाजा खोल सकते हैं, लेकिन पूरी इमारत की चाबी केवल स्किल ही दे सकती है। इसलिए समझदारी से चुनाव कीजिए, क्योंकि आज का आपका निर्णय ही कल के आपके ट्रेडिंग भविष्य को तय करेगा।


5
163
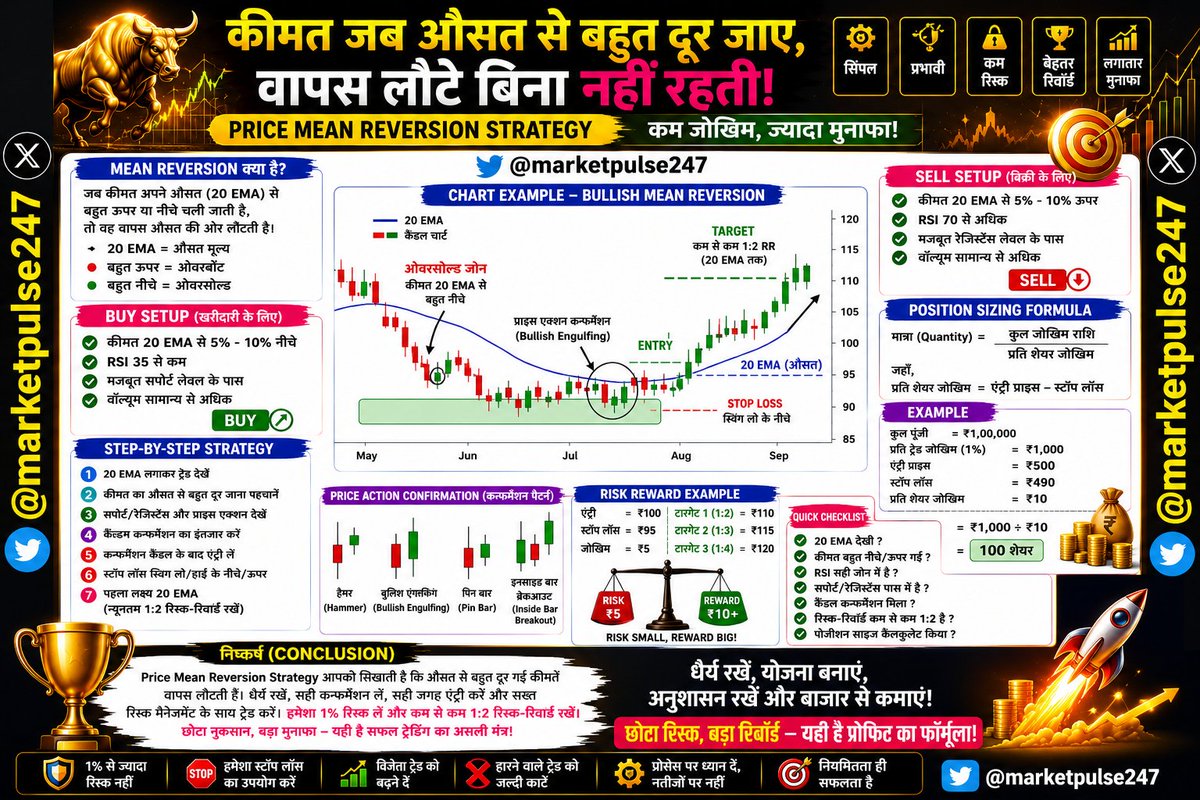
PRICE MEAN REVERSION STRATEGY: THE SIMPLE WAY TO BUY LOW, SELL HIGH AND CONTROL LOSSES
Most beginner traders lose money because they chase stocks after a big rally or panic-sell after a sharp decline. Professional traders often do the opposite. They understand a powerful concept called Mean Reversion. This strategy is based on the idea that prices tend to return to their average value after moving too far away from it.
Mean Reversion does not try to predict the future. Instead, it identifies situations where a stock has become temporarily overbought or oversold and is likely to move back toward its average price. When combined with proper risk management, it can become a highly effective daily trading strategy.
What is Mean Reversion?
Every stock has an average price, often represented by a moving average such as the 20 EMA or 50 EMA. When price moves too far above or below this average, it often pulls back toward the mean.
Think of a rubber band. The more you stretch it, the greater the chance it snaps back. Stock prices often behave in a similar way.
The Daily Trading Strategy
Step 1: Add a 20 EMA to Your Chart
The 20 EMA acts as the mean or average price.
Price far above 20 EMA = Potentially Overbought
Price far below 20 EMA = Potentially Oversold
Step 2: Look for Extreme Price Movement
For Buy Trades:
Stock falls 5% to 10% below the 20 EMA.
RSI below 35.
Strong support zone nearby.
For Sell Trades:
Stock rises 5% to 10% above the 20 EMA.
RSI above 70.
Major resistance zone nearby.
Step 3: Wait for Price Action Confirmation
Never enter blindly.
Look for:
Hammer Candle
Bullish Engulfing Candle
Strong Rejection Candle
Inside Bar Breakout
These patterns show that the reversal may have started.
Twitter id - x.com/@marketpulse247
Step 4: Entry
Enter after the confirmation candle closes.
Avoid trying to catch the exact bottom or top.
Step 5: Stop Loss
Place stop loss:
Below the recent swing low for buy trades.
Above the recent swing high for sell trades.
Always define risk before entering.
Twitter id - x.com/@marketpulse247
Step 6: Profit Target
Target the 20 EMA first.
If momentum remains strong, trail the stop loss and target higher levels.
Maintain a minimum 1:2 Risk-Reward Ratio.
Example:
Entry = ₹100
Stop Loss = ₹95
Risk = ₹5
Target = ₹110 or higher.
Position Sizing Formula
Risk management is the key to long-term survival.
Formula
Quantity = Total Risk Amount ÷ Risk Per Share
Where:
Risk Per Share = Entry Price – Stop Loss Price
Example
Trading Capital = ₹1,00,000
Risk Per Trade = 1%
Maximum Risk = ₹1,000
Entry = ₹500
Stop Loss = ₹490
Risk Per Share = ₹10
Quantity = ₹1,000 ÷ ₹10
Quantity = 100 Shares
This ensures that even if the trade fails, the loss remains controlled.
Twitter id - x.com/@marketpulse247
Why This Strategy Works
Most traders act emotionally. They buy after a stock has already moved significantly higher and sell after a large decline. Mean Reversion takes advantage of this emotional behavior.
By waiting for extreme moves away from the average price and entering only after confirmation, traders can often obtain better entries with smaller stop losses and larger potential rewards.
Twitter id - x.com/@marketpulse247
CONCLUSION
The Price Mean Reversion Strategy is one of the simplest and most logical trading approaches available. It teaches traders to avoid chasing momentum and instead focus on opportunities where price has moved too far from its average. By combining the 20 EMA, RSI, support and resistance, and strong price action confirmation, traders can identify high-probability setups with controlled risk. The real secret is not finding perfect trades but managing risk properly. Keep losses small, maintain a minimum 1:2 risk-reward ratio, and risk only 1% of your capital per trade. Over time, this disciplined approach can help you stay profitable while avoiding the large losses that destroy most trading accounts.
Twitter id - x.com/@marketpulse247
Chartink Scanner Formula (Mean Reversion Strategy)
Bullish Mean Reversion Scanner
close < ema(close,20) * 0.95
and rsi(14) < 35
and close > open
and volume > sma(volume,20)
Aggressive Oversold Reversal Scanner
close < ema(close,20) * 0.90
and rsi(14) < 30
and volume > sma(volume,20) * 1.5
Mean Reversion Bounce Scanner
close crossed above ema(close,20)
and rsi(14) > 40
and volume > sma(volume,20)
Twitter id - x.com/@marketpulse247
Twitter/X
#MeanReversion #MeanReversionTrading #PriceAction #TradingStrategy #StockMarket #Trading #StockTrading #IntradayTrading #SwingTrading #DayTrading #TechnicalAnalysis #ChartAnalysis #EMA20 #MovingAverage #RSI #RSITrading #SupportAndResistance #CandlestickPatterns #ReversalTrading #MomentumTrading #RiskManagement #RiskReward #PositionSizing #MoneyManagement #TradingPsychology #TradingDiscipline #TradingEducation #LearnTrading #BeginnerTrader #StockMarketLearning #MarketAnalysis #StockMarketIndia #IndianStockMarket #Nifty50 #BankNifty #TradeSmart #ProfitableTrading #TradingTips #SmartMoney #MarketPulse247 #FinancialFreedom #WealthCreation #CapitalPreservation #BullMarket #TraderLife #StockMarketTips #InvestmentTips #TradingSuccess
प्राइस मीन रिवर्ज़न रणनीति: कम नुकसान और बेहतर मुनाफे के लिए एक सरल ट्रेडिंग तरीका
अधिकांश नए ट्रेडर तब शेयर खरीदते हैं जब वह तेजी से ऊपर भाग चुका होता है और तब बेचते हैं जब उसमें बड़ी गिरावट आ चुकी होती है। यही कारण है कि वे अक्सर नुकसान उठाते हैं। सफल ट्रेडर एक अलग सिद्धांत का उपयोग करते हैं जिसे मीन रिवर्ज़न (Mean Reversion) कहा जाता है। इस सिद्धांत के अनुसार किसी भी शेयर की कीमत यदि अपने औसत मूल्य से बहुत अधिक ऊपर या नीचे चली जाए, तो समय के साथ वह दोबारा अपने औसत मूल्य के आसपास लौटने की कोशिश करती है।
मीन रिवर्ज़न रणनीति का उद्देश्य भविष्य की भविष्यवाणी करना नहीं है, बल्कि उन अवसरों को पहचानना है जहाँ कीमत अपने वास्तविक औसत से बहुत दूर चली गई हो और वापसी की संभावना अधिक हो।
मीन रिवर्ज़न क्या है?
हर शेयर का एक औसत मूल्य होता है जिसे हम आमतौर पर 20 EMA (Exponential Moving Average) या 50 EMA से मापते हैं।
यदि कीमत 20 EMA से बहुत ऊपर है, तो शेयर ओवरबॉट (Overbought) हो सकता है।
यदि कीमत 20 EMA से बहुत नीचे है, तो शेयर ओवरसोल्ड (Oversold) हो सकता है।
इसे एक रबर बैंड की तरह समझिए। जितना अधिक उसे खींचेंगे, उतनी ही संभावना होगी कि वह वापस अपनी सामान्य स्थिति में लौटेगा। शेयर बाजार में भी कीमतें अक्सर इसी प्रकार व्यवहार करती हैं।
दैनिक ट्रेडिंग के लिए मीन रिवर्ज़न रणनीति
चरण 1: चार्ट पर 20 EMA लगाएँ
20 EMA को औसत मूल्य माना जाएगा।
चरण 2: अत्यधिक मूल्य विचलन खोजें
खरीदारी (Buy) के लिए:
कीमत 20 EMA से 5% से 10% नीचे हो।
RSI 35 से कम हो।
पास में मजबूत सपोर्ट लेवल हो।
बिक्री (Sell) के लिए:
कीमत 20 EMA से 5% से 10% ऊपर हो।
RSI 70 से अधिक हो।
पास में मजबूत रेजिस्टेंस लेवल हो।
चरण 3: प्राइस एक्शन की पुष्टि करें
बिना पुष्टि के कभी ट्रेड न लें।
निम्नलिखित कैंडल पैटर्न देखें:
हैमर (Hammer)
बुलिश एंगल्फिंग (Bullish Engulfing)
मजबूत रिजेक्शन कैंडल
इनसाइड बार ब्रेकआउट
ये संकेत देते हैं कि रिवर्सल शुरू हो सकता है।
Twitter id - x.com/@marketpulse247
चरण 4: एंट्री लें
कन्फर्मेशन कैंडल के बंद होने के बाद ही ट्रेड में प्रवेश करें।
चरण 5: स्टॉप लॉस लगाएँ
खरीदारी में हाल के स्विंग लो के नीचे।
बिक्री में हाल के स्विंग हाई के ऊपर।
Twitter id - x.com/@marketpulse247
चरण 6: लक्ष्य निर्धारित करें
पहला लक्ष्य 20 EMA रखें।
हमेशा कम से कम 1:2 रिस्क-रिवॉर्ड अनुपात बनाए रखें।
Twitter id - x.com/@marketpulse247
उदाहरण:
एंट्री = ₹100
स्टॉप लॉस = ₹95
जोखिम = ₹5
लक्ष्य = ₹110 या उससे अधिक
पोजीशन साइजिंग फॉर्मूला
सफल ट्रेडिंग का सबसे महत्वपूर्ण हिस्सा जोखिम नियंत्रण है।
फॉर्मूला
मात्रा (Quantity) = कुल जोखिम राशि ÷ प्रति शेयर जोखिम
जहाँ,
प्रति शेयर जोखिम = एंट्री प्राइस – स्टॉप लॉस
उदाहरण
कुल पूंजी = ₹1,00,000
प्रति ट्रेड जोखिम = 1%
अधिकतम जोखिम = ₹1,000
एंट्री = ₹500
स्टॉप लॉस = ₹490
प्रति शेयर जोखिम = ₹10
मात्रा = ₹1,000 ÷ ₹10
मात्रा = 100 शेयर
इस प्रकार यदि ट्रेड गलत भी हो जाए तो अधिकतम नुकसान केवल ₹1,000 रहेगा।
यह रणनीति क्यों काम करती है?
अधिकांश ट्रेडर भावनाओं के आधार पर निर्णय लेते हैं। वे तेजी में खरीदते हैं और गिरावट में बेचते हैं। मीन रिवर्ज़न रणनीति इस मनोवैज्ञानिक गलती का लाभ उठाती है।
जब कीमत अपने औसत से बहुत दूर चली जाती है और फिर वापसी के संकेत देती है, तब कम जोखिम में बेहतर एंट्री मिलने की संभावना बढ़ जाती है। यही कारण है कि यह रणनीति लंबे समय तक प्रभावी साबित होती है।
Twitter id - x.com/@marketpulse247
निष्कर्ष
प्राइस मीन रिवर्ज़न रणनीति उन ट्रेडरों के लिए एक शानदार तरीका है जो कम जोखिम के साथ नियमित मुनाफा कमाना चाहते हैं। यह रणनीति आपको बाजार का पीछा करने के बजाय धैर्यपूर्वक सही अवसर का इंतजार करना सिखाती है। 20 EMA, RSI, सपोर्ट-रेजिस्टेंस और मजबूत प्राइस एक्शन को मिलाकर आप उच्च गुणवत्ता वाले ट्रेड खोज सकते हैं। याद रखें कि सफल ट्रेडिंग का रहस्य सही एंट्री से ज्यादा सही जोखिम प्रबंधन में छिपा होता है। हमेशा अपनी कुल पूंजी का केवल 1% जोखिम लें, न्यूनतम 1:2 रिस्क-रिवॉर्ड अनुपात रखें और बड़े नुकसान से बचें। यदि आप लगातार अनुशासन के साथ इस रणनीति का पालन करते हैं, तो लंबे समय में आपकी ट्रेडिंग स्थिर और लाभदायक बन सकती है।
2
10
321
Dow Theory Price Action Strategy with Money Management: A Simple Daily Trading System for Consistent Profits
Many traders lose money because they focus only on finding entries and ignore risk management. The truth is that profitable trading is not about predicting every market move. It is about following a structured strategy, controlling risk, and protecting capital. One of the most reliable methods for beginners is combining Dow Theory, Price Action, and Proper Money Management.
Dow Theory is the foundation of modern technical analysis. It helps traders identify the direction of the trend and avoid trading against the market. When combined with price action and strict money management, it becomes a powerful daily trading strategy.
Understanding Dow Theory
Dow Theory says that markets move in trends.
Uptrend
Higher Highs (HH)
Higher Lows (HL)
Downtrend
Lower Highs (LH)
Lower Lows (LL)
The first rule is simple:
Trade with the trend, never against it.
If a stock is making higher highs and higher lows, look only for buying opportunities. If it is making lower highs and lower lows, look only for selling opportunities.
The Daily Trading Strategy
Step 1: Identify the Trend
Open a 15-minute or 1-hour chart.
Look for:
Higher High Higher Low = Bullish Trend
Lower High Lower Low = Bearish Trend
Avoid sideways markets.
Step 2: Wait for Pullback
Never chase a stock after a strong move.
Wait for price to pull back toward:
Previous support zone
Previous resistance breakout level
Recent higher low
Patience improves entry quality.
Step 3: Look for Price Action Confirmation
Enter only after a confirmation candle appears.
Examples:
Bullish Engulfing Candle
Hammer Candle
Strong Breakout Candle
Inside Bar Breakout
These signals indicate buyers are returning.
Twitter id - x.com/@marketpulse247
Step 4: Entry
Enter after the confirmation candle closes.
This reduces false breakouts and emotional trading.
Step 5: Stop Loss Placement
Place stop loss:
Below recent swing low for buy trades
Above recent swing high for sell trades
Always define risk before entering.
Step 6: Target Setting
Use a minimum Risk-Reward Ratio of 1:2.
Example:
Entry = ₹500
Stop Loss = ₹490
Risk = ₹10
Target:
Minimum ₹520
For strong trends, aim for 1:3 or 1:4 risk reward.
Money Management and Position Sizing Formula
This is the secret that keeps professional traders alive.
Never risk more than 1% of your capital on a single trade.
Formula
Quantity = Total Risk Amount ÷ Risk Per Share
Where:
Risk Per Share = Entry Price − Stop Loss
Example
Trading Capital = ₹1,00,000
Risk Per Trade = 1%
Maximum Risk = ₹1,000
Entry Price = ₹500
Stop Loss = ₹490
Risk Per Share = ₹10
Quantity = ₹1,000 ÷ ₹10
Quantity = 100 Shares
This means your maximum loss remains ₹1,000 even if the trade fails.
Why This Strategy Works
Most traders buy because they feel a stock will go higher. Professionals buy because the trend, price action, and risk management align together.
Dow Theory keeps you trading with the trend.
Price Action helps identify the right entry.
Money Management protects your capital.
Risk-Reward ensures one winning trade can cover multiple small losses.
This combination creates consistency and removes emotional decision-making.
Twitter id - x.com/@marketpulse247
Conclusion
The Dow Theory Price Action Strategy is one of the simplest and most effective trading methods for beginners. Instead of predicting the market, you follow what the market is already showing. By identifying higher highs and higher lows, waiting for pullbacks, and entering only after confirmation, you improve the probability of success. Combine this with strict position sizing and a minimum 1:2 risk-reward ratio, and you create a trading system designed to survive losing streaks and grow steadily over time. Remember, successful trading is not about making money every day. It is about protecting capital, controlling risk, and allowing profitable trades to become larger than losing trades.
Twitter id - x.com/@marketpulse247
#DowTheory #PriceAction #PriceActionTrading #TradingStrategy #StockMarket #Trading #StockTrading #IntradayTrading #SwingTrading #DayTrading #TechnicalAnalysis #ChartAnalysis #TrendFollowing #HigherHighHigherLow #MarketStructure #SupportAndResistance #CandlestickPatterns #BreakoutTrading #RiskManagement #RiskReward #PositionSizing #MoneyManagement #TradingPsychology #TradingDiscipline #LearnTrading #TradingEducation #BeginnerTrader #StockMarketLearning #MarketAnalysis #StockMarketIndia #IndianStockMarket #Nifty50 #BankNifty #ProfitableTrading #TradingTips #TradeSmart #SmartMoney #MarketPulse247 #FinancialFreedom #WealthCreation #CapitalPreservation #BullMarket #TraderLife #StockMarketTips #InvestmentTips #Investing #TradingSuccess #FinancialEducation

4
9
286
Bollinger Bands Trading Strategy: A Simple Daily Trading Method with Proper Risk Management and Position Sizing
Many traders enter the stock market looking for the perfect indicator that can predict every move. However, successful trading is not about prediction; it is about identifying high-probability opportunities while keeping risk under control. One of the most beginner-friendly indicators for daily trading is Bollinger Bands. When used correctly, it can help traders find quality entries, set stop losses, and achieve favorable risk-reward ratios.
What are Bollinger Bands?
Bollinger Bands consist of three lines:
Upper Band
Middle Band (20-period Moving Average)
Lower Band
The bands expand when volatility increases and contract when volatility decreases. This helps traders identify potential buying and selling opportunities.
Simple Bollinger Bands Daily Trading Strategy
Step 1: Identify the Trend
First, determine the market direction.
Price above the Middle Band = Bullish Trend
Price below the Middle Band = Bearish Trend
Always trade in the direction of the trend.
Step 2: Wait for Pullback
In a bullish trend, wait for the stock to pull back toward the Middle Band.
Avoid buying when the price is touching the Upper Band because the stock may be temporarily overextended.
Step 3: Look for Price Action Confirmation
When price reaches the Middle Band:
Bullish Engulfing Candle
Hammer Candle
Strong Rejection Candle
These signals indicate buyers are stepping back into the market.
Step 4: Entry
Enter the trade after the confirmation candle closes above the Middle Band.
This improves the probability of a successful trade.
Step 5: Stop Loss Placement
Place your stop loss:
Below the recent swing low
Or below the Lower Bollinger Band
This keeps risk clearly defined before entering the trade.
Step 6: Profit Target
Aim for the Upper Bollinger Band as the first target.
Maintain at least a 1:2 Risk-Reward Ratio.
Example:
Entry = ₹500
Stop Loss = ₹490
Risk = ₹10
Target should be at least:
₹520 or higher
A 1:3 risk-reward setup is even better.
Position Sizing Formula
Professional traders never decide quantity randomly.
Formula
Quantity = Risk Amount Per Trade ÷ Risk Per Share
Where:
Risk Per Share = Entry Price − Stop Loss Price
Example
Trading Capital = ₹1,00,000
Maximum Risk Per Trade = 1%
Risk Amount = ₹1,000
Entry Price = ₹500
Stop Loss = ₹490
Risk Per Share = ₹10
Quantity = ₹1,000 ÷ ₹10
Quantity = 100 Shares
This ensures that even if the trade fails, the maximum loss remains limited to ₹1,000.
Why This Strategy Works
Bollinger Bands help traders identify areas where price is likely to pull back and resume the trend. Instead of chasing stocks after a sharp move, traders wait patiently for a retracement toward the Middle Band and then look for confirmation. This improves entries and reduces emotional decision-making.
The combination of trend-following, price action confirmation, position sizing, and proper risk management creates a trading framework that can be followed consistently. Remember, the goal is not to win every trade but to ensure winners are larger than losers.
Conclusion
The Bollinger Bands strategy is simple, effective, and suitable for beginners who want a structured trading approach. By trading in the direction of the trend, waiting for pullbacks, and using strict risk management, traders can significantly improve their consistency. Risk only 1% of capital per trade, maintain a minimum 1:2 risk-reward ratio, and allow profits to grow while keeping losses small. Over time, discipline and risk management will contribute far more to trading success than any indicator alone.
48 Hashtags for Twitter/X
#BollingerBands #BollingerBandStrategy #TradingStrategy #StockMarket #Trading #StockTrading #IntradayTrading #SwingTrading #DayTrading #TechnicalAnalysis #ChartAnalysis #PriceAction #RiskManagement #RiskReward #PositionSizing #TradingPsychology #TradingDiscipline #TradingEducation #LearnTrading #BeginnerTrader #StockMarketLearning #MarketAnalysis #StockMarketIndia #IndianStockMarket #Nifty50 #BankNifty #MomentumTrading #TrendFollowing #SupportAndResistance #CandlestickPatterns #ProfitableTrading #TradingTips #SmartMoney #MarketPulse247 #FinancialFreedom #WealthCreation #MoneyManagement #CapitalPreservation #BullMarket #TraderLife #TradeSmart #StockMarketTips #InvestmentTips #Investing #TradingSuccess #FinancialEducation #MarketInsights #WealthBuilding

3
8
226
Debargha Guha retweeted

Jun 13
#ChartAnalysis #RishabhPant
It's a example of how good chart have no meaning infront of bad time period
Mercury 9L exalted aspected by Jupiter still not in form due to Saturn phase in dasha
Moon in 10H : he loves the profession of cricket and popularity he got from it

4
2
30
5,877

Jun 13
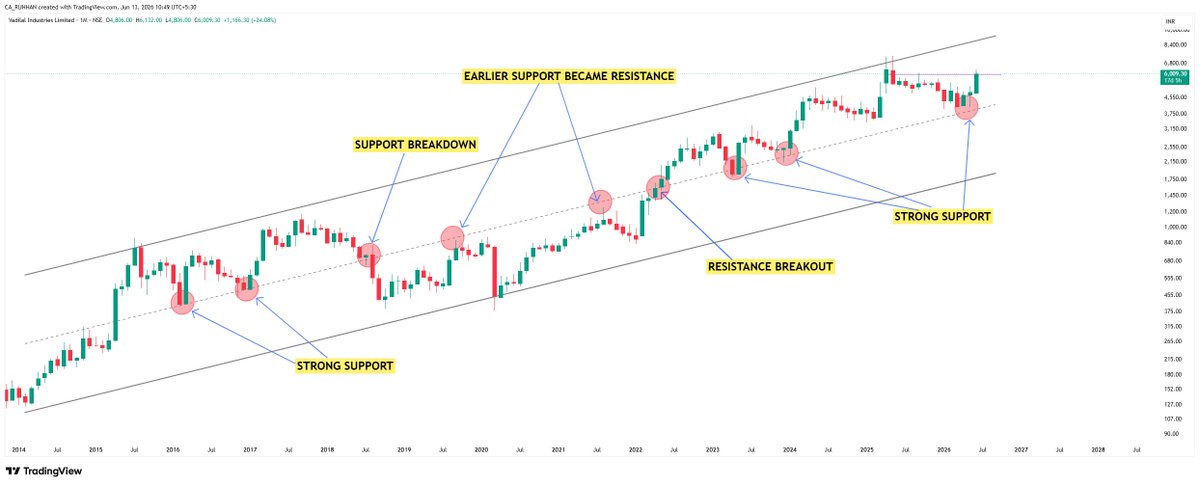
#VADILALIND 📊
The monthly chart is a great reminder that support and resistance are not just lines on a chart—they are where market psychology plays out. Over time, these levels have repeatedly guided price movements.
The lesson? Trading is often simple. The difficult part is having the patience and discipline to wait for price to reach key zones and then act based on price action, not emotions.
A closer look at the daily chart shows a Rounding Bottom formation with price now approaching a crucial resistance level. This is where the next clue will emerge.
If buyers step in with conviction, a breakout could follow. If not, a pullback remains possible, potentially forming the second shoulder of a larger Head & Shoulders pattern.
The chart is at a decision point. Watch the price action, not the predictions. 👀
#StockMarket #TechnicalAnalysis #PriceAction #SupportAndResistance #RoundingBottom #HeadAndShoulders #ChartAnalysis #SwingTrading #Investing #StocksToWatch #Trader #IndianStocks

2
48
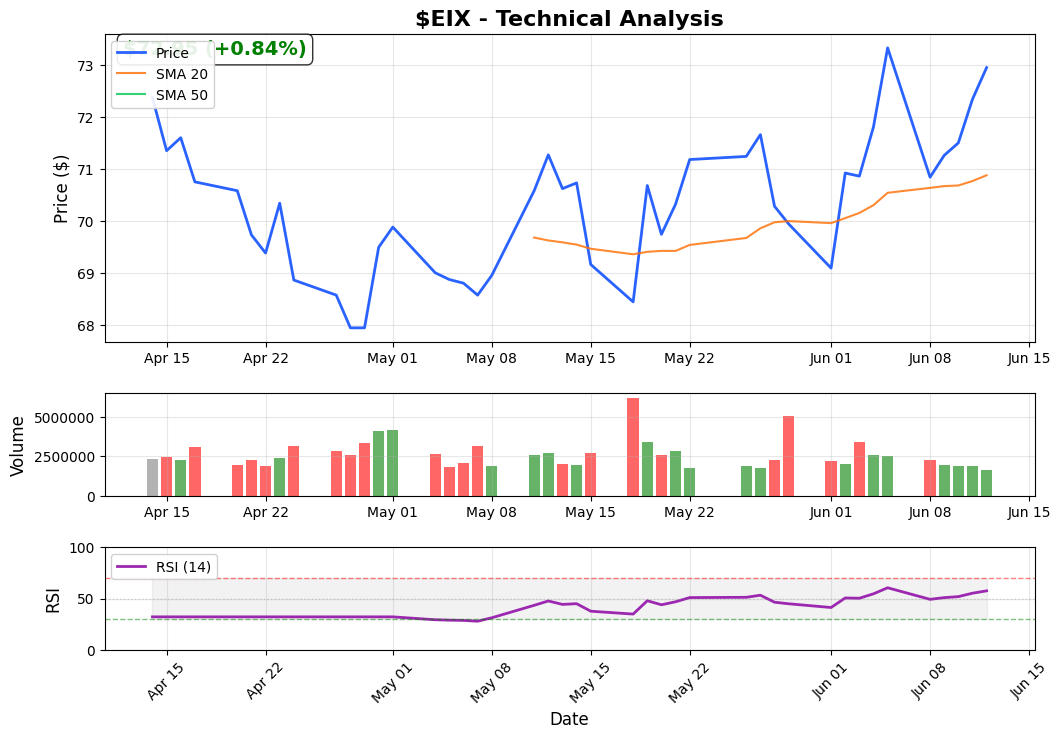
Jun 13
$EIX oversold bounce at $72.95. RSI 57.5 extreme low, 0.6x volume marks the bottom. Recovery to $70.88 underway.
Chart attached.
Not financial advice.
#TradingView #ChartAnalysis #SwingTrading #StockAlerts
25

Jun 12
The report Wall Street will not publish
They handed you the largest IPO in history.
They just forgot to tell you who gets the money.
On June 12, 2026, SpaceX raised $75 billion from the public in the most celebrated IPO of the century. The bankers called it historic. The media called it transformational. Elon Musk called it a step toward Mars.
What nobody told you, buried 147 pages deep in the SEC S-1 filing, is that $62.8 billion of that $75 billion was already spoken for before a single share was sold. The money you sent in went straight out to a board member's own firm, to retire Musk's personal AI debts, and to buy wireless spectrum that won't close until 2027. You were handed a $1.75 trillion valuation, 4.3% of the float, and a runway that runs to zero by December.
This report went where the analysts wouldn't. We read every page of the S-1. We traced the $20 billion GPU lease structure that SpaceX tried to keep off its balance sheet, until PwC said no. We identified the board member who structured deals with his own firm, collected $1.74 billion in pre-IPO lease payments, and now holds a $140 billion equity stake, all from a $1 million personal loan to Musk in 2008. We built the month-by-month cash burn model that shows exactly when SpaceX hits zero and is forced to dilute you. And we identified the precise six-week window in October 2026 when forced index buying peaks, insider lockups remain intact, and earnings reality has not yet landed, your one clean exit before the cliff.
Then we turned the lens on the other side of the trade. While SpaceX burns $5.6 billion a month and posts GAAP losses with no profitability path, Anthropic has just crossed $47 billion in annualised revenue, a trajectory that made Salesforce's 20-year climb look like a warm-up act. It posted its first operating profit in Q2 2026. It has no pre-pledged obligations. It has no Valor problem. And it is filing for an IPO in December, priced at roughly 21x revenue versus SpaceX's 87x. One of these is a trade. The other is an investment. This report tells you which is which — and exactly what to do with both. Buy the report now👇
spacex-intelligence-report.n…
#spacex #Silver #XAG #XAGUSD #SilverTrading #SilverPrice #SilverMarket #SilverBullRun #SilverSqueeze #SilverChart #SilverAnalysis #SilverInvesting #SilverStacking #SilverCommunity #SilverNews #SilverToTheMoon #TechnicalAnalysis #ChartAnalysis #TradingView #TradeSetup #TradingSignals #TradingCommunity #TradingLife #DayTrading #SwingTrading #ForexTrading #CryptoTrading #StockMarket #MarketAnalysis #PriceAction #Fibonacci #RSI #ElliottWave #CandlestickPatterns #SupportAndResistance #PreciousMetals #CommoditiesTrading #Gold #GoldSilver #Metals #RealAssets #HardAssets #Inflation #MacroTrading #GlobalMarkets #FinancialMarkets #WallStreet #Investing #Wealth #Portfolio
65

Jun 12
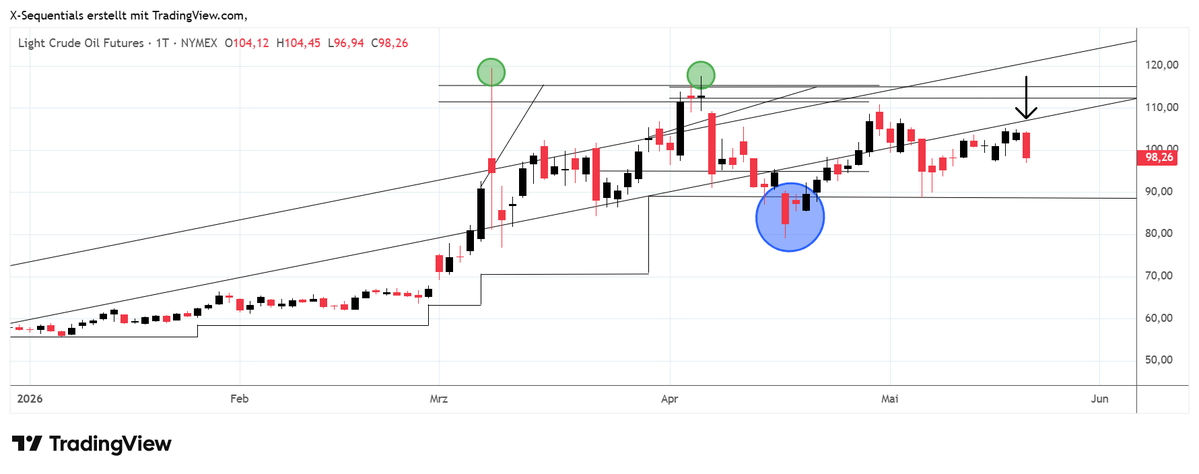
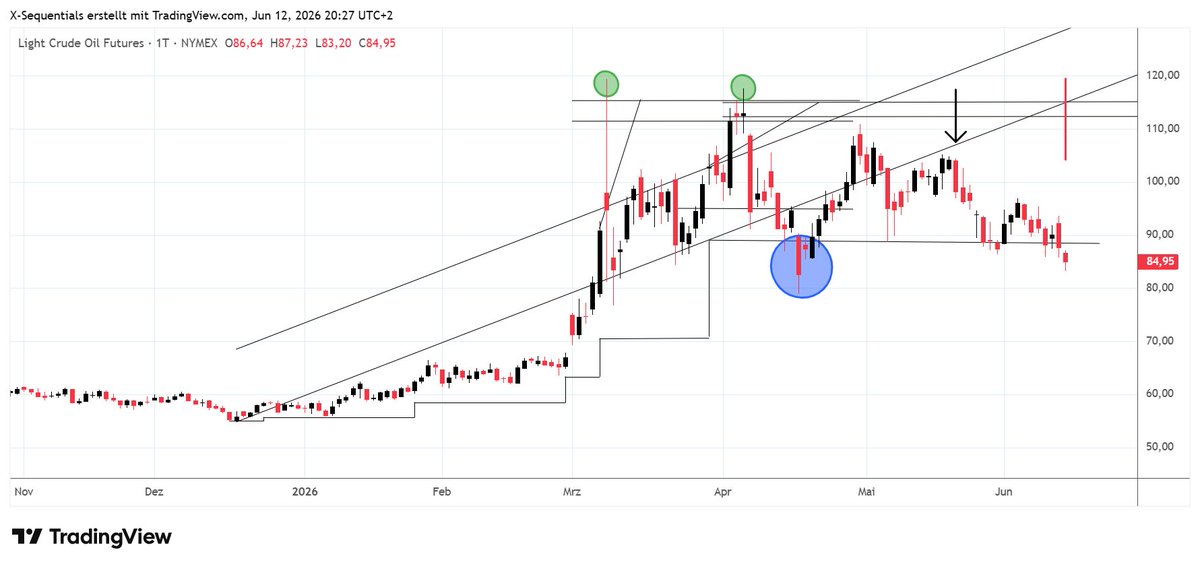
956 Punkte Gold, 8.533 Punkte Heizöl, 2.249 Punkte Erdöl – so wurden diese X-Sequentials Trades umgesetzt
Sehr geehrte Damen und Herren,
in den vergangenen Wochen wurden im X-Sequentials-Trading-Börsenbrief drei Short-Trades bei den Rohstoffen umgesetzt – mit den folgenden Ergebnissen:
Gold: 956 Punkte / 9.560 USD
Heizöl: 8.533 Punkte / 3.583,86 USD
Light Crude Oil: 2.249 Punkte / 2.249 USD
Auf meiner Webseite habe ich diese Trades vollständig dokumentiert – mit den Original-Charts, den genauen Einstiegskursen, Stoppkursen, Updates und Ausstiegskursen. Sie können dort nachvollziehen, wie die X-Sequentials-Methode in der Praxis funktioniert: von der ersten Prognose bis zum Ausstieg.
Der Beitrag ist besonders für Trader interessant, die verstehen möchten, wie man auf Basis von Zeitzielen und X-Sequentials-Kursmustern Handelssignale entwickelt und umsetzt.
Hier geht es zum Beitrag:
technical-trading-profits.co…
Mit freundlichen Grüßen
Devin Sage
Technical-Trading-Profits.co…
#xsequentials #Börse #Gold #Heizöl #Erdöl #CrudeOil #HeatingOil #Rohstoffe #Commodities #Trading #TechnicalAnalysis #ChartAnalysis #Chartanalyse #ShortTrade #Handelssignal #TradingSignal #XSequentials #DevinSage #Börsenbrief #TradingBörsenbrief #Futures #TradingProfit #TradingResults #TradingPerformance #RohstoffeTrading #GoldTrading #OilTrading #TradingMethode #Zeitziel #Kursprognose #TechnischesTrading #TradingLernen


1
2
2
70
Jun 12
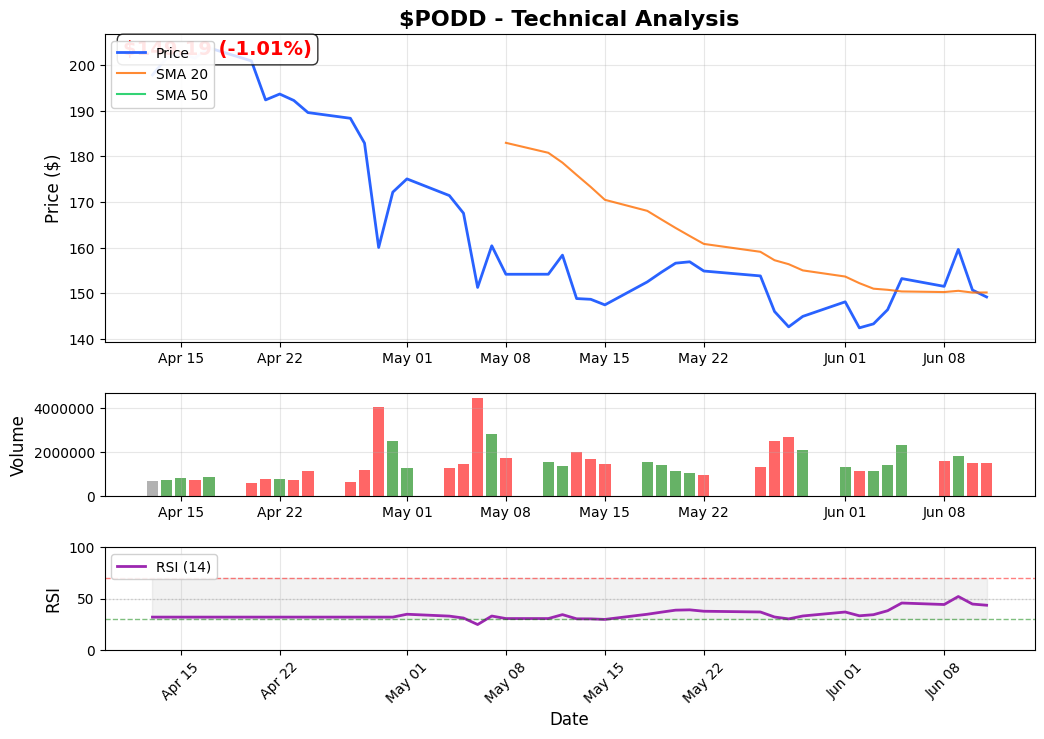
$PODD distribution zone at $149.19. 1.0x volume, sellers dominating below $150.18, RSI 43.5. Exiting position.
Chart attached.
Not financial advice.
#Investing #ChartAnalysis #SwingTrading #TradingSignals #StockNews
23

Jun 12
Tomorrow Saturday - A chart analysis day.
Your chart, My analysis !
In my strategy name of the chart doesn’t matter.
DM Me a scrip name.
Thanks
Good night 😴
#FridayEve #chartanalysis #technicalanalysis #stockmarketeducation
#sharemarket #stockmarket
5
2
1
113