
Jun 10
𝐉𝐡𝐚𝐫𝐤𝐡𝐚𝐧𝐝 𝐓𝐚𝐤𝐞𝐬 𝐚 𝐒𝐢𝐠𝐧𝐢𝐟𝐢𝐜𝐚𝐧𝐭 𝐒𝐭𝐞𝐩 𝐓𝐨𝐰𝐚𝐫𝐝𝐬 𝐓𝐫𝐚𝐧𝐬𝐟𝐨𝐫𝐦𝐢𝐧𝐠 𝐄𝐝𝐮𝐜𝐚𝐭𝐢𝐨𝐧 𝐓𝐡𝐫𝐨𝐮𝐠𝐡 𝐒𝐭𝐚𝐭𝐞-𝐋𝐞𝐝 𝐏𝐨𝐥𝐢𝐜𝐲 𝐋𝐚𝐛
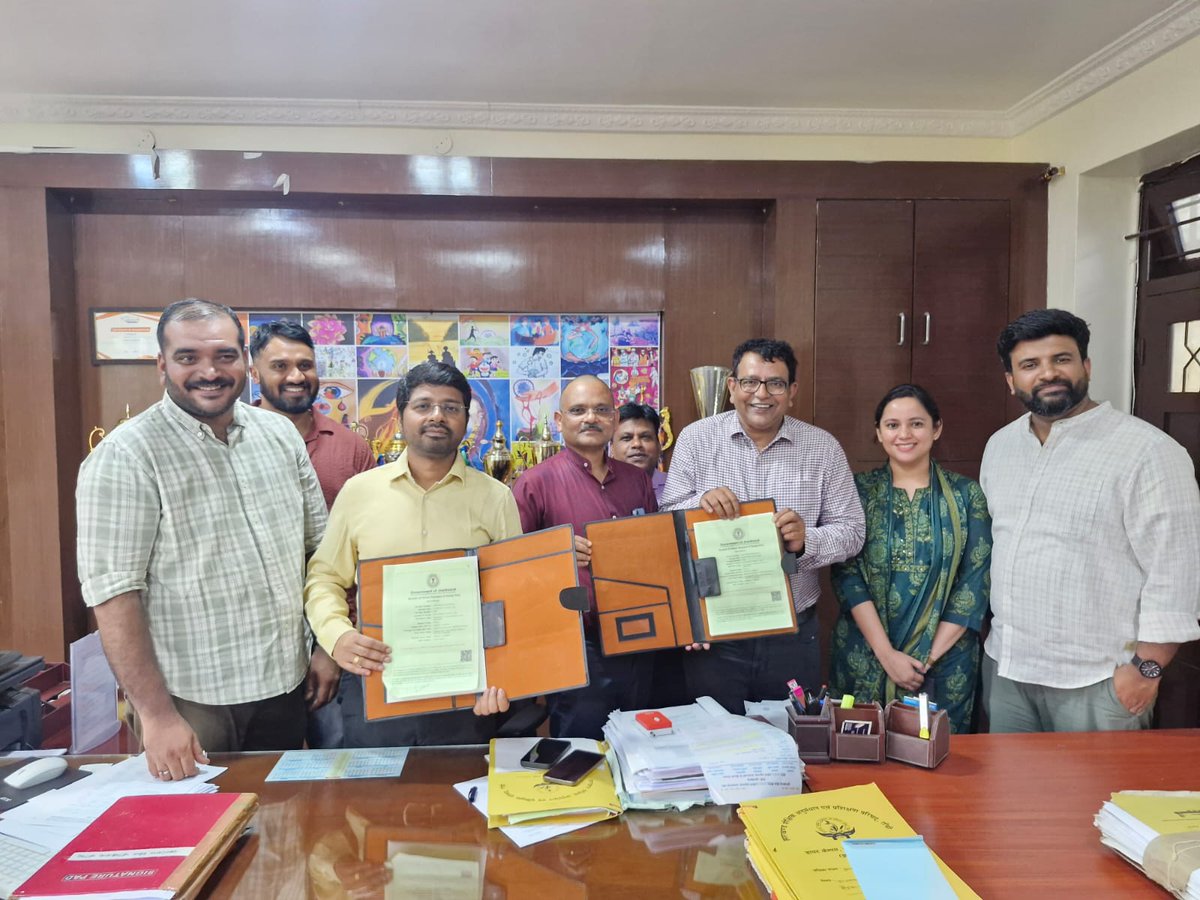
Jharkhand Education Project Council (JEPC) is pleased to share that it has signed a Memorandum of Understanding (MoU) with Dream a Dream, on 9 June 2026 in Ranchi to establish the Jharkhand Policy Lab for Education System Transformation. The initiative will be dedicated exclusively to education system transformation.
The Policy Lab aims to strengthen evidence-informed decision-making within the education system by creating a platform for research, innovation, policy dialogue and institutional learning. The initiative will support reforms in pedagogy, curriculum, assessment, teacher professional development and student wellbeing, while ensuring that children's realities and aspirations remain central to educational decision-making.
On this occasion, Shri Shashi Ranjan, State Project Director (IAS), JEPC, highlighted the importance of fostering a culture where evidence, innovation and reflection inform policy and practice. Representatives from Dream a Dream emphasized the need to strengthen the connection between evidence, policy and implementation to address emerging challenges and opportunities within the education sector.
Over the next three years, the Policy Lab will support research studies, innovation pilots, policy dialogues, technical consultations and capacity-building efforts, with a special focus on children from tribal, rural, migrant, and socio-economically marginalized communities.
@DreamADreamInd @porticusglobal
#JEPC #JharkhandEducation #PolicyLab #EducationTransformation #EducationReform #NEP2020
1
5
190

Sources: ABC News; City of Tulsa; DOJ; The Lancet; CHOP PolicyLab; Baby’s First Years Study.
4
246

🌍 Exciting News!
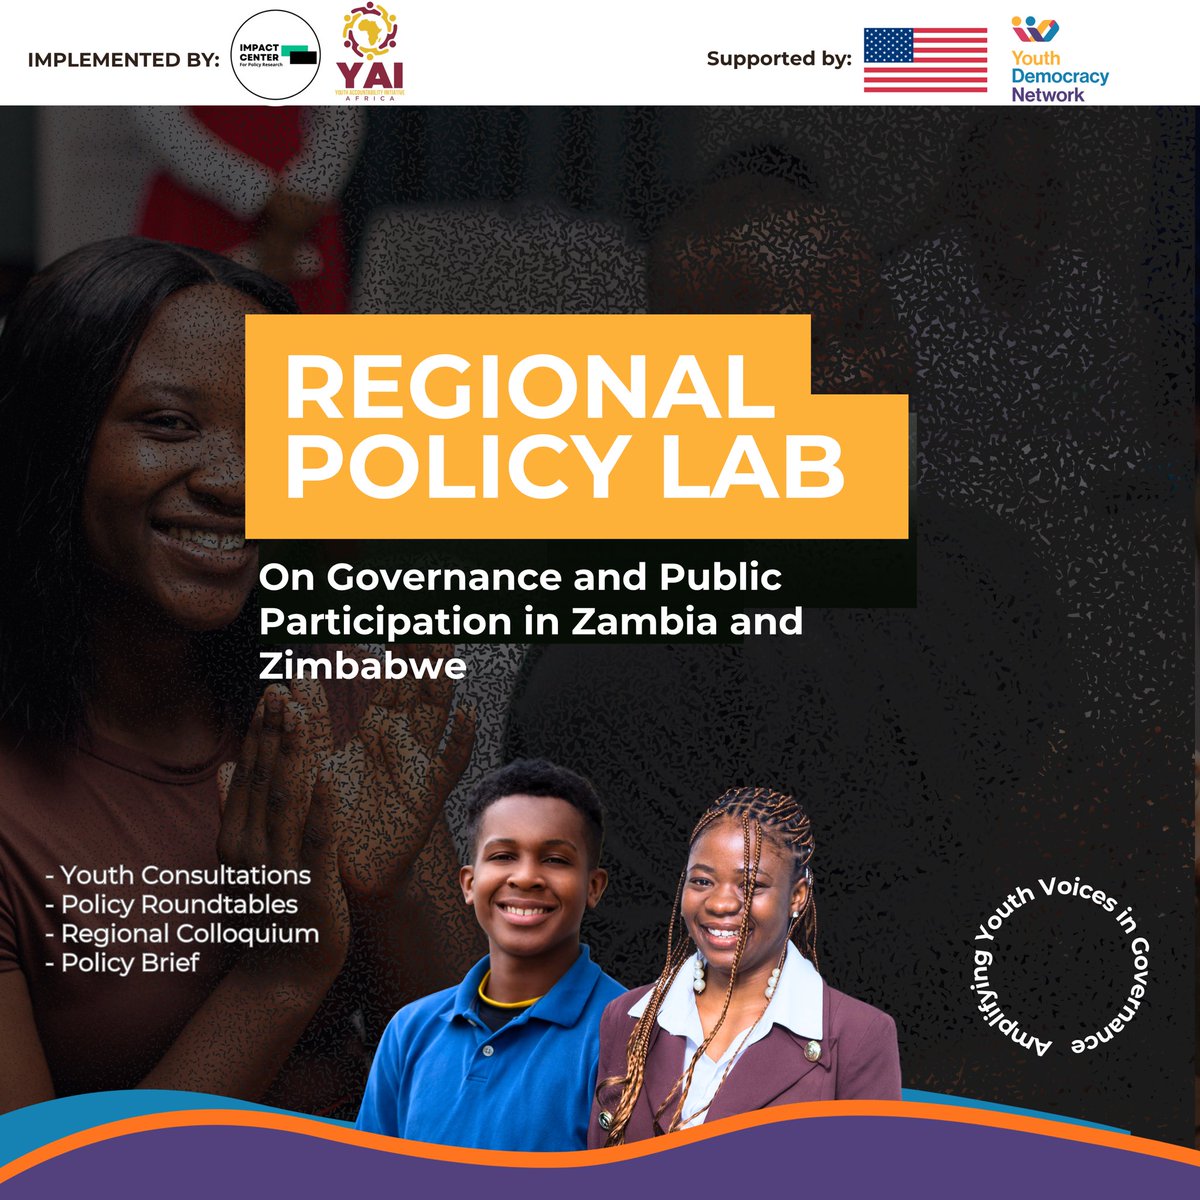
Youth Accountability Initiative is proud to launch the Regional Policy Lab on Governance and Public Participation in Zambia and Zimbabwe in partnership with Impact Centre and supported by Youth Democracy Network. @CommunityofDem
The project will amplify youth voices through consultations, policy roundtables, a regional colloquium, and policy advocacy. ✊🏽
#YouthParticipation #Governance #Democracy #Zimbabwe #Zambia #PolicyLab
2
2
16
271

May 20
#Ucraina #UE #Russia #Putin
@emmevilla Responsabile di PolicyLab @ispionline Istituto PRIVATO chiaramente schierato con Ucraina, NATO, UE e Soros, mi ha bloccato per aver dimostrato la sua disinformazione.
ISPI è oggi degradato a voce del padrone che li finanzia.

1
5
21
211

You mean Rt, no R0, since R0 represents an inherent property of the virus while Rt represents current local conditions and spread.
But you are talking about herd immunity, which we know does not apply to this virus, vaccine or no vaccine, since infection doesn’t provide sterilizing immunity and people have substantial risk of reinfection within a year
Our group (PolicyLab) modeled and published Rt in every county in the nation throughout 2020 and I assure you it was absolutely not the case that Rt<1 when the vaccines rolled out nor was it true that vaccine rollouts increased Rt.
The Rt was very high in many places in late fall and early winter as many places that didn’t experience major waves in spring or summer 2020 experienced their first large waves (waves have locally high Rt) in fall to winter.
Sorry but on this one you are REALLY far off (and if you think I am wrong please show me the data/studies substantiating your claim that Rt was less than 1 all around and increased locally at a place when they had their vaccine rollouts, and better yet some evidence that vaccine rollouts increased Rt)
4
4
130

Mar 21
Esta semana, la misión se reunió con seis organizaciones juveniles: Juventud, Política y Desarrollo; Juventud Obrera Cristiana; Asociación Politai; Voces al Poder; Patria C y PolicyLab.


1
1
3
59

What prevents pregnant, postpartum people with opioid use disorder from accessing care?
From interviews with interest-holders from across PA, PolicyLab researchers developed narratives that merged themes through the lens of four separate perspectives.
research.chop.edu/cornerston…
1
1
91

We're excited to announce a $1M grant from @pewtrusts to support @PolicyLabCHOP. This funding will enable our PolicyLab to continue its mission of bringing rigorous academic and community-partnered research to pressing policy issues.
Learn more: ms.spr.ly/6011QkAIS.

1
4
505

Congrats to PEM attending Dr. Polina Krass and team who was awarded a pilot grant through Clinical Futures/PolicyLab for her work entitled “Enhancing Adolescent Suicide Mortality Risk Classification through Clinical Data Integration“.
#PEM #MED #MedResearch
2
155

28 Dec 2025
एक्सएलआरआई जमशेदपुर के छात्रों ने ‘पॉलिसी लैब’ में झारखंड के औद्योगिक भविष्य को दी नई दिशा || SA News Jharkhand
#SANewsJharkhand #xlrijamshedpur #PolicyLab #jamshedpur #news
Detail News
👇
facebook.com/share/p/19zFfkX…

24
31
91
Thanks to Rep. Khan for elevating this important issue for PA families and for inviting PolicyLab researcher Dr. Aditi Vasan to share her expertise!
Dr. Vasan explains what the Working Pennsylvanians Tax Credit will mean for working-class families ⬇️
11 Dec 2025

PA House Democrats passed one of the strongest anti-poverty measures in years — the Working PA Tax Credit sends dollars straight to working families.
1
7
390

5 Dec 2025
Our First Atrium Post ! and it comes with impact. Our Former „PolicyLab“ is now called Atrium.
So, welcome to AVE Atrium, where we explore ideas that aim to transform Europe.
If you are building a house, you must understand the ground you are building on, unless you want to watch it collapse in a landslide. Similarly, if we seek to build a European Federation, we must understand our history and our heritage - because they are the foundation, the soil upon which the House of Europe, the European Federation, must stand.
This is one of our eight core values @AveEuropae: we stand firmly behind our European heritage and seek to reignite the European spirit. May Europe arise.
Stay tuned for more content like this - this post opens our European Foundations Series. Its gonna be awesome.
AVE Europa!


3
14
63
4,940
Evidence-based policies can help kids get a healthier start.
New PolicyLab research in @Health_Affairs shows that $300/month during pregnancy can help families improve their child’s health.
Learn how this simple support can make a difference. healthaffairs.org/doi/full/1…
1
5
5
268

4 Sep 2025
#Newteaching
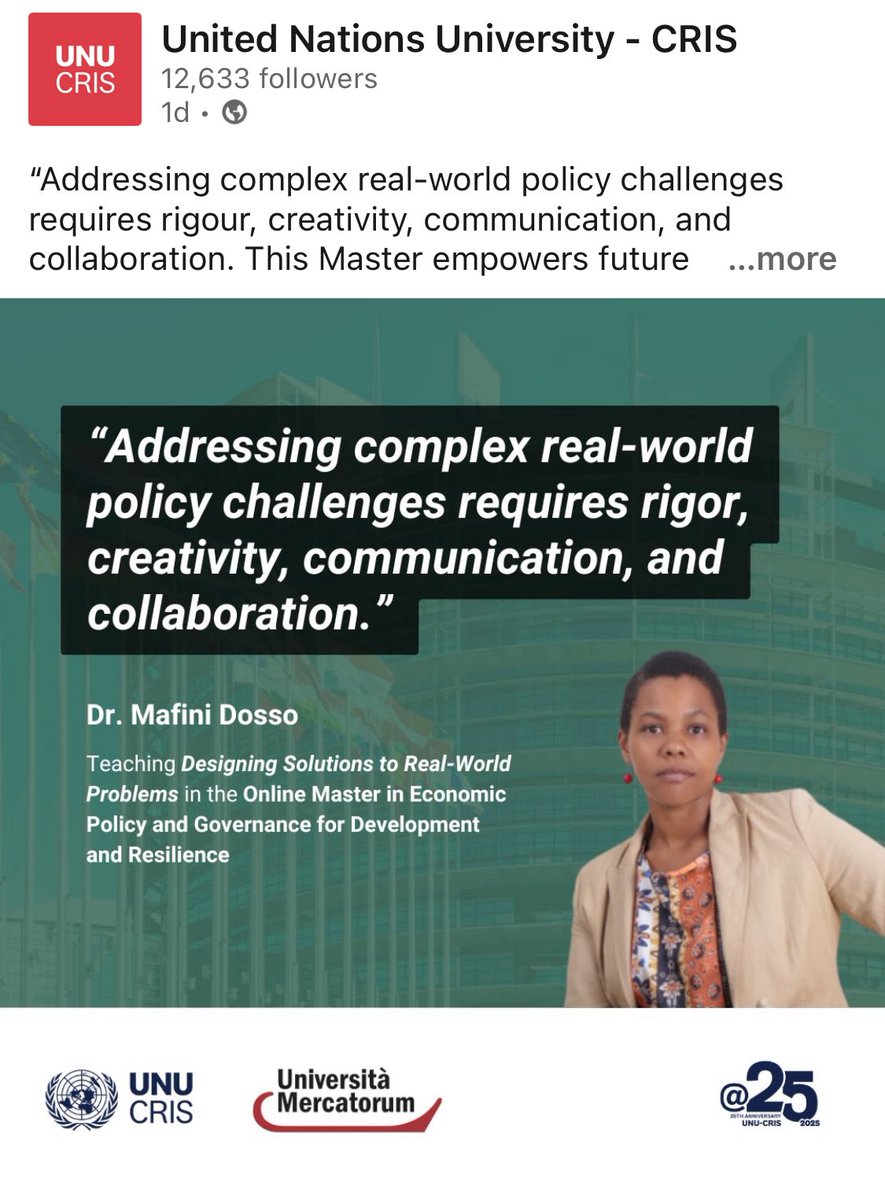
@UNUniversity #CRIS and @telematiche
📜 Master in Economic Policy and Governance for Development and Resilience. (First level Master)
🔍Details and enrollment open at cris.unu.edu/online-master-e…
#policylab #creativity #innovation to address #realworldproblems
5
2
5
178

14 Aug 2025
Generative AI policy labs launched at five universities partner with state governments to prototype smart-regulation sandboxes for emerging technologies .#PolicyLab #Sandbox
1
27

17 Jun 2025
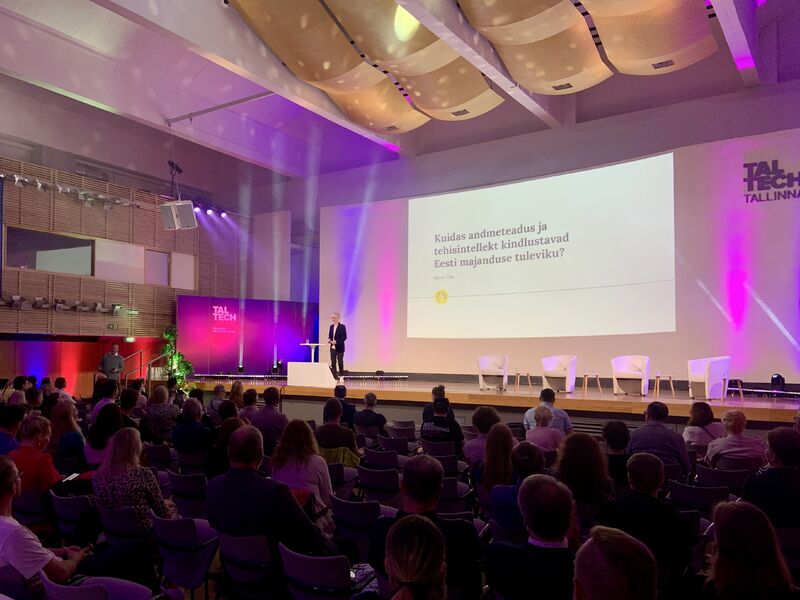
🟦At @CyberTaltech Inn. Festival, @policylab, the newest partner in the @AMIGDALAPROJECT, presented its latest work on using big data to drive green, export-led growth in Eastern Europe highlighting how digital tools can support sustainable policy in a rapidly changing world.
1
1
2
23
“It’s time to yell “fire” for America’s children”
PolicyLab researcher Dr. Diana Montoya-Williams and @ChildrensPhila Physician-in-Chief Dr. Joe St. Geme highlight the critical importance of Medicaid for children in this recent @PennLive op-ed. pennlive.com/opinion/2025/05…
1
4
166
27 May 2025
🟩The @AMIGDALAPROJECT consortium is currently in Leuven for its third General Assembly! On the first day, we shared key results and introduced our new partner #PolicyLab!
🟦The day will conclude with a city walk led by Wouter Nijs from @VITObelgium. Stay tuned!
1
1
3
40

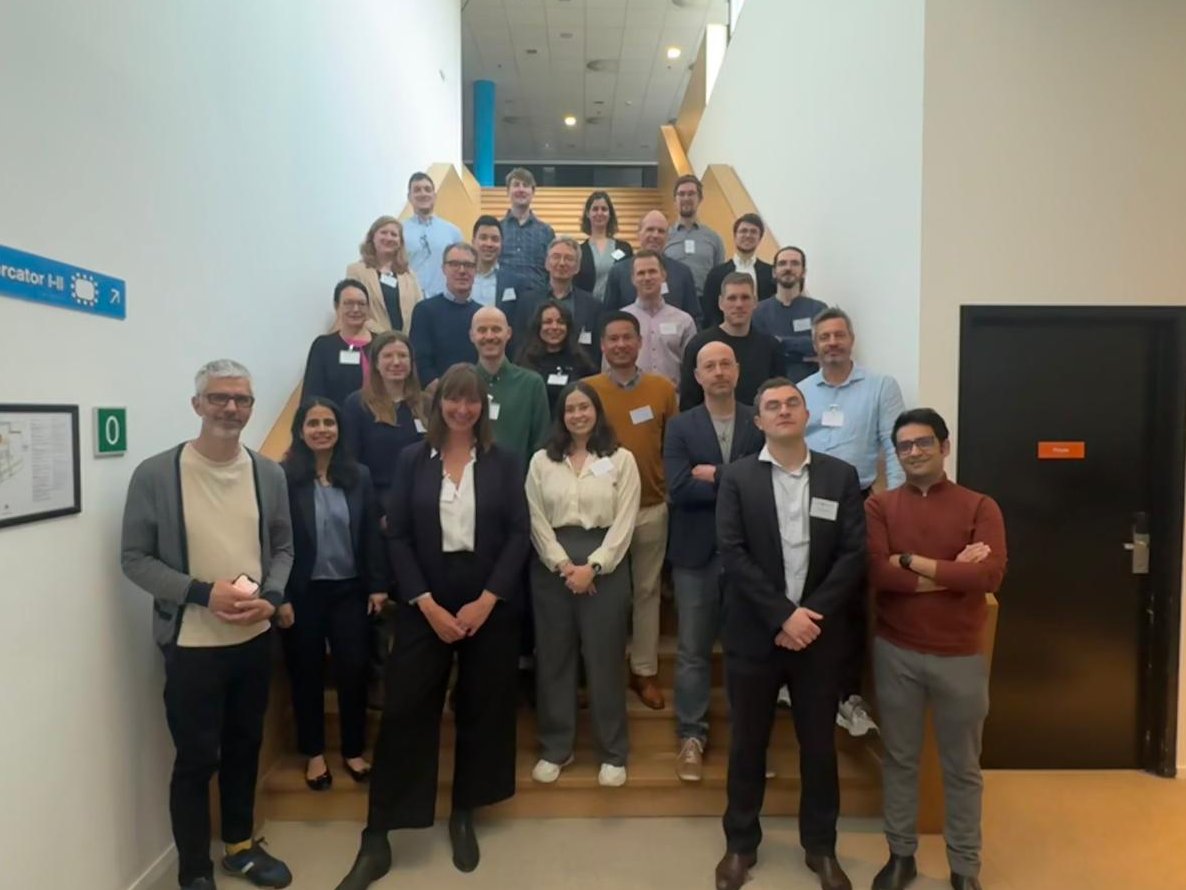
These conversations underscored the importance of intergenerational collaboration in addressing today's complex challenges. #WYDENetwork #PolicyLab #IntergenerationalDialogue #GlobalLeaders #FutureofGovernance"
2
13

10 Apr 2025
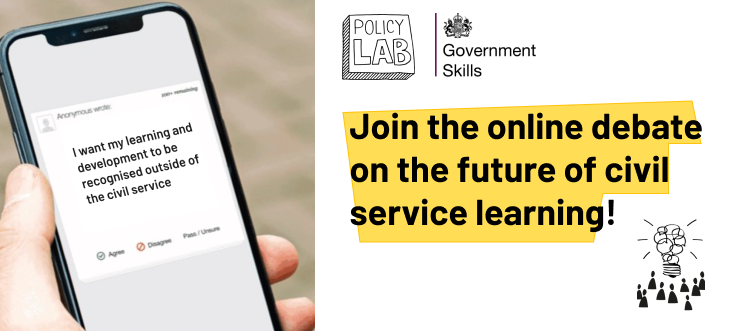
Government Skills & @PolicyLab invite UK civil servants to join a large-scale and innovative online #CollectiveIntelligence debate to shape the future of learning and development within the #CivilService.
The debate will take place from 22–29 April.
Sign up: jumpto.policylab.gov.uk/futu…
1
2
476