
15 Jul 2025
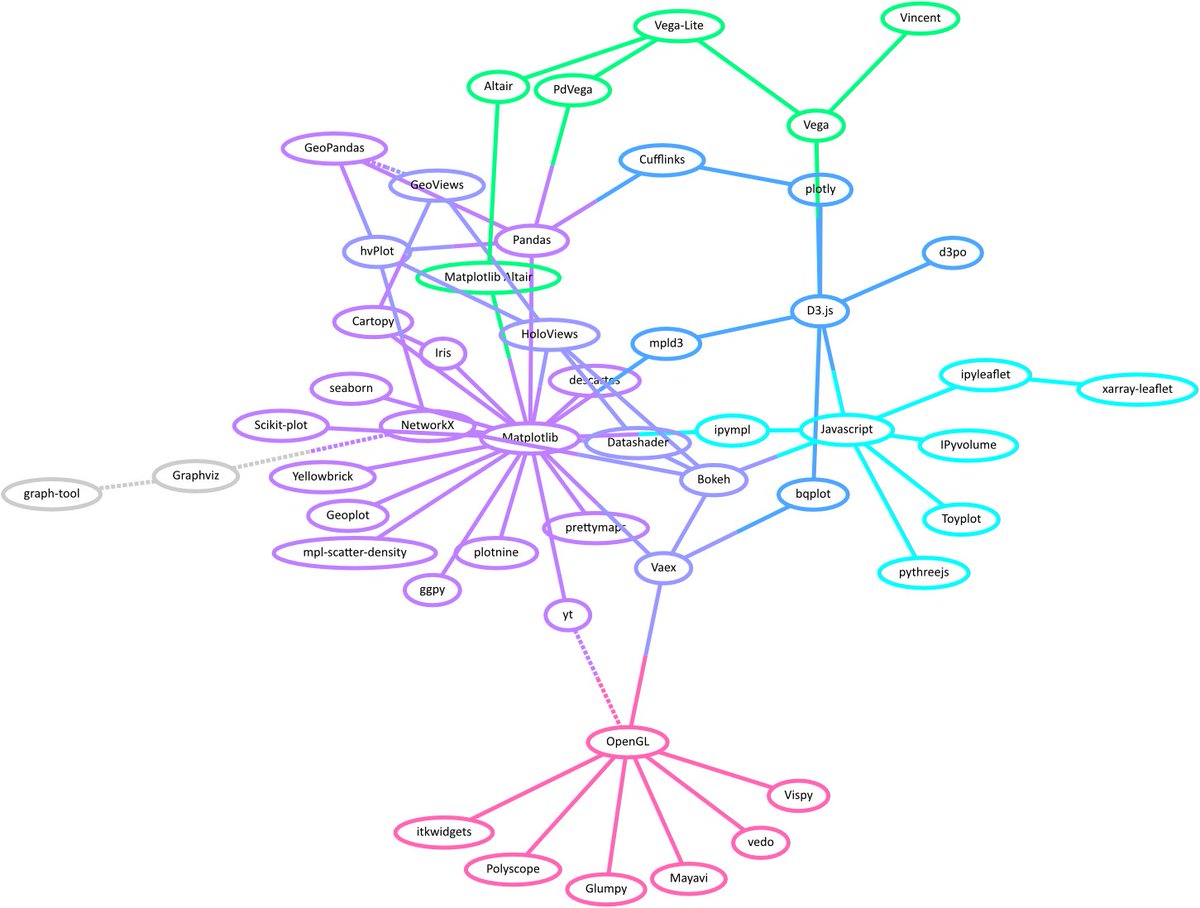
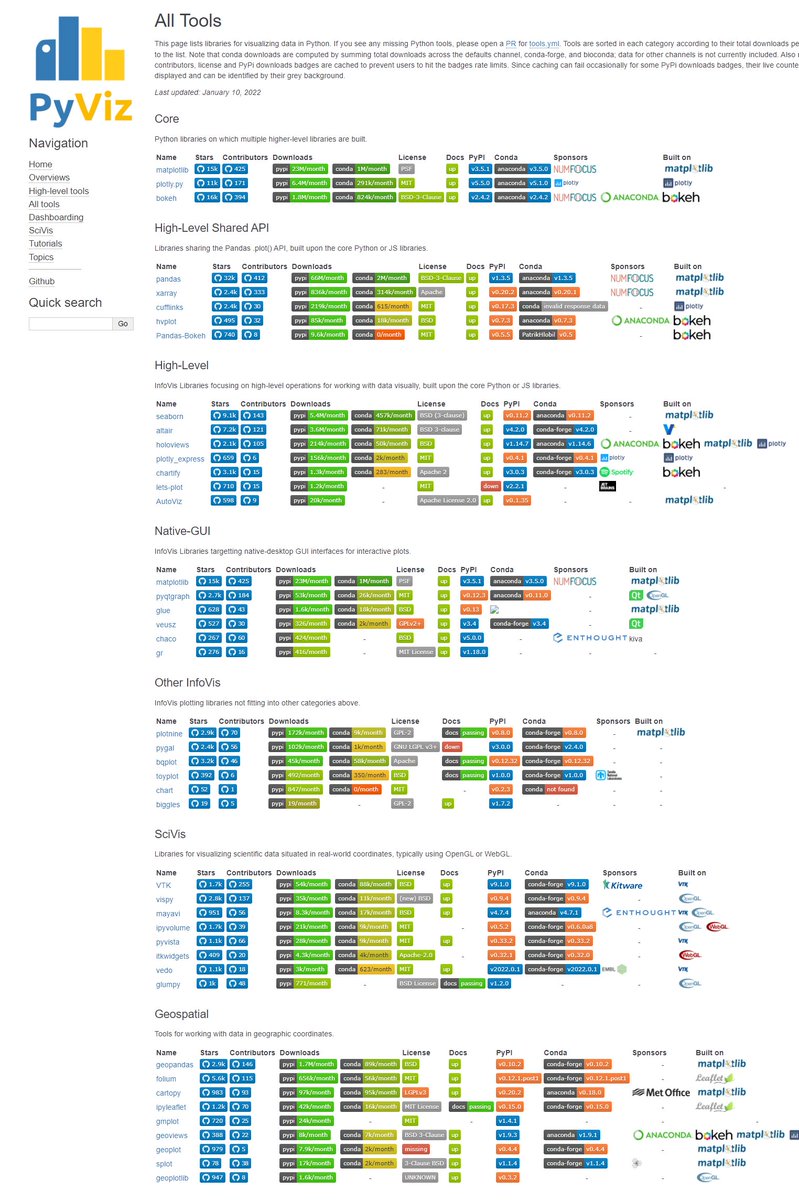
All Tools — PyViz - 100 different libraries for Python data visualization
pyviz.org/tools.html
2
201


30 Oct 2024
📢New Extension Alert: panel-graphic-walker
Wraps GraphicWalker by @kanaries_data. A Tableau like UI element.
Can be used in Notebooks and Panel data apps.
Currently scales to @pandas_dev dataframes on your server.
👇Link below
#pyviz #dataviz #datascience #Analytics
1
3
9
1,536

23 Sep 2024
pyvizを使ってagentを書いて、LLMにニュース群をぶち込んだら関係図を出力するようにしてみた。
mermaidやnetworkxの出力は正直見づらいので、主要ノードを多角形均等配置してしまう(そこで杉山法を使う?)のが良さそう

2
221

12 Jul 2024
On a coding high
Not only did I get graphRAG working; I’ve even gone a step beyond and visualized the graph with pyviz
4
550

19 May 2023
@mkennedy . Something for Python Bytes? This is actually also a Big step for Python in the browser as we have been testing so many of the core PyData and PyViz libraries to get our docs running in Pyodide.
4
188
16 Apr 2023
Improving the @Panel_org notebooks when running in Panelite/ #JupyterLite has been a big journey through the PyData and PyViz ecosystem to identify what works and what does not in @pyodide.
For example fastparquet was added recently making @pandas_dev "read_parquet" possible.
4
165

2 Mar 2023
… data analysis and data visualization in our Python software suite pyMULTI, pyBAT and pyVIZ here github.com/SchlierfLAB/autoF… including sample data to explore. Enjoy the read and looking forward to comments. Stay tuned for more multiwell plate smFRET 5/5
1
495


We have added more OpenGL libraries to our overview of PyViz libraries: pyviz-tutorial.readthedocs.i…
#Python #dataviz #PyViz
2
3
12 Nov 2022
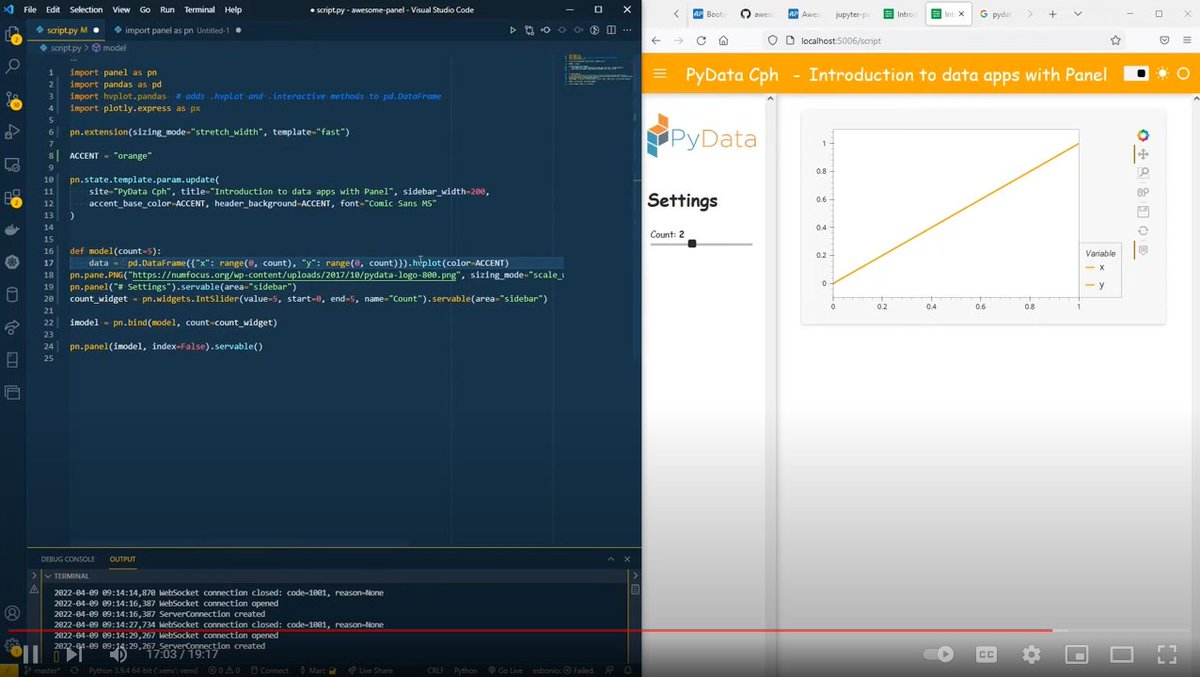
Do you want an introduction to data apps with @Panel_org?
Check out my video from @pydatacph
youtu.be/BeBVdjENBZo
#pyviz #dataviz #datascience #businessintelligence @PyDataGlobal
3
4
25

21 Sep 2022
Pandas in python, convert to a dataframe, pyviz to visualize, summary statistics, etc. you can do a multitude of things from there, as there are thousands of libraries compatible with pandas data frames.
1
42

29 Jun 2022
We just made HoloViews 1.15.0 release candidates available and need your help to test them. Get them with `pip install holoviews==1.15.0rc2` or `conda install -c pyviz/label/dev holoviews`.
1
3
8

5 Jun 2022
اتذكر كان فيه معسكر تدريبي قبل فتره .( معسكر همه ) وهذي الادوات المستخدمة
Jupyter - scikit - numPy - pandas-ethereum-java Script - PyViz - etherscan-Metamask - python - Scipy - transferFlow- React
5

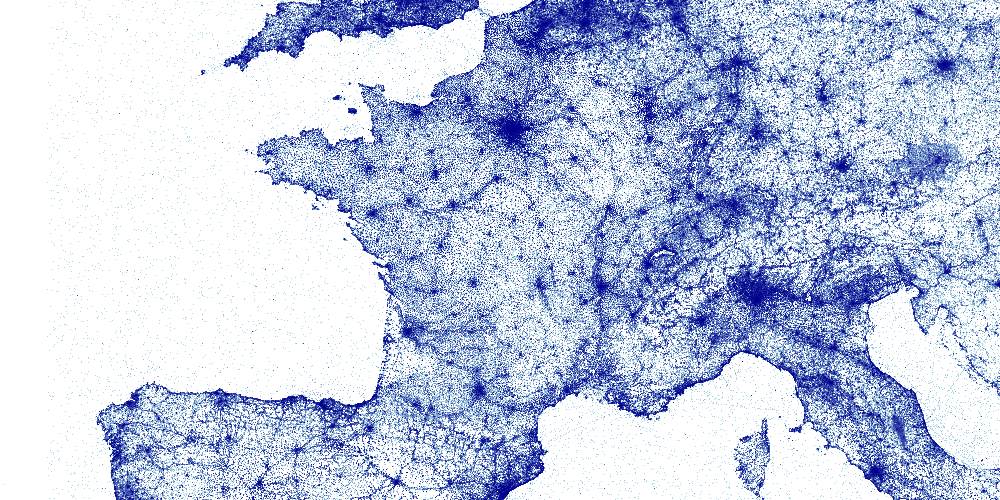
#Python #visualization of 350 Million geo-coordinates with #parquet (streamed processing) and #datashader.
#jupyterlab #pyviz ad.vgiscience.org/twitter-gl…
7
24

17 Mar 2022
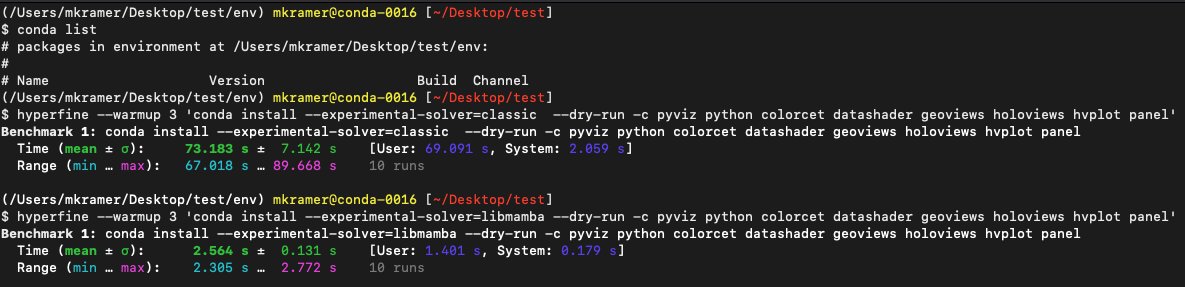
The performance of the new integrated libmamba solver in @condaproject is, frankly, staggering.
The example below shows a speedup from 69 -> 1.4 seconds (nearly 50x speedup) for a fairly complex set of PyViz dependencies installing into an empty conda environment.
2
13
46

To my #DigitalHumanities & #AI/#ML folk: #OSS & #OA are gr8 for #SelfDirectedLearning & #SelfPublishing by #CitizenScientists. @MLJARofficial #Mercury @ProjectJupyter #Notebook-to-#HTML looks interesting. Will explore w/ @PyViz_org #PyViz. mljar.com/mercury/ cc @SciStarter
2
2

Want to learn how to add arrows to your Python plot? ↗️➡️↘️
Read this introduction to arrows and text annotations in matplotlib plots:
towardsdatascience.com/arrow…
#python #matplotlib #datascience #dataviz #pyviz
1
1

14 Jan 2022
Day 10 of #66daysofdata with @KenJee_DS
- Installed and tried out a few #datavisualization #Python libraries as listed in PyViz website (H/T great share by Charly @DataChaz)
13 Jan 2022

PyViz is an awesome resource that lists *all* the 🐍 #Python libraries you can use for visualising data!
→ pyviz.org/tools.html
✓ Core
✓ Dashboarding
✓ Geospatial
✓ Graphs & networks
✓ Native-GUIs
✓ SciVis
✓ Color-mapping
many more!
#Dataviz #ML #DataScience
1
3
50