
Joined July 2018
- Tweets 107
- Following 17
- Followers 1,550
- Likes 138
13 Photos and videos


PyViz retweeted

5 Oct 2024
Did you know you can build interactive applications with @Panel_org to explore fractals?
Link to live app and code on @huggingface below.
#Python #dataviz #DataScience
4
2
8
2,742

In our latest blog post, we explore the landscape of Python web frameworks. Whether you're interested in data dashboards, interactive applications, or exploring ML interfaces, we compare popular frameworks like Streamlit, Dash, Flask, and more. ploomber.io/blog/survey-pyth…
2
10
36
1,635
PyViz retweeted

11 Jun 2024
New blog post about the revamped Xarray tutorial!
xarray.dev/blog/xarray-tutor…
Many thanks to @NASA Open Source Tools, Frameworks, and Libraries program for funding this work!
See the tutorial material here: tutorial.xarray.dev/intro.ht…
2
19
67
7,336
PyViz retweeted

7 May 2024
hvPlot 0.10 has just been released! Check the release blog post that also goes over the main features released in version 0.9! #Python #dataviz #DataScience
blog.holoviz.org/posts/hvplo…
2
8
32
7,423

Our project family continues to grow 🪴🙌! We're excited to welcome @HoloViz_org, who has joined NumFOCUS as a sponsored project!
Learn more about the project here: numfocus.org/project/holoviz. #openscience #support #scientificcomputing #datascience

2
16
32
8,583
PyViz retweeted

10 May 2023
🎉 We’re thrilled to announce @AnacondaInc’s first ever #DataAppContest !!
The competition goes from June 13-30, so start building your team for the chance to win great prizes & showcase your skills!
Learn more & register here 👇
bit.ly/3VUzDxd

11
22
7,015
PyViz retweeted

10 Jul 2019
Why you should move from #pandas to @dask_dev and from @matplotlib to @PyViz_org #hvplot ? Because of this!!! done in 3sec:135Mln stars from #StarHorse and @ESAGaia (I 🥰#parquet)
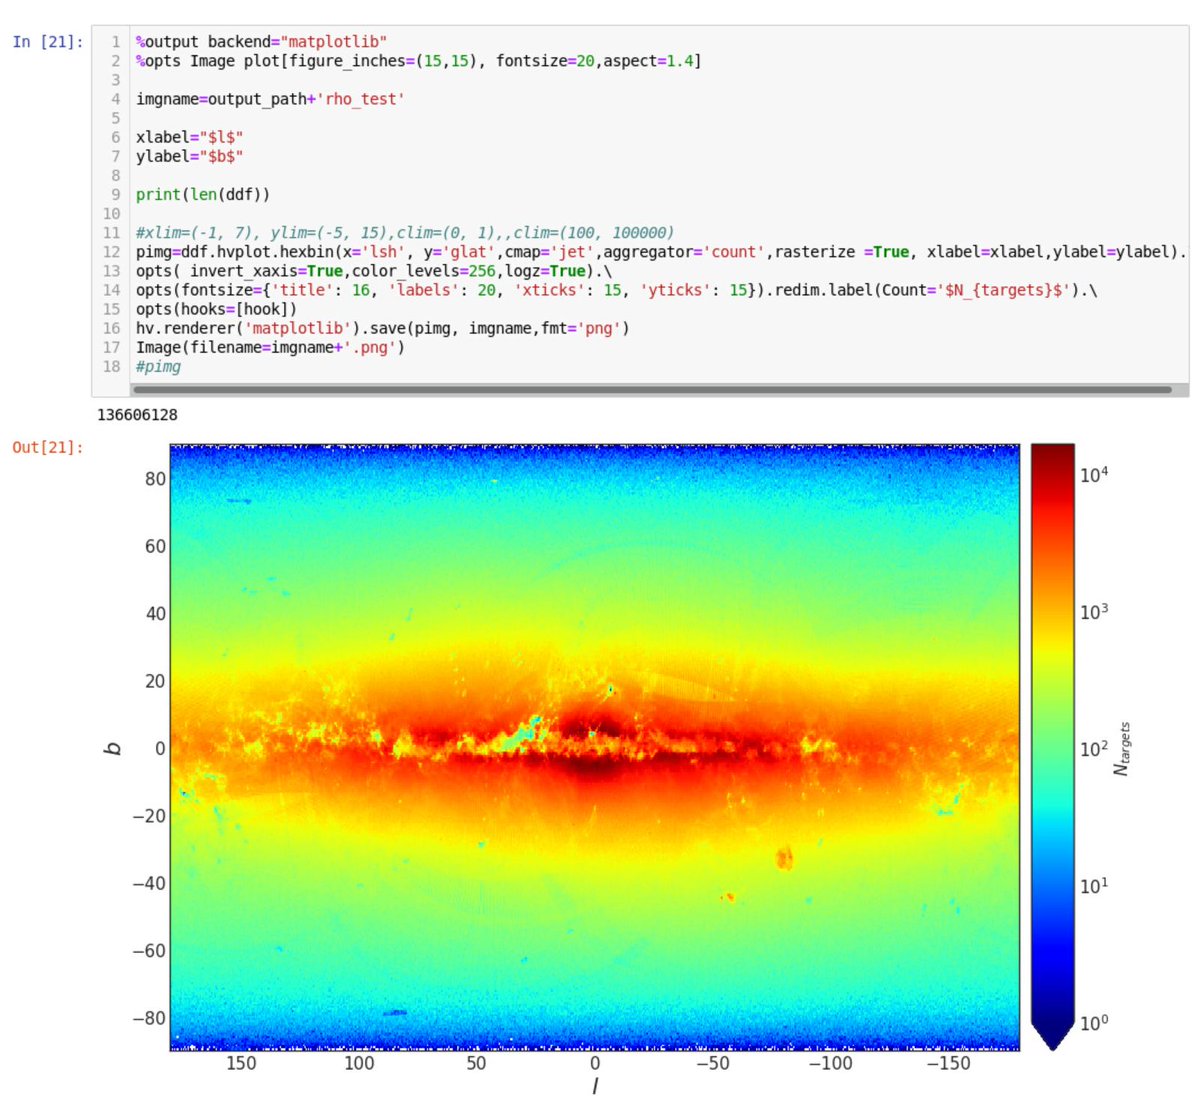
3
14
38
PyViz retweeted

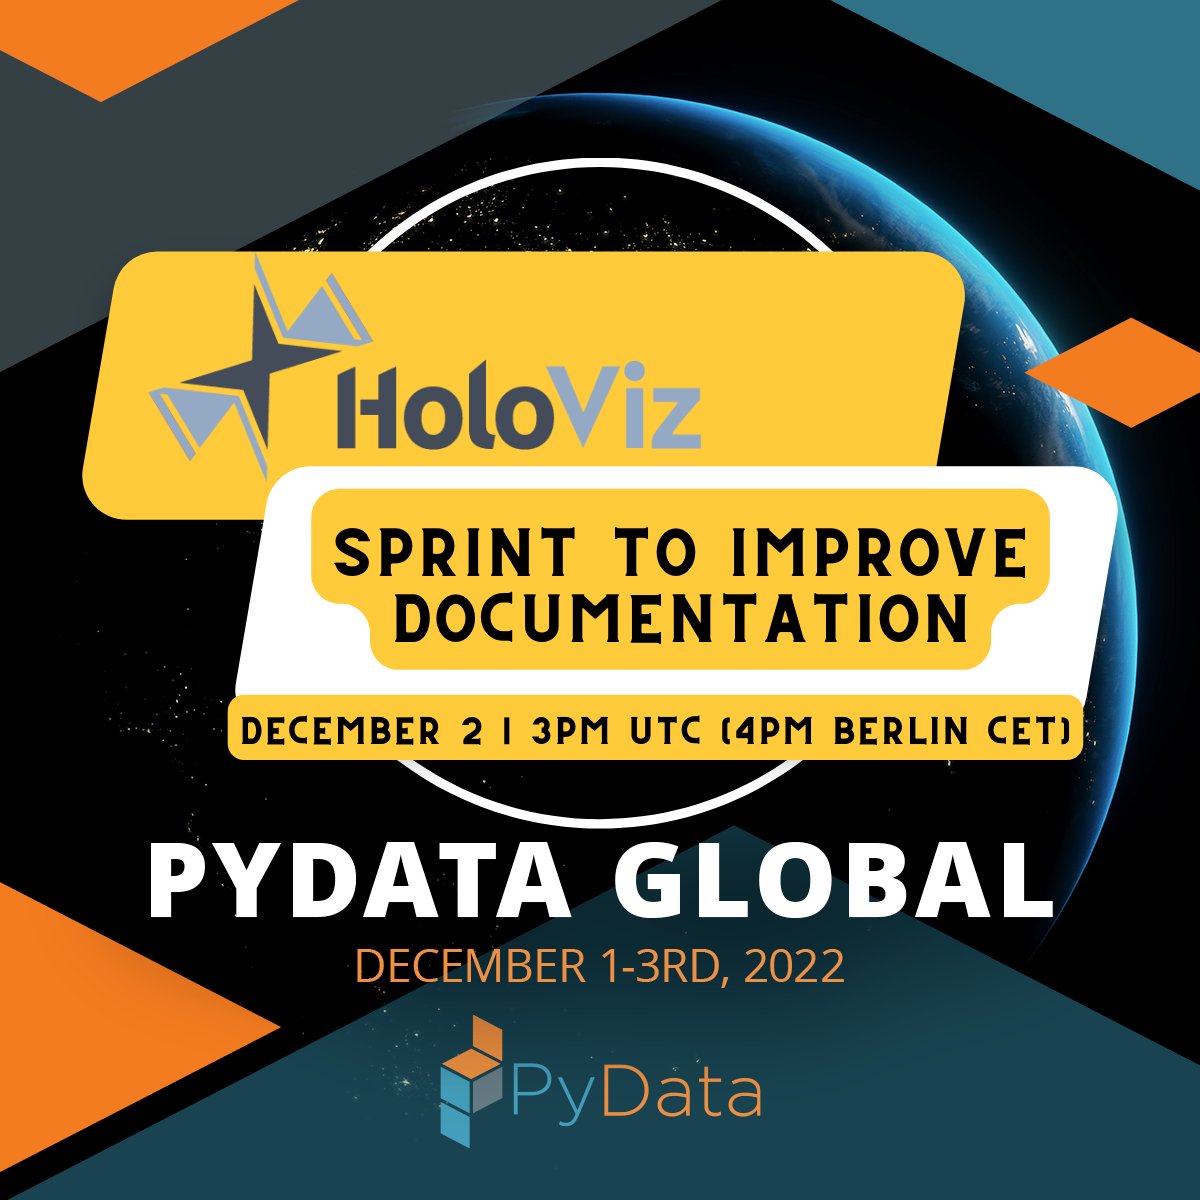
1 Dec 2022
Interested in contributing to open source? Start with @HoloViz_org at @PyData!

Thank you to @HoloViz_org for joining us this year!
Take part in the conference including several sprints by purchasing a ticket for PyData Global 2022 at pydata.org/global2022/
8
8

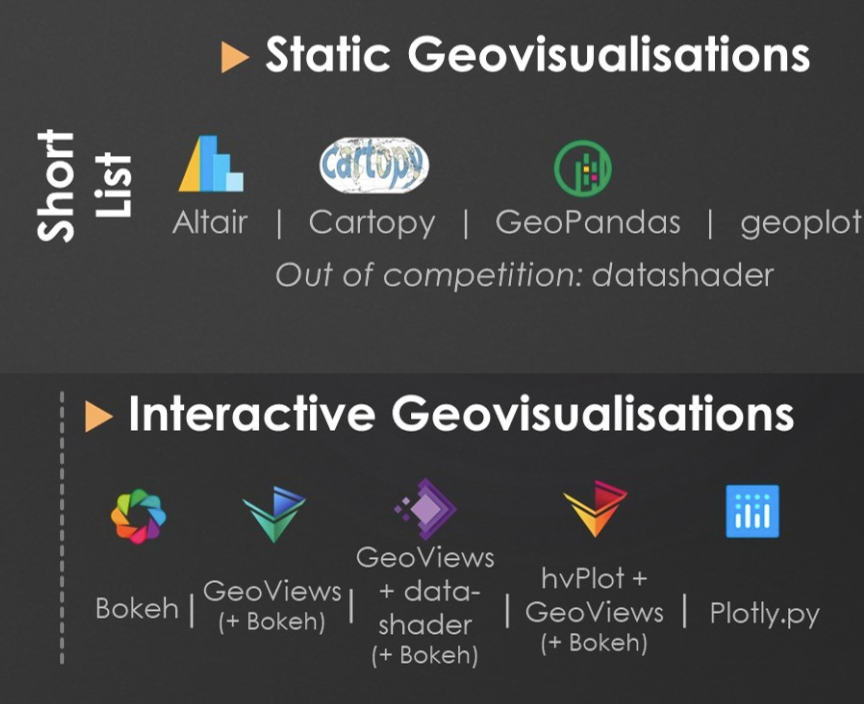
29 Nov 2022
Check out this new review of Python viz libraries for geographic applications, comparing Altair, @Bokeh, Cartopy, @Datashader, GeoPandas, Geoplot, GeoViews, hvPlot, and Plotly: gregorhd.github.io/geospatia…
1
14
80
5 Oct 2022
This HoloViz survey is relevant to all @datashader, @HoloViews , @Panel_org , hvPlot, GeoViews, Lumen, Param, and Colorcet users, plus @bokeh, @matplotlib, and @plotlygraphs users working via hvPlot or HoloViews. Make your voice heard!
5 Oct 2022

Attention anyone interested in Python data visualization! HoloViz.org is trying to improve the user experience of our docs and websites. If you have ever tried out a HoloViz.org tool, please help by filling out our survey: docs.google.com/forms/d/e/1F…
3
17
PyViz retweeted

17 Mar 2022
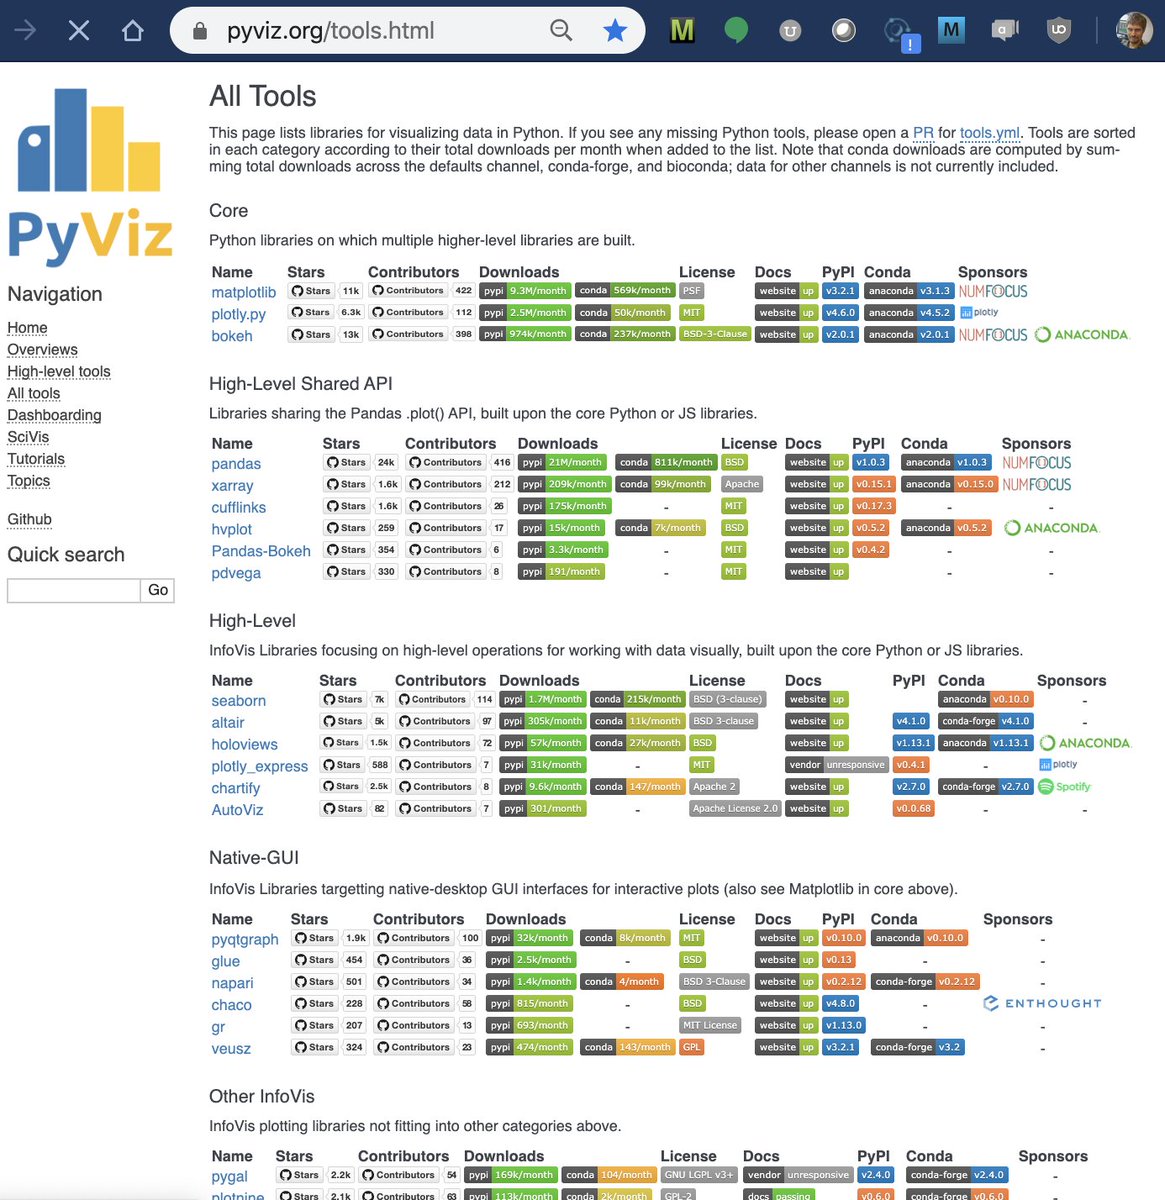
High-level tools to simplify visualization in Python holoviz.org by @HoloViz_Org
2
6
PyViz retweeted

19 Jan 2022
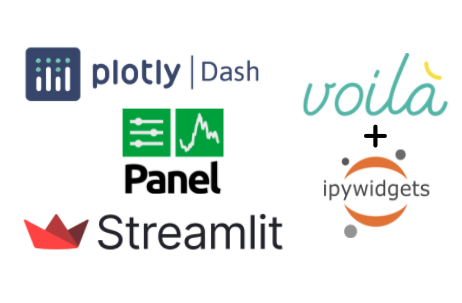
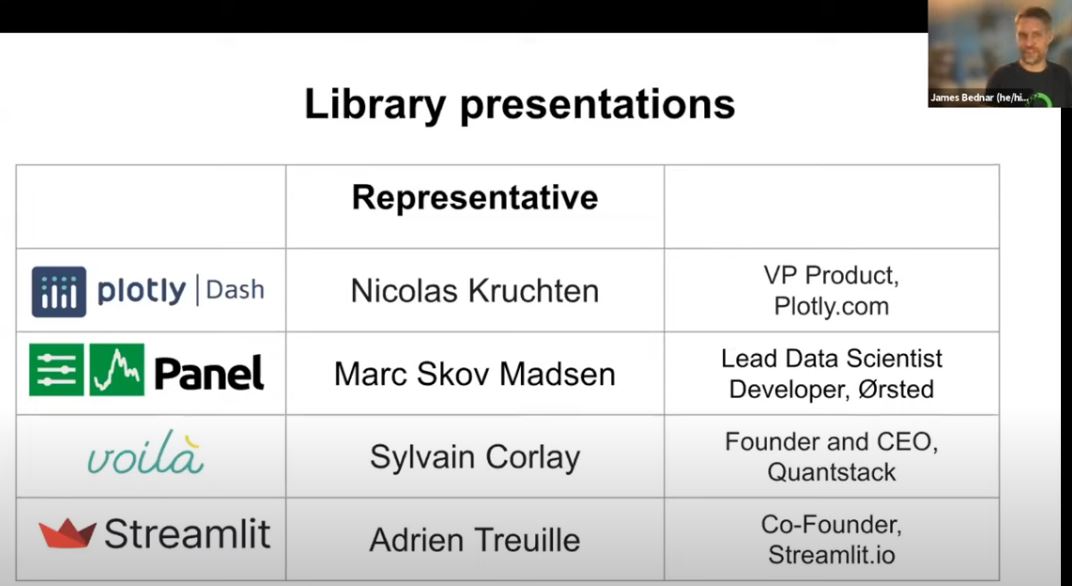
This week I have been enjoying excellent talks from @PyData (Oct 2021) -thanks. Literally hundreds of Python presentations to choose from. One of my favourites was the discussion about @plotly Dash, @panel_org, @Project Jupyter's #Voila, and @streamlit. youtube.com/watch?v=4a-Db1zh…
3
5
PyViz retweeted

15 Jan 2022
You can find now find the Python Dashboarding Shootout and Showdown video from PyData Global 2021 here youtu.be/4a-Db1zhTEw
Code github.com/marcskovmadsen/aw…
@PyDataGlobal feel free to replace "Philipp Rudiger" with "Marc Skov Madsen" in the description😉
#python @Panel_org

ALT Python Dashboarding Shootout and Showdown | PyData Global 2021 video
2
11
31
PyViz retweeted
29 Nov 2021
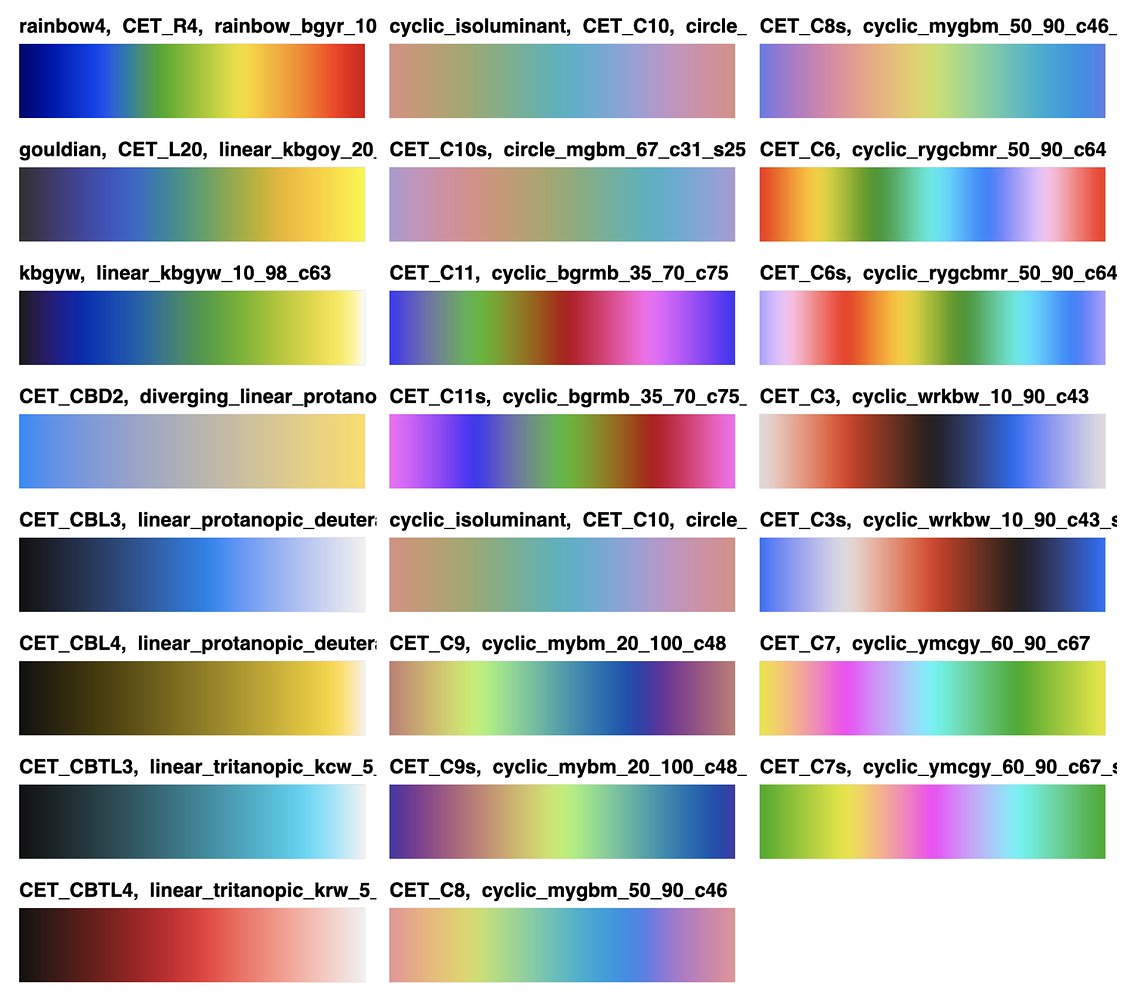
Announcing Colorcet 3.0! Thanks to Peter Kovesi and Randy Pittman, colorcet.holoviz.org now has 23 new perceptually uniform colormaps for Python, including Rainbow4 (a drop-in replacement for Jet), Gouldian (a better Parula), 15 new cyclic maps, and 5 new colorblind-safe maps.
5
71
295
26 Oct 2021
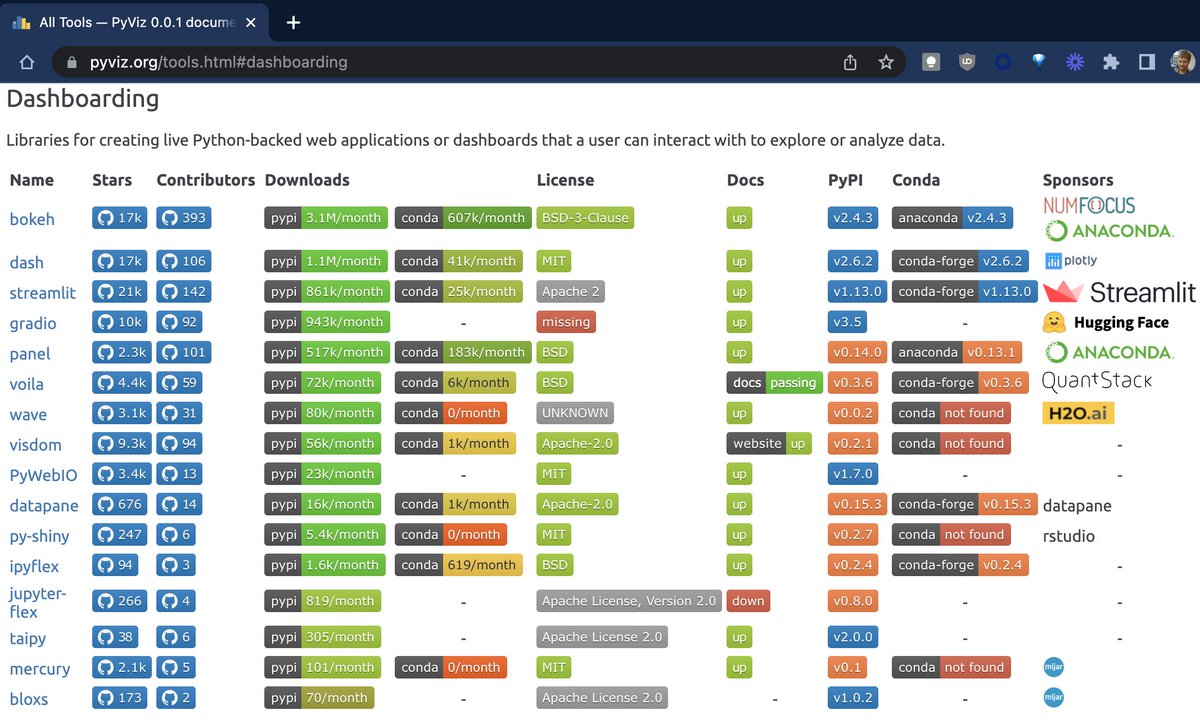
Curious about Python tools like Dash, Panel, Voila, and Streamlit for building web apps and dashboards? Come see representatives of each library at the Dashboarding Shootout and Showdown at #PyDataGlobal2021 (pydata.org/global2021/schedu…) on 28 Oct and decide which one is for you!
4
17
95
PyViz retweeted

26 Oct 2021
We're a little late announcing this, but our fabulous HoloViz and @AnacondaInc summer intern Blythe Davis (@fishesandfishes) created this fancy new notebook and app for exploring which of the planets discovered outside the solar system might support life: examples.pyviz.org/exoplanet…

2
10
38
PyViz retweeted

25 Oct 2021
Handles multiple fields too! Shows us as using openGL _and_ Qt (admittedly our openGL support is limited/optional) but a super nice feature!
1
1
3
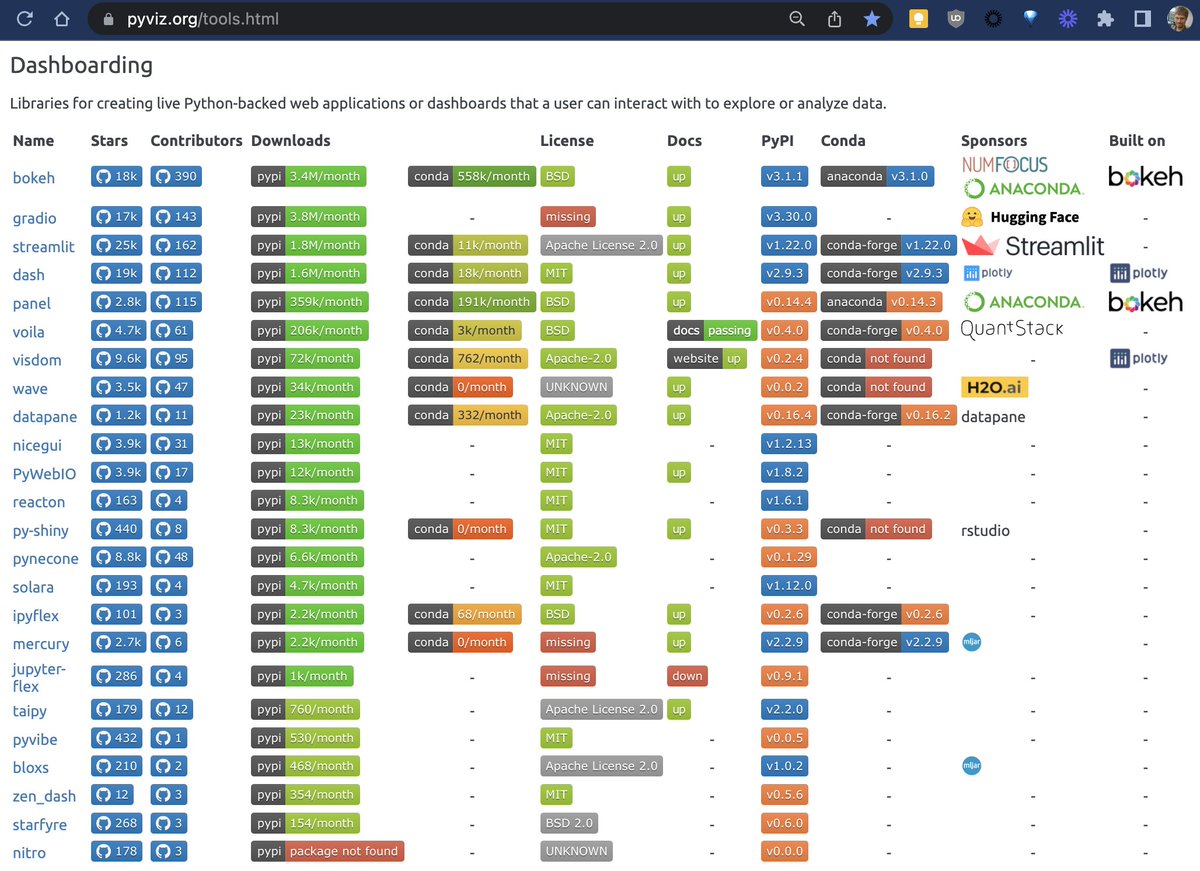
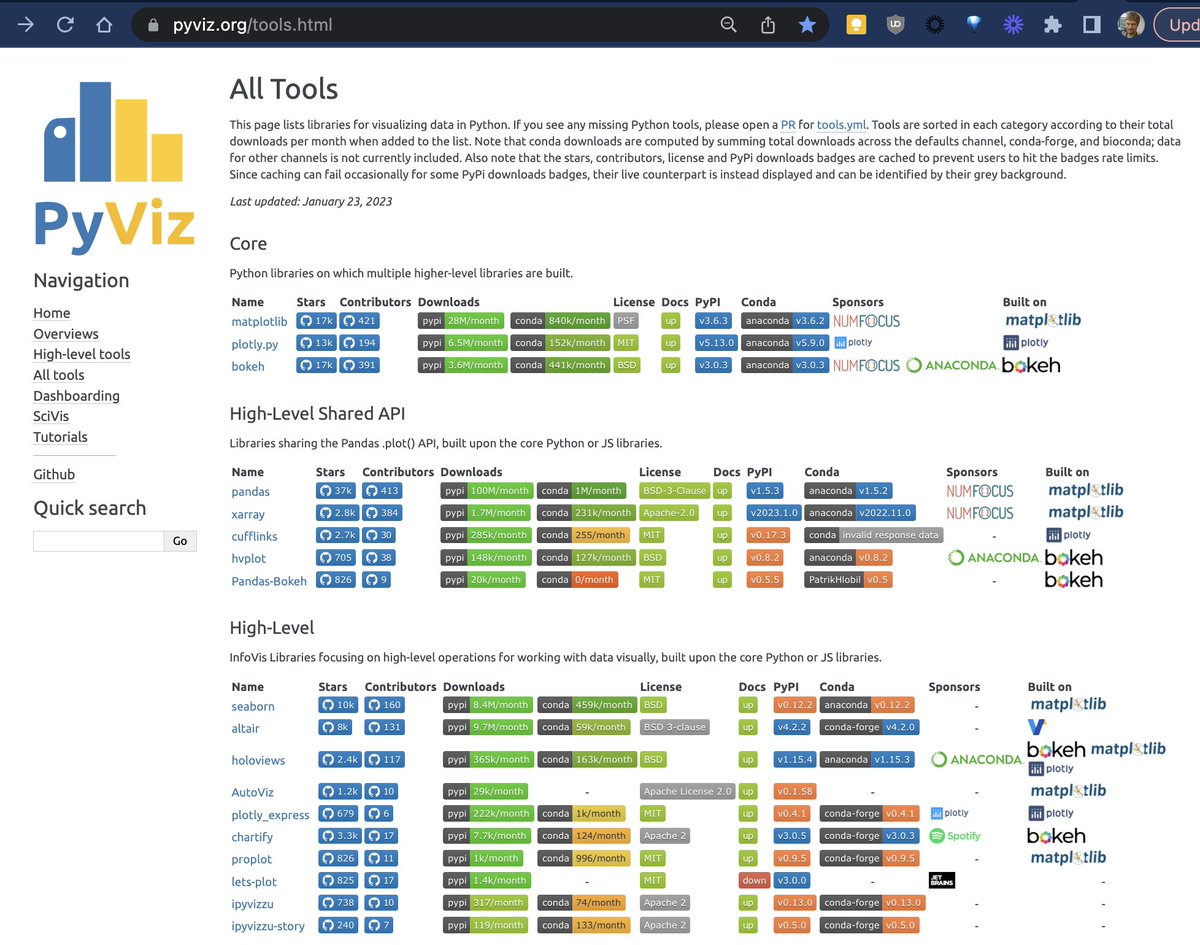
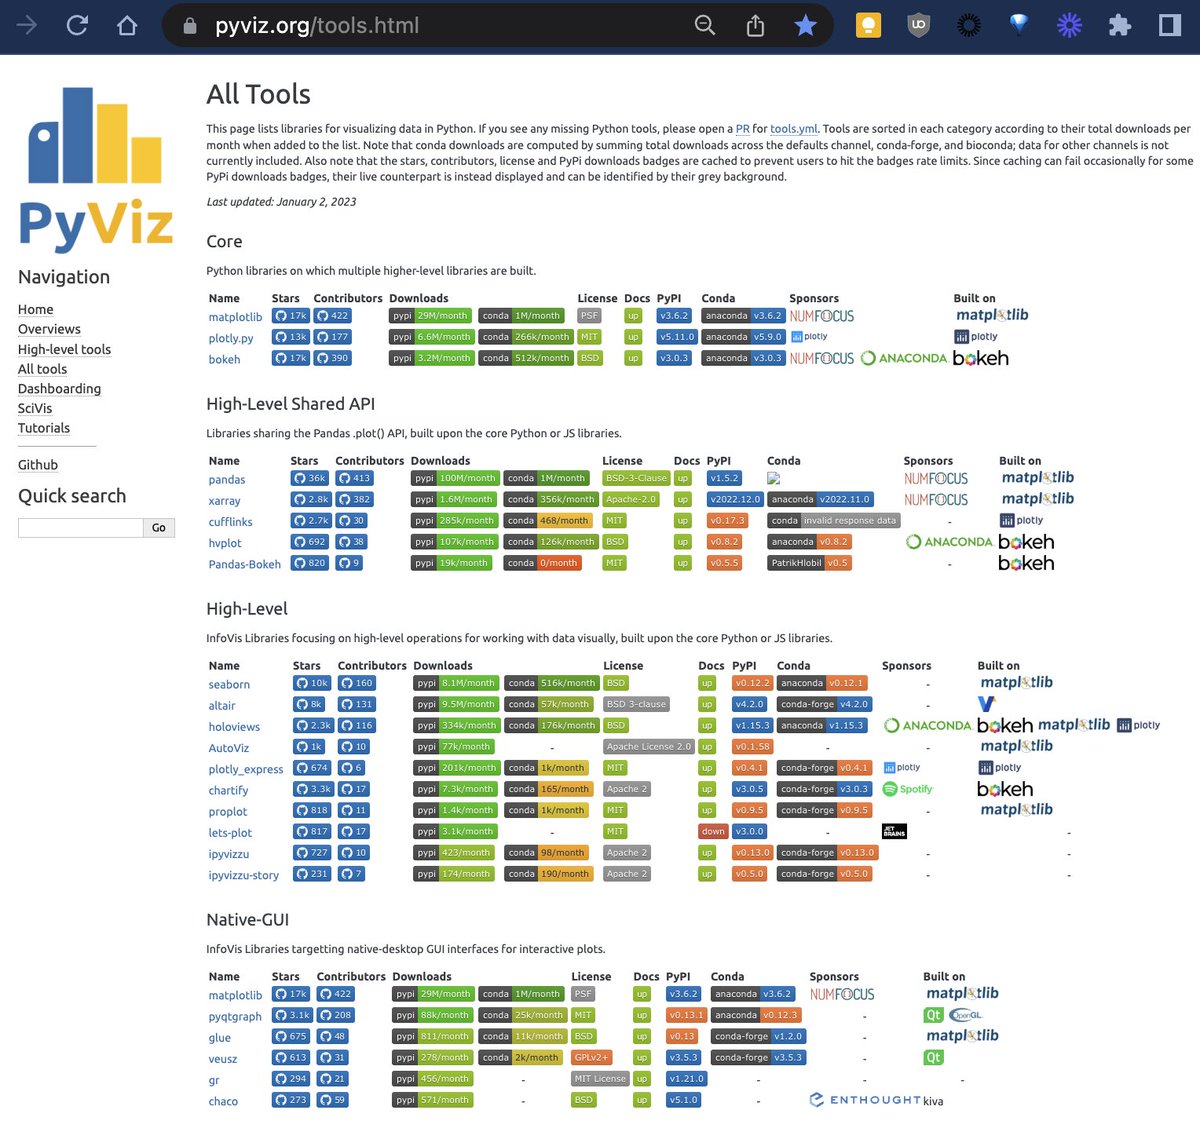
25 Oct 2021
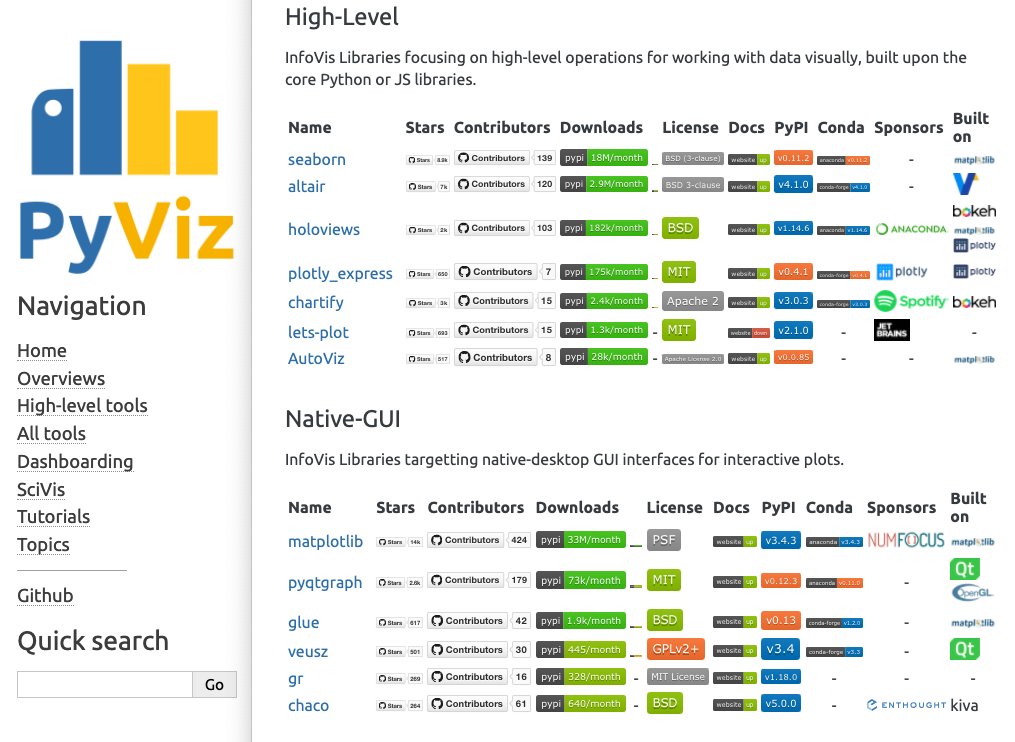
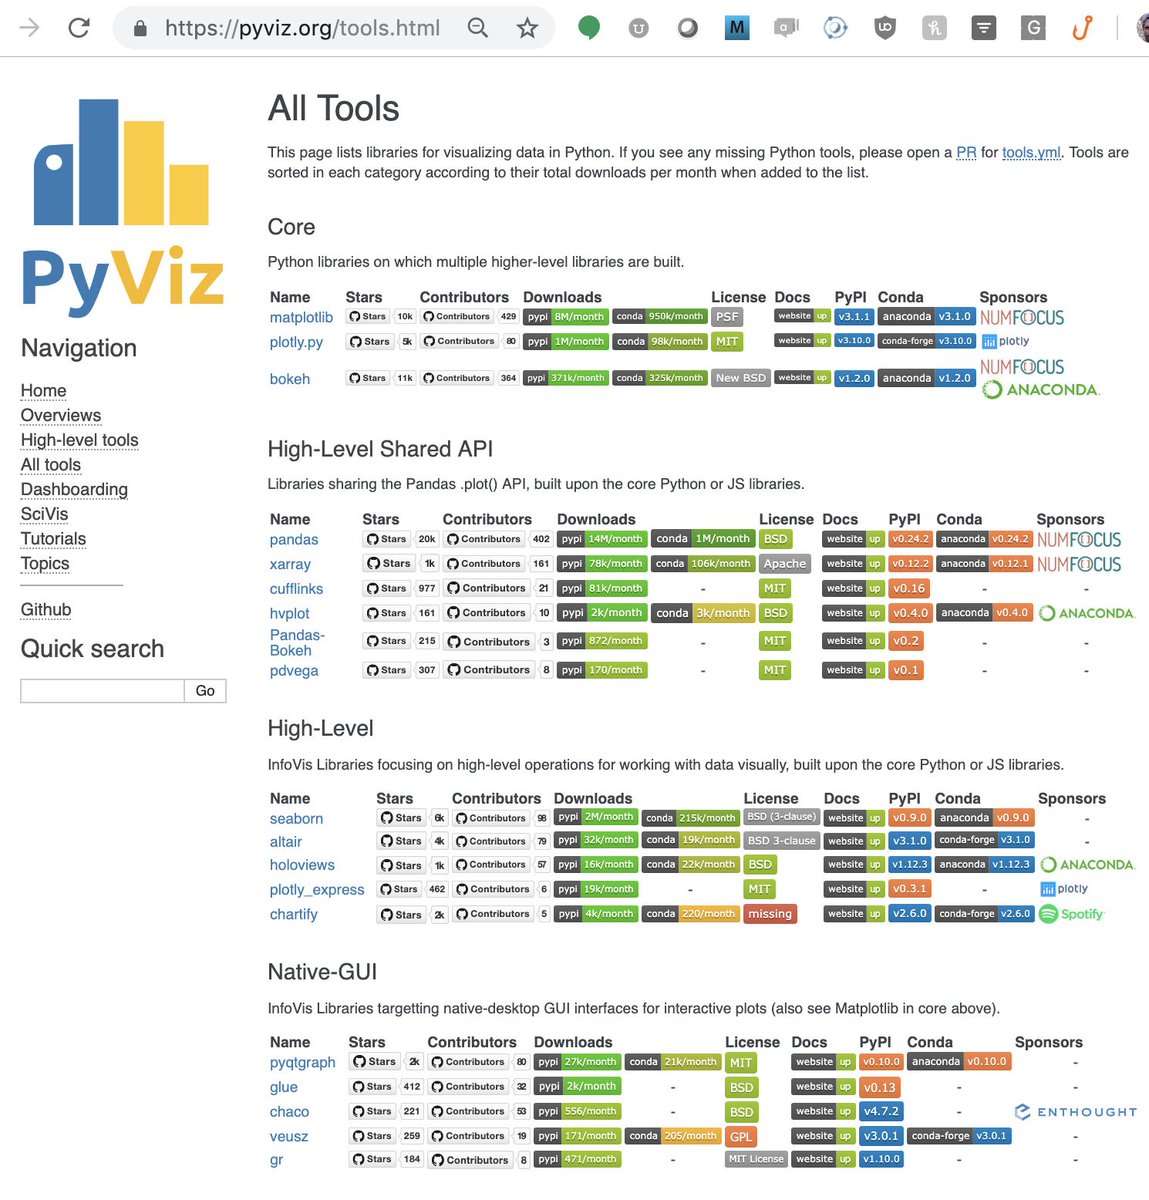
Thanks to @MaximeLiquet, PyViz.org/tools now has a "builton" field to show how Python viz libraries relate to each other: 25 tools built on @Matplotlib, 8 on @OpenGL, 6 each on @Bokeh and @PlotlyGraphs, and many more. Please open a PR if you see something missing!
1
28
100
PyViz retweeted
4 Jun 2021
This presentation will cover the latest from the "big four" plotting libraries in Python (@matplotlib , @plotlygraphs , @bokeh , #Altair), plus dashboarding (#Dash, @streamlit , @Panel_org , #Voila), new geospatial and 3D tools, and new @HoloViz_org features. So much going on!
2
11
PyViz retweeted
4 Jun 2021
At #AnacondaCON, we're diving into what's new with #DataVisualization.
Join @JamesABednar to learn about all the #dataviz things you never knew you could do in #Python or didn't realize could be so easy or powerful. bit.ly/34jaZMq

2
12
24