
PIVOT and UNPIVOT rotate data between rows and columns.
PIVOT: turn distinct values in one column into column headers:
SELECT *
FROM (
SELECT Year, Quarter, Revenue
FROM SalesData
) src
PIVOT (
SUM(Revenue)
FOR Quarter IN ([Q1],[Q2],[Q3],[Q4])
) pvt;
UNPIVOT: turn column headers back into rows (useful for normalizing wide tables).
The PIVOT syntax requires knowing the column values at query-write time. For dynamic column lists, you need dynamic SQL.
For most PIVOT patterns, a conditional aggregation (SUM(CASE WHEN Quarter='Q1' THEN Revenue END)) is more readable and equally fast.
#SQLServer #TSQL #PIVOT #DataTransformation
5

Jun 14
🚀 Data Analytics Interview Questions & Answers – Excel (Part 2) 📊🔥
41. What is VLOOKUP?
Answer:
VLOOKUP (Vertical Lookup) is used to search for a value in the first column of a table and return a value from another column.
Syntax:
=VLOOKUP(A2,$F$2:$H$100,2,FALSE)
Example:
Find Employee Name using Employee ID.
42. Difference Between VLOOKUP and XLOOKUP?
Concept | VLOOKUP | XLOOKUP
Search direction | Searches left to right only | Searches in any direction
Column reference | Requires column number | Uses column reference
Function age | Older function | Newer and more flexible
Return columns | Can return only one column | Can return multiple columns
Example:
=XLOOKUP(A2,F:F,G:G)
43. What are Pivot Tables?
Answer:
Pivot Tables summarize large datasets quickly.
They can:
✔ Sum data
✔ Count records
✔ Calculate averages
✔ Create reports
Example:
Total Sales by Region.
44. What are Slicers in Excel?
Answer:
Slicers are visual filters used with Pivot Tables and Pivot Charts.
Benefits:
✔ Easy filtering
✔ Interactive dashboards
✔ User-friendly reports
45. Explain Conditional Formatting.
Answer:
Conditional Formatting automatically changes cell formatting based on conditions.
Examples:
✔ Highlight top sales
✔ Show duplicate values
✔ Color negative profits
46. Difference Between COUNT, COUNTA, and COUNTIF?
COUNT
Counts numeric cells only.
`=COUNT(A1:A10)`
COUNTA
Counts non-empty cells.
`=COUNTA(A1:A10)`
COUNTIF
Counts based on criteria.
`=COUNTIF(A1:A10,">100")`
47. What are Absolute and Relative References?
Relative Reference
Changes when copied.
`=A1 B1`
Absolute Reference
Remains fixed.
`=$A$1 $B$1`
48. What is Data Validation?
Answer:
Data Validation restricts what users can enter.
Examples:
✔ Dropdown lists
✔ Date restrictions
✔ Number ranges
Benefits:
✔ Reduces errors
✔ Improves data quality
49. Explain IFERROR().
Answer:
IFERROR handles errors and returns a custom value.
Example:
=IFERROR(A1/B1,"Error")
If B1 = 0, Excel returns "Error" instead of #DIV/0!
50. What is Power Query?
Answer:
Power Query is Excel's ETL tool.
Used for:
✔ Importing data
✔ Cleaning data
✔ Transforming data
✔ Combining datasets
Common tasks:
Remove duplicates
Split columns
Merge tables
51. What are Dashboards in Excel?
Answer:
Dashboards provide visual summaries of KPIs and business metrics.
Common elements:
✔ KPI Cards
✔ Charts
✔ Slicers
✔ Pivot Tables
52. Difference Between SUMIF and SUMIFS?
SUMIF
One condition.
`=SUMIF(A:A,"East",B:B)`
SUMIFS
Multiple conditions.
`=SUMIFS(B:B,A:A,"East",C:C,"Electronics")`
53. Explain INDEX MATCH.
Answer:
A flexible alternative to VLOOKUP.
Example:
=INDEX(B:B,MATCH(A2,A:A,0))
Benefits:
✔ Faster
✔ More flexible
✔ Can lookup left or right
54. What are Macros?
Answer:
Macros automate repetitive tasks.
Examples:
✔ Formatting reports
✔ Refreshing dashboards
✔ Cleaning data
Recorded using:
View → Macros → Record Macro
55. What is VBA?
Answer:
VBA (Visual Basic for Applications) is Excel's programming language.
Used to:
✔ Automate tasks
✔ Create custom functions
✔ Build advanced reports
Example:
Sub Hello()
MsgBox "Welcome"
End Sub
56. How Do You Clean Data in Excel?
Answer:
Common techniques:
✔ Remove duplicates
✔ TRIM spaces
✔ Replace missing values
✔ Fix date formats
✔ Standardize text
Functions used:
TRIM()
CLEAN()
PROPER()
UPPER()
LOWER()
57. How Do You Remove Duplicates?
Answer:
Steps:
1. Select data
2. Data Tab
3. Remove Duplicates
Or use:
`=UNIQUE(A:A)`
(Excel 365)
58. What is Flash Fill?
Answer:
Flash Fill automatically detects patterns and fills data.
Example:
Input: John Smith
Desired output: J.Smith
Excel automatically learns the pattern.
Shortcut: Ctrl E
59. What are Named Ranges?
Answer:
Named Ranges assign names to cells or ranges.
Example:
Instead of: `=A1:A100`
Use: SalesData
Benefits:
✔ Better readability
✔ Easier formulas
60. Explain Text Functions in Excel.
Common functions:
LEFT()
RIGHT()
MID()
LEN()
TRIM()
CONCAT()
TEXT()
Example:
`=LEFT(A1,3)`
Returns first 3 characters.
61. What are Charts in Excel?
Answer:
Charts visually represent data.
Common charts:
✔ Bar Chart
✔ Line Chart
✔ Pie Chart
✔ Scatter Plot
✔ Histogram
62. How Do You Create Dynamic Dashboards?
Answer:
Use:
✔ Pivot Tables
✔ Pivot Charts
✔ Slicers
✔ Dynamic Named Ranges
✔ Power Query
This allows dashboards to update automatically.
63. What is Goal Seek?
Answer:
Goal Seek finds the required input value to achieve a desired result.
Example:
"What sales amount is needed to achieve ₹1,00,000 profit?"
64. What is Solver?
Answer:
Solver is an optimization tool.
Used to:
✔ Maximize profit
✔ Minimize cost
✔ Optimize resource allocation
Examples:
Budget planning
Production planning
65. Explain What-If Analysis.
Answer:
What-If Analysis evaluates different scenarios.
Tools include:
✔ Goal Seek
✔ Scenario Manager
✔ Data Tables
Example:
"What happens if sales increase by 20%?"
🔥 Most Important Excel Topics for Data Analyst Interviews
Recruiters frequently ask about:
✅ VLOOKUP / XLOOKUP
✅ INDEX MATCH
✅ Pivot Tables
✅ Conditional Formatting
✅ Power Query
✅ IFERROR
✅ SUMIF / SUMIFS
✅ Dashboards
✅ Data Cleaning
✅ Excel Shortcuts
💡 Interview Tip:
If you're interviewing for a Data Analyst role, be ready to explain how you've used Excel to clean data, build reports, create dashboards, and automate repetitive tasks. Real-world examples make your answers much stronger than simply defining concepts.
Double Tap ❤️ For Part-3🚀

3
4
26
2,543

May 22
✅ Strongly agree!
Moving to Excel Tables Structured References is one of the biggest game changers in Excel. Many people are still stuck in the usual reference (A1:B100), even though Tables make life much easier, neater, and anti-error.
Some things that I really like about Tables:
• Auto-expand → add data, all formulas, charts, pivots immediately update. No more forget to drag formula!
• Structured References → readable formula, example: =SUM(SalesData[Revenue]) is much clearer than =SUM(B2:B999)
• [@This Row] → the formula in the table column automatically uses only that row data (very powerful for calculation per row)
• Total Row (#Totals) Filter Slicer immediately turned on
Additional Pro Tip: If you often use Tables for dashboard or monthly report, immediately give a clear table name (not Table1, Table2). For example: Sales 2026, Database Employees, Inventory. Later IntelliSense will be very helpful.
Question for friends:
How many of you regularly use Excel Tables every day?
Or are you still using the regular range? Share in reply yes! 👇
2
191

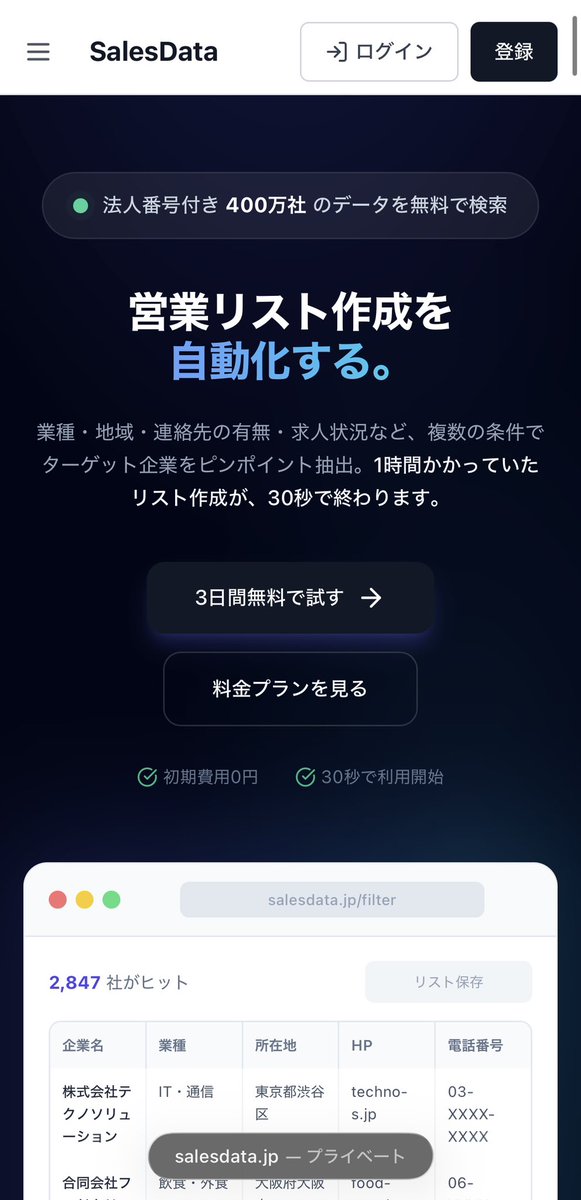
【サイトリニューアル&大幅アプデ】
弊社の営業リスト作成ツール
「SalesData」の公式サイトが
新しくなりました!✨
「今、アタックすべき企業」
が瞬時にわかる!
圧倒的なデータ量と、
成約に繋がる鮮度を両立しました!
【SalesDataでできること 】
✅10以上の求人媒体をAIが
24時間監視(リアルタイム抽出)
✅PRTIMESの記事から
最新の企業動向をリサーチ
✅詳細フィルターで
「刺さる」アタックリストを作成
✅CSV出力対応&データは見放題
【主なアップデート 】
✅ フィルター項目追加で
さらに細かな条件設定
✅ PRTIMESリストの追加
✅ 法人プラン(複数人利用)&
新プラン(CSV4,000件)追加
✅ 新規HP・電話番号データの拡充
個人でも導入できる
圧倒的低価格を実現しています!
まずは30日間の無料トライアルで、
効果を実感してみてください!
ご興味がある方は個別相談も承ります👇
salesdata.jp/lp/

6
4
81
2,458

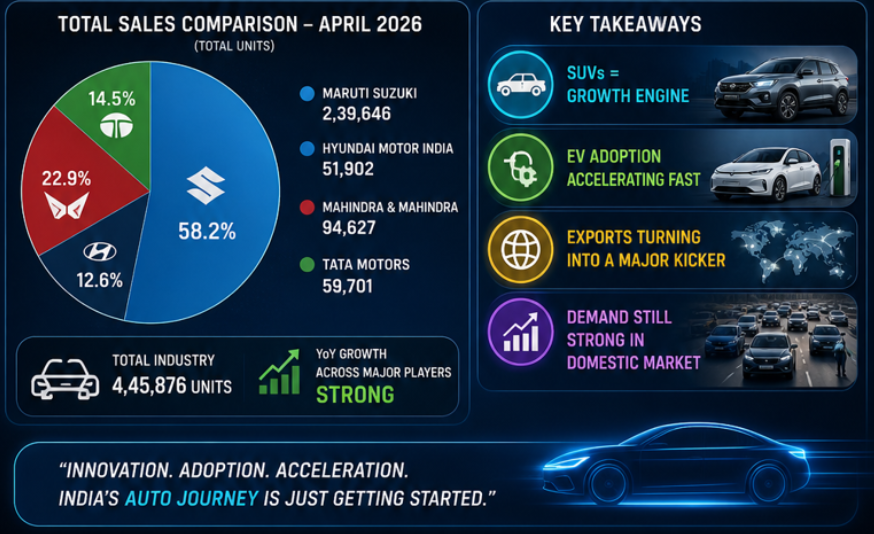
Key Highlights :-
✔ SUVs = Growth engine
✔ EV adoption accelerating fast
✔ Exports turning into a major kicker 🌍
✔ Demand still STRONG in domestic market
📈India Auto Sector = Full Throttle Mode
🔁Repost | ♥️Like | 🔖 Bookmark
Follow @n_stox For More Insights 🚨
#AutoSector #StockMarketIndia #EV #ElectricVehicle #Salesdata #April2026
1
5
196

先月リリース開始したSalesDataですが、沢山のモニター様のご協力もあり、
大きく進化しています!!
やはり各現場でのリアルな声は
非常に参考になりますね。
ただ時短出来る。
データ量の確保が出来る。
だけのツールでは意味がなく、
実際に成果に繋がるツールに
確実になってきています。
実際にご利用いただき、
更に沢山のご意見お待ちしております!
リスト作成にお悩みの方は👇
salesdata.jp/

ついに!!!
『営業リスト作成を自動化する』
SalesDataリリース開始です!
僕自身の経験から、
こんなツールがあったら
仕事の効率・生産性が上がるな
お客様と本気で向き合える架け橋になるな
そんな想いから
このSalesDataを作り上げました。
この最高のツールを
沢山の方にご利用いただき、
効果を実感して欲しいと思います!
【SalesData の特徴】
• 多条件のフィルター検索:
自分が集めたい条件で、
瞬時にリストアップ。作成時間を大幅短縮。
• 圧倒的な企業データ量:
個人が手動で集められるレベルを
遥かに凌駕するデータベース。
• 求人情報の24時間AI監視:
6媒体をAIが常時監視。
ターゲット企業の最新情報が手に入る。
※媒体数は順次拡大
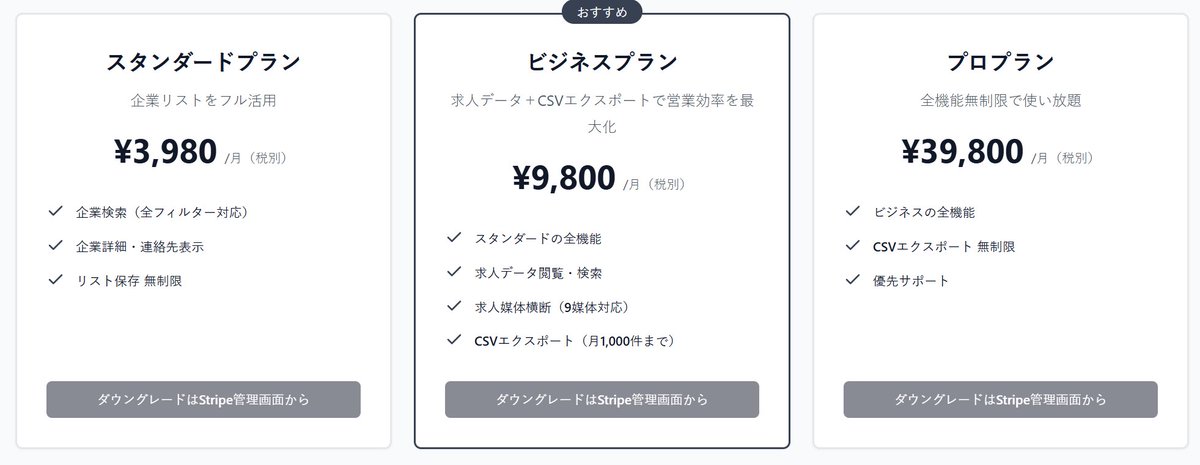
【料金プラン(リリース記念価格)】
■ 3日間:完全無料トライアル付き
■ スターター:初月980円
(※先着100名限定)
■ スタンダード:3,980円 /月
■ プロ:9,800円 /月
スターター登録で、初月のみ【プロ機能(月9,800円相当)】を全開放。
まずは3日間無料で使い倒してみて欲しい。
もし「これ使えねえな…」と思ったら、
トライアル期間内にいつでも解約可能!
【こちらのURLから登録】
salesdata.jp/
このツールで、
日本の営業の生産性を底上げします。
みなさんぜひ「リポスト・拡散」
よろしくお願いいたします🙇♂️

1
1
22
575

Renault just posted 77% YoY growth in March…
📊 Total: 5,046 units ( 77% YoY, 44% MoM)
✅ Triber: 2,011 ( 30% YoY) - Still the backbone
✅ Kiger: 1,184 ( 55% YoY, 69% MoM) - Strong comeback
🆕 Duster: 1,402 - Dispatches begin, real test ahead
⚠️ Kwid: 449 (–16% YoY) - Entry segment weakening
It’s still being carried by Kiger Triber (63% share)
Duster has entered but hasn’t proven itself yet.
The Reality Check:
👉 77% growth = low base effect
👉 5K/month = still small scale
👉 Kwid decline = pressure at entry level
What to watch next:
• Can Duster sustain 5K monthly?
#RenaultIndia #AutoSales #CarSales #IndianAuto #AutoIndustry #Duster #Kiger #Triber #Kwid #AutoAnalysis #SalesData #OEMInsights

3
1
15
1,344

Apr 6
#NewsAlert | FADA data shows strong momentum in FY26 auto retail sales with double-digit growth across segments, while March delivers a sharp surge led by two-wheelers and passenger vehicles
#FADA #SalesData

1
7
1,321
『SalesData』
求人情報もリリース当初よりも、
更に見やすくアップデートしています✨
情報も常に更新中!!
ついに!!!
『営業リスト作成を自動化する』
SalesDataリリース開始です!
僕自身の経験から、
こんなツールがあったら
仕事の効率・生産性が上がるな
お客様と本気で向き合える架け橋になるな
そんな想いから
このSalesDataを作り上げました。
この最高のツールを
沢山の方にご利用いただき、
効果を実感して欲しいと思います!
【SalesData の特徴】
• 多条件のフィルター検索:
自分が集めたい条件で、
瞬時にリストアップ。作成時間を大幅短縮。
• 圧倒的な企業データ量:
個人が手動で集められるレベルを
遥かに凌駕するデータベース。
• 求人情報の24時間AI監視:
6媒体をAIが常時監視。
ターゲット企業の最新情報が手に入る。
※媒体数は順次拡大
【料金プラン(リリース記念価格)】
■ 3日間:完全無料トライアル付き
■ スターター:初月980円
(※先着100名限定)
■ スタンダード:3,980円 /月
■ プロ:9,800円 /月
スターター登録で、初月のみ【プロ機能(月9,800円相当)】を全開放。
まずは3日間無料で使い倒してみて欲しい。
もし「これ使えねえな…」と思ったら、
トライアル期間内にいつでも解約可能!
【こちらのURLから登録】
salesdata.jp/
このツールで、
日本の営業の生産性を底上げします。
みなさんぜひ「リポスト・拡散」
よろしくお願いいたします🙇♂️
1
6
323
リリース開始からSalesDataを
複数の方にご利用いただき、
お話しする機会が増えています!
皆さんこれは活用できそう!
と仰っていただきとても嬉しく思います。
ただ、情報の精度・鮮度共に更にアップデートしていきたいので、モニター様募集枠を拡大します!
営業リスト作成効率化にご興味お持ちの方は、お気軽にご連絡ください😊
ついに!!!
『営業リスト作成を自動化する』
SalesDataリリース開始です!
僕自身の経験から、
こんなツールがあったら
仕事の効率・生産性が上がるな
お客様と本気で向き合える架け橋になるな
そんな想いから
このSalesDataを作り上げました。
この最高のツールを
沢山の方にご利用いただき、
効果を実感して欲しいと思います!
【SalesData の特徴】
• 多条件のフィルター検索:
自分が集めたい条件で、
瞬時にリストアップ。作成時間を大幅短縮。
• 圧倒的な企業データ量:
個人が手動で集められるレベルを
遥かに凌駕するデータベース。
• 求人情報の24時間AI監視:
6媒体をAIが常時監視。
ターゲット企業の最新情報が手に入る。
※媒体数は順次拡大
【料金プラン(リリース記念価格)】
■ 3日間:完全無料トライアル付き
■ スターター:初月980円
(※先着100名限定)
■ スタンダード:3,980円 /月
■ プロ:9,800円 /月
スターター登録で、初月のみ【プロ機能(月9,800円相当)】を全開放。
まずは3日間無料で使い倒してみて欲しい。
もし「これ使えねえな…」と思ったら、
トライアル期間内にいつでも解約可能!
【こちらのURLから登録】
salesdata.jp/
このツールで、
日本の営業の生産性を底上げします。
みなさんぜひ「リポスト・拡散」
よろしくお願いいたします🙇♂️
1
5
324
『SalesData』
実際のリスト作成画面と
求人情報ページを一部お見せします!
【企業データ】
詳細なフィルターからターゲット企業の情報を瞬時に収集。閲覧からリスト化まで一貫して行えます。
【求人情報】
企業情報に加え、10媒体(順次拡大中)の求人サイト掲載リンクや、雇用形態・最低年収などのフィルター機能まで搭載。
【最新システム】
さらに24時間監視システム付きで、
常に最新情報を追加するシステム。
リスト作成の手間を省きたい方や、濃いデータをお求めの方は、3日間の無料トライアルもあるので、以下のURLよりお試しください!
[URL]
salesdata.jp/
1
1
10
452
最近有難い事に、SalesDataのデモを通じてたくさんの方とお話しする機会が増えています。
皆様にお褒めのお言葉をたくさんいただけるようになり、開発者冥利に尽きる毎日です!
しかし、SalesDataは「ただのリスト作成ツール」という立ち位置ではなく、皆様の事業を加速させる「最強の相棒」としてサービス展開を考えおります。
そのためにも、実際に皆様の現場でのリアルなお悩みをお聞きしたい。
・他ツールを使ってるけどコストが高い…
・AI使ってるけど中々上手くいかない…
・もっと成約に繋がる濃いデータが欲しい…
そんな悩みをお持ちの方と、直接画面を見ながらお話しさせていただきたいです!
少しでもご興味お持ちの方は、
ぜひお気軽にDMでご連絡ください!

1
10
258
営業リスト作成を効率化しない理由がない
・商談時間の最大化
・データの最新化
・ターゲットの細分化
・属人化の解消
・精神的余裕
でもこれ、ただAIを活用するだけじゃ
限界があります。
上手くスクレイピングできない…
結局プロンプト生成で時間かかる…
僕自身もAIと
毎日睨めっこしてるからこそ、
この悩みは痛いほど分かります。
だからこそ、試行錯誤を繰り返し、
お客様の声を取り入れてアップデート
し続ける最高のツールとして
SalesDataを開発しました。
1
1
18
354
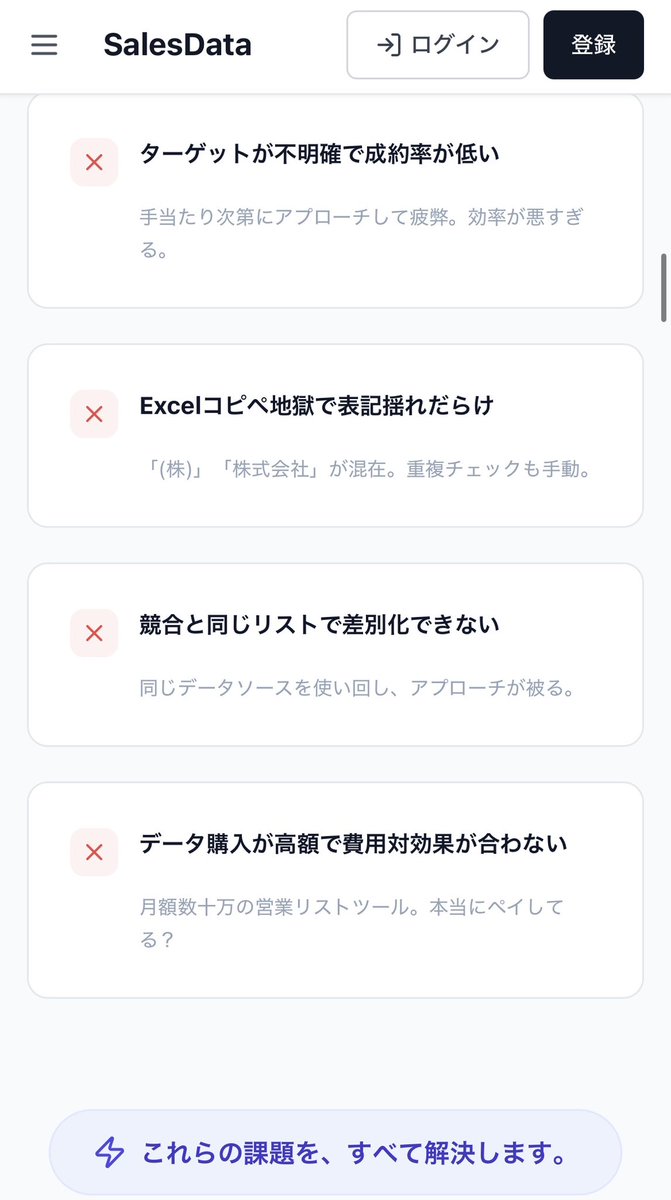
こんなお悩みを抱えている方は、
ぜひ一度使ってみて欲しい!
ありがたいことに、想像以上にお問い合わせをいただいておりますので、無料モニター枠を拡大中です!
『SalesData』
モニター希望の方はお早めにDMまで📩

ついに!!!
『営業リスト作成を自動化する』
SalesDataリリース開始です!
僕自身の経験から、
こんなツールがあったら
仕事の効率・生産性が上がるな
お客様と本気で向き合える架け橋になるな
そんな想いから
このSalesDataを作り上げました。
この最高のツールを
沢山の方にご利用いただき、
効果を実感して欲しいと思います!
【SalesData の特徴】
• 多条件のフィルター検索:
自分が集めたい条件で、
瞬時にリストアップ。作成時間を大幅短縮。
• 圧倒的な企業データ量:
個人が手動で集められるレベルを
遥かに凌駕するデータベース。
• 求人情報の24時間AI監視:
6媒体をAIが常時監視。
ターゲット企業の最新情報が手に入る。
※媒体数は順次拡大
【料金プラン(リリース記念価格)】
■ 3日間:完全無料トライアル付き
■ スターター:初月980円
(※先着100名限定)
■ スタンダード:3,980円 /月
■ プロ:9,800円 /月
スターター登録で、初月のみ【プロ機能(月9,800円相当)】を全開放。
まずは3日間無料で使い倒してみて欲しい。
もし「これ使えねえな…」と思ったら、
トライアル期間内にいつでも解約可能!
【こちらのURLから登録】
salesdata.jp/
このツールで、
日本の営業の生産性を底上げします。
みなさんぜひ「リポスト・拡散」
よろしくお願いいたします🙇♂️
1
12
410
ツールを導入して失敗したくない。
その気持ちめっちゃ分かる。
弊社の『SalesData』は、
実際に効果を感じて頂いてから本契約に
移行する3日間無料トライアル付き
もし使えねえなと思ったら即解約OK
常にお客様が満足するサービスを届けたい
ついに!!!
『営業リスト作成を自動化する』
SalesDataリリース開始です!
僕自身の経験から、
こんなツールがあったら
仕事の効率・生産性が上がるな
お客様と本気で向き合える架け橋になるな
そんな想いから
このSalesDataを作り上げました。
この最高のツールを
沢山の方にご利用いただき、
効果を実感して欲しいと思います!
【SalesData の特徴】
• 多条件のフィルター検索:
自分が集めたい条件で、
瞬時にリストアップ。作成時間を大幅短縮。
• 圧倒的な企業データ量:
個人が手動で集められるレベルを
遥かに凌駕するデータベース。
• 求人情報の24時間AI監視:
6媒体をAIが常時監視。
ターゲット企業の最新情報が手に入る。
※媒体数は順次拡大
【料金プラン(リリース記念価格)】
■ 3日間:完全無料トライアル付き
■ スターター:初月980円
(※先着100名限定)
■ スタンダード:3,980円 /月
■ プロ:9,800円 /月
スターター登録で、初月のみ【プロ機能(月9,800円相当)】を全開放。
まずは3日間無料で使い倒してみて欲しい。
もし「これ使えねえな…」と思ったら、
トライアル期間内にいつでも解約可能!
【こちらのURLから登録】
salesdata.jp/
このツールで、
日本の営業の生産性を底上げします。
みなさんぜひ「リポスト・拡散」
よろしくお願いいたします🙇♂️
1
1
10
262
SalesData ビジネスプラン
引き続き無料モニター募集中です!
通常月額9,800円のビジネスプランを
『1ヶ月間、完全無料』でご提供!
■ お願いしたい事
・実際に使用しての「改善点・追加機能」のフィードバック
・使ってみた率直な感想をXにてご紹介
■ こんな方に使ってほしい
・営業活動を効率化し成約率を上げたい方
・大手ツールは高いが、プロ級のデータが欲しい方
■ 応募方法
DMにて
『モニター希望』とお送りください!
👇実際のリスト作成手順はこちら
ついに!!!
『営業リスト作成を自動化する』
SalesDataリリース開始です!
僕自身の経験から、
こんなツールがあったら
仕事の効率・生産性が上がるな
お客様と本気で向き合える架け橋になるな
そんな想いから
このSalesDataを作り上げました。
この最高のツールを
沢山の方にご利用いただき、
効果を実感して欲しいと思います!
【SalesData の特徴】
• 多条件のフィルター検索:
自分が集めたい条件で、
瞬時にリストアップ。作成時間を大幅短縮。
• 圧倒的な企業データ量:
個人が手動で集められるレベルを
遥かに凌駕するデータベース。
• 求人情報の24時間AI監視:
6媒体をAIが常時監視。
ターゲット企業の最新情報が手に入る。
※媒体数は順次拡大
【料金プラン(リリース記念価格)】
■ 3日間:完全無料トライアル付き
■ スターター:初月980円
(※先着100名限定)
■ スタンダード:3,980円 /月
■ プロ:9,800円 /月
スターター登録で、初月のみ【プロ機能(月9,800円相当)】を全開放。
まずは3日間無料で使い倒してみて欲しい。
もし「これ使えねえな…」と思ったら、
トライアル期間内にいつでも解約可能!
【こちらのURLから登録】
salesdata.jp/
このツールで、
日本の営業の生産性を底上げします。
みなさんぜひ「リポスト・拡散」
よろしくお願いいたします🙇♂️
1
10
295