
May 28
Evil empire strikes again. Didn’t Microsoft eliminate most of their white and black box testers about 10-15 years ago and relied exclusively on their SDEVs to write automated unit tests for their code?
1
2
28

Apr 23
ahh.. they looked a bit too humble by normal twitter standards of self-reporting
i'd vibe my sdevs at 2.73, 1.0000001^e, 4 /- 1
4
83

Mar 5
Think of SDEVs as a means to gauge how extended the current price is relative to that time based range, in addition to where price could potentially go without become over extended. They are a map of historical distribution. You will need to figure out the best way to apply this to your trading, Perhaps just start by focusing on one, I would recommend the H4 if you are trading the full AM session, or the H1 if you are only trading a specific hour.
2
3
112

24 Oct 2025
Got asked a few times why I wasn't at the top of the fellowship.
Look, I've got Ws coming that people are expecting me to win. But my body hasn't been supporting me since sdevs started. Was basically gone from my dev journey for weeks. Wasn't well through the entire @AthenaF0SS Hacker House, @SuperteamIN Popup, and APEX tour but didn't let anyone know. Just showed up with full energy, being who Priyansh is.
Can't win that frequently when your body's not cooperating. But I promise you'll see "Priyansh is everywhere" on your TL again.
Genuinely happy for everyone who won @kirat_tw's Superdevs. I know almost all of you and every single person deserves it. More Ws in the chat.
And if this was your first crypto money? Gift something to your mum and dad. Let them see what you're building.
9
46
2,147
8 Sep 2025
Doing the assignment but not the sdevs one. Pinocchio research one
4
60

27 Jul 2025
Using Price action levels, candle patterns, TPO and SDEVs to frame a mean reversion or trend continuation. DOM and Bookmap for entry confluence. I also categorise my entry setups by order type
1
2
180

26 Jun 2025
😱Well would you look at that.... $NQ SDEVS for the win again
🎉 Oversold, green buy signal, exit at 1.5sdev(orange) as this is daily resistance
🥶 Indicator in bio. 🏃🏽
4
26
2,726
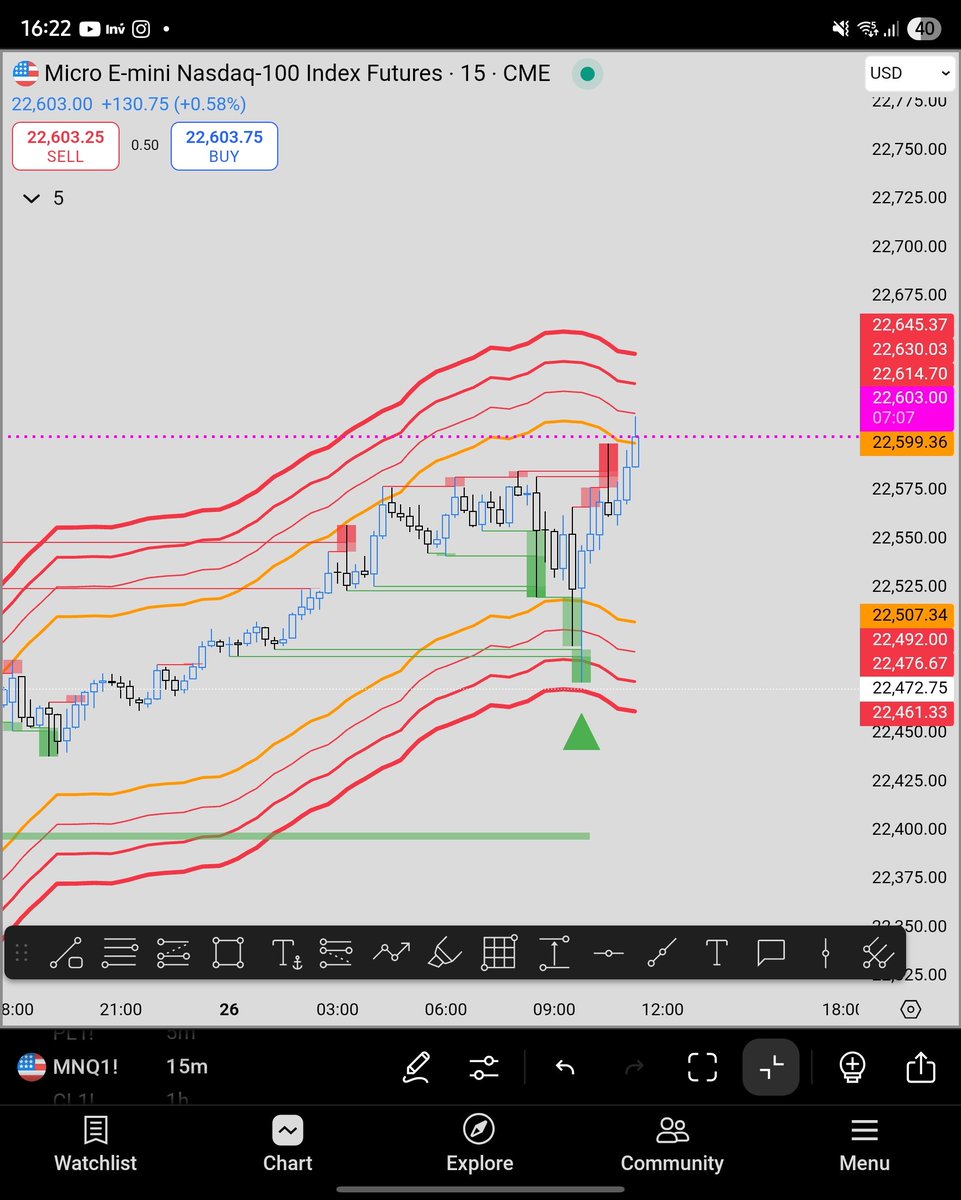
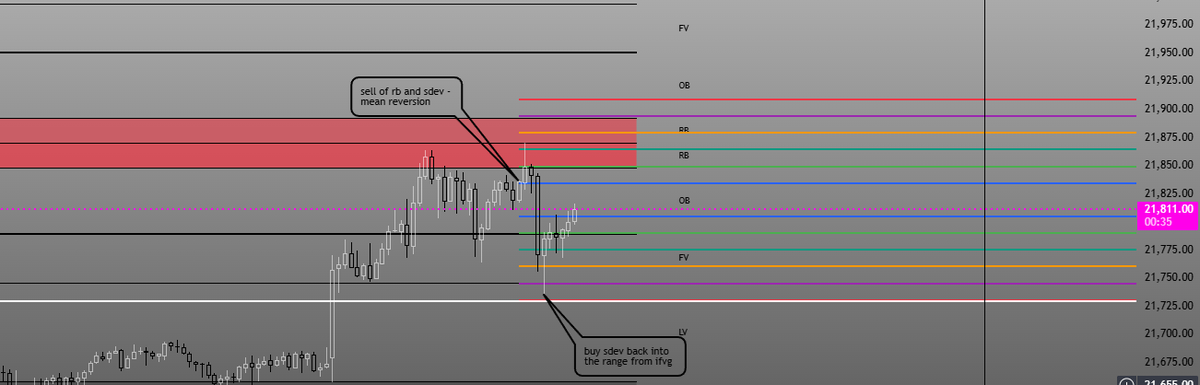
6 Jun 2025
Scalping using the 1H SDEVS bands.
5m was overextended at the RB = Sell
price filled bullish ifvg again overextended and back into the range=buy
@ProbableChris @NQStats
1
6
1,057
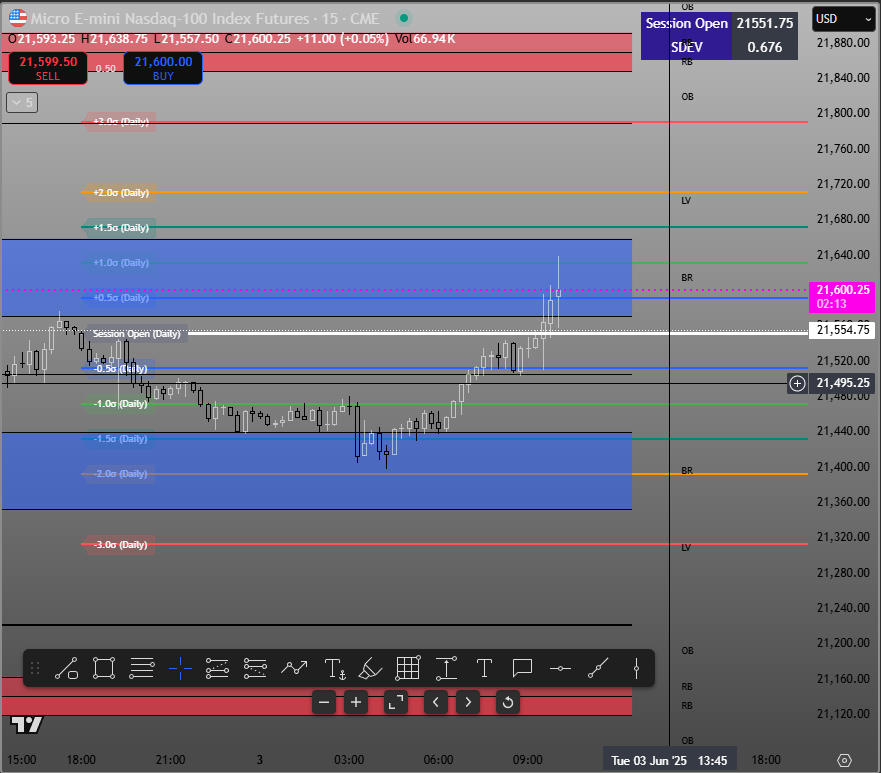
3 Jun 2025
Great day trading SDEVS and GB confluence
Caught NQ bottom when price hovered around the 2sdev in conj with the daily manipulation level, session manipulation, &#GoldBach breaker.
Took profit at 0.5sdev, re-entered on the 2nd push to 1sdev TP/Breaker
@hopiplaka @ProbableChris

1
2
8
2,006

3 Jun 2025
My best free indis :)
Daily, Weekly, Monthly Sdevs:
- tradingview.com/script/BHIyq…
Daily, Weekly, Monthly Average Highs and Lows:
- tradingview.com/script/xN7M0…
Daily Sdevs (expanded):
- tradingview.com/script/z7qNQ…
More free indicators to come!
For more info look at indicators description.
1
3
46
4,474
2 Jun 2025
Hi Chris, i created an indicator based of this concept but ive used dynamic SDEVS that recalculate for every new bar using a rolling window - last 252 bars to adapt to current volatility but i also have the option to hardcode the 10 years of data.
Thanks for providing
1
1
3
476
31 May 2025
The open is the mean. The SDEVs are thr variance values that you draw away from the mean. You can do it via code or via horizontal manually drawn lines.
2
85
31 May 2025
The SDEVs calculation is based on 20 years of daily candle data that Chris provided. Since Tradingview has a limited lookback, the indicator uses the calculation derived from the data as opposed to using the actual chart history.
1
3
107
30 May 2025
Just DM me i guess haha.
Its just focused on the Daily SDEVs atm - i am working on more timeframes based on the info NQ Stats provided today.
1
3
114
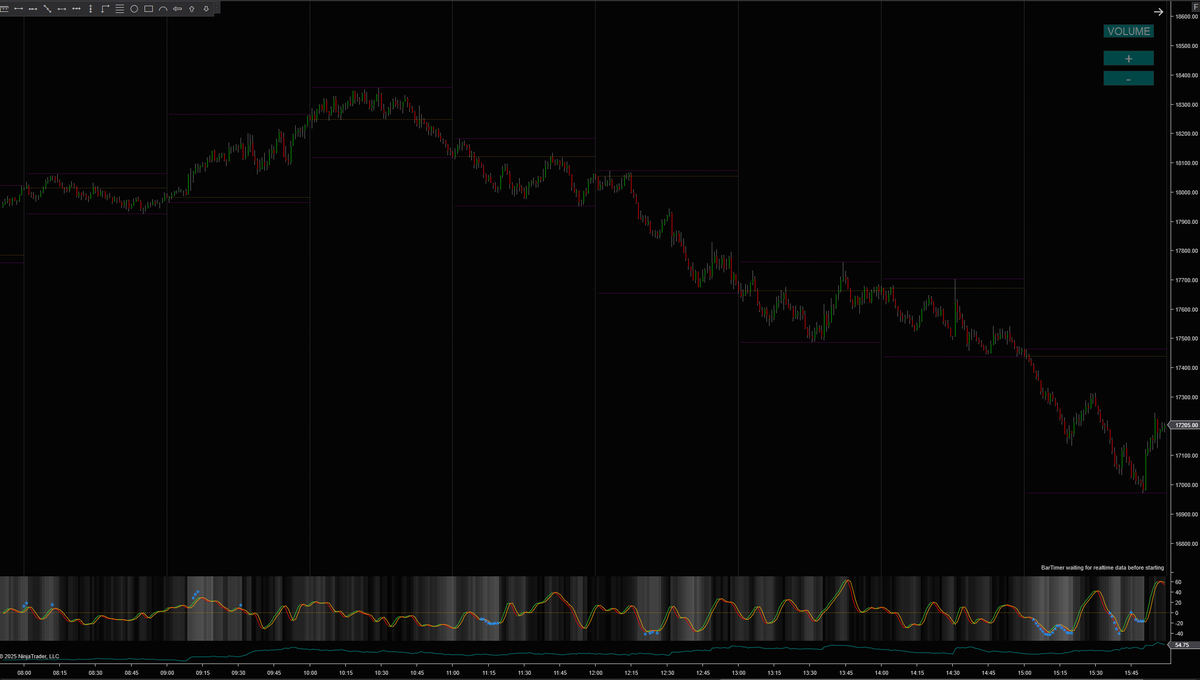
30 May 2025
A note to those that are trying to replicate the Net Change SDEVs within Trading View, specifically the 1H SDEVs.
I use Ninja Trader, which does not have the same historical bar loading limitations that TradingView has. Even with TradingViews highest tier, the "Ultimate" tier that costs $200/mo, this is limited to 40k historical bars. The Plus and Premium plans have about half that historical bar limit. Sounds like a lot but lets look at it...
1H chart on Ultimate Plan = ~1,740 trading days (~7yrs)
1H chart on Plus/Premium Plan = ~3.5yrs
I use a flat 10yrs of data for the 4H and 1H SDEVs. So if you are on TradingView, you will certainly have some variance in the output. If you want the full 10yrs of data, I have pulled it and placed the raw data and times in the link below. From there you could derive the sdev values and hardcode your values into an indicator, if following the logic on my website on how to do this in excel. This would need to be updated maybe 1-2 times a year as variance changes over that large sample.
docs.google.com/spreadsheets…
11
2
81
6,947

20 May 2025
4/8 was a 2.5 to -2.5 daily distribution day. Watch my video on Net Change SDEVs and pay attention to the points about trend day or outlier day anticipation. Data vs price did not support a ALN trade nor Noon Curve trade. Additionally for hour stat sweep, there was not a single hour that provided a first segment sweep that gave enough tradeable range back to the open to make a trade. The hours were essentially opening directly at the prior hours high or low.
1
197