
Beauty and Terror
Joined October 2020
- Tweets 7,676
- Following 1,039
- Followers 1,352
- Likes 45,089
334 Photos and videos


Pinned Tweet

25 Aug 2025
**Free indicator** -> " L I N E S "
Tradingview Link: tradingview.com/script/iRk5v…
2
9
93
11,575

youtu.be/pxs2MuqvH3w
New vid for the new site on "Price Distributions". "Price Distributions" is a statistical framework I use to tell what regime we are in, what my bias should be (trend vs mean reversion), and when to time my entries. It uses percent net change from open to close of various time windows to calculate samples and derive data from said sample.
6
6
49
5,602
ᴰᵃᵛᵉˡᵈᵗ retweeted

Jun 7
The Week-1 Tell: How Index Futures (#NQ_F #ES_F Behave Around the Prior Month’s High and Low
Why monthly highs and lows matter
The previous month’s high (PMH) and low (PML) are among the most-watched higher-timeframe levels in the index-futures complex. A plausible reason — consistent with, though not proven by, this data — is that money is managed on a monthly cycle: funds report exposure, P&L, and risk monthly, so stops, trailing logic, and month-end rebalancing tend to concentrate around last month’s extremes. Whatever the cause, price interacts with these two levels — sweeps them, reverses off them, returns to them — with enough regularity that the behavior is measurable. That’s what this study measures.
The question this study answers is practical: given only what you know by the end of the first week, what are the odds the month closes green — and that it returns to last month’s high before it’s over?
We pulled twelve years of full-session futures data and tested every common claim about monthly behavior. Several popular ones collapsed under the data. A few quiet ones turned out to be the strongest signals we found. Here’s all of it.
The baseline (read this first)
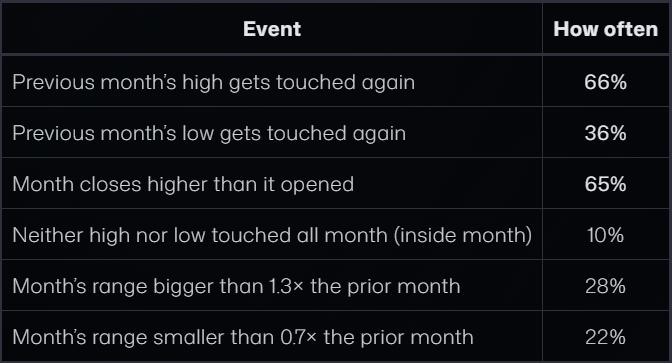
Before any conditions, across all 587 months, these are the raw frequencies. Every number later in this article should be measured against them — a “75% setup” only matters if the baseline is 60%.
The headline here: the prior high gets retested nearly twice as often as the prior low (66% vs 36%). In a market that grinds upward over twelve years, last month’s high is roughly double the magnet last month’s low is. Keep that asymmetry in mind throughout.
1
3
6
396
ᴰᵃᵛᵉˡᵈᵗ retweeted

Apr 29
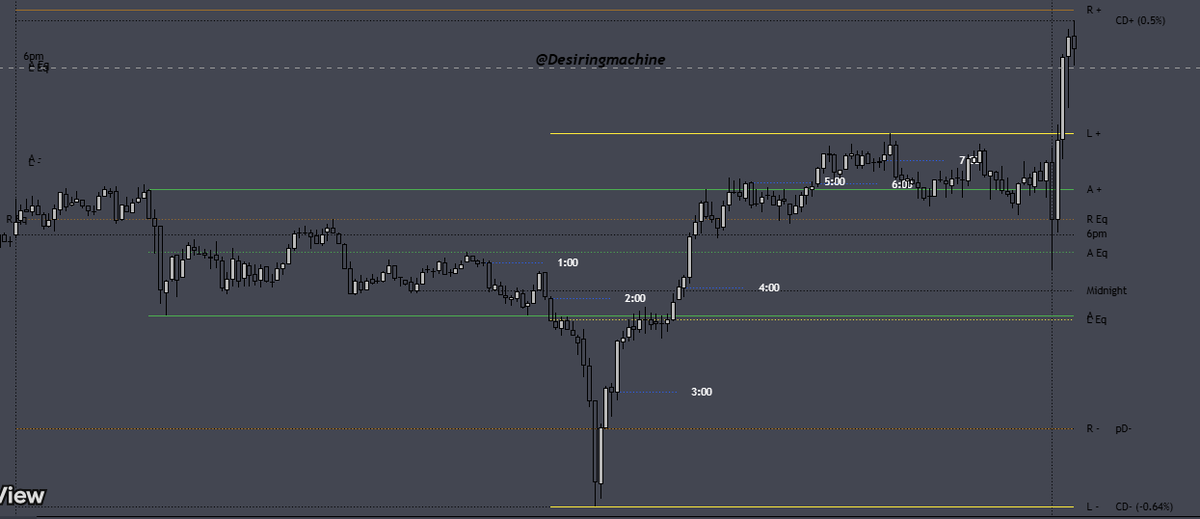
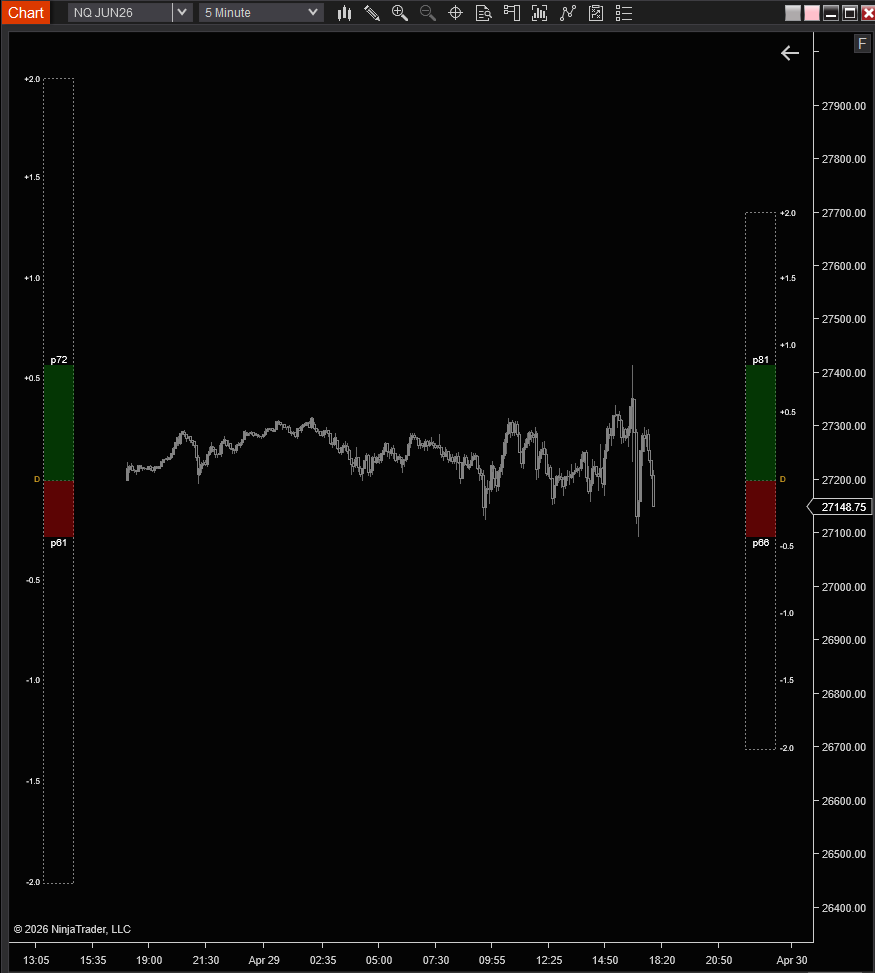
5yr session distribution on the left, 20-day session distribution on the right, current session in the middle. 20-day is compressed relative to the 5yr. What does this mean?
This means recent volatility is below the long-term baseline. The market has been quieter than usual over the last month, despite the uptrend to new all time high. Currently in a compression / consolidation regime in terms of vol. Range bound tape, lower ATR, tighter daily ranges, etc.
Compressed vol historically resolves into vol expansion, and often violently. The trend continues until it doesn't, and when the regime breaks, you get sharp moves that blow through the narrow rolling bands. That's the "vol of vol" risk. Expecting outlier days here soon, don't let it catch you off guard when it happens.
7
4
62
4,479
ᴰᵃᵛᵉˡᵈᵗ retweeted

Apr 9
Thread by @Mc5calpAfee on Thread Reader App threadreaderapp.com/thread/2…
4
13
83
14,343
ᴰᵃᵛᵉˡᵈᵗ retweeted
Feb 22
I put together the following example strategy simply to demonstrate how a few straightforward requirements built around a statistical edge can be used to form a strategy.
probablechris.com/a-baseline…
7
12
173
16,806
ᴰᵃᵛᵉˡᵈᵗ retweeted

Feb 15
These rules are what give me bulletproof trading psychology & consistency.
I use logic instead of discipline cause bro nobody got time for that

1
3
31
2,522
ᴰᵃᵛᵉˡᵈᵗ retweeted

5
31
331
71,553
ᴰᵃᵛᵉˡᵈᵗ retweeted
Jan 12
We will be LIVE TRADING with @ForexIke as our guest trader today. We will live trade, talk about his journey / how he came to trade the way he does, and any questions you all have for him drop them in the live chat!
If we get 150 live viewers I will give away $80 live on stream. All you gotta do is:
- like / retweet this tweet
- join in on the stream and listen for your X usernmae to be announced. If you aren't on stream we will just move onto the next random winner until someone claims it
Tune in here: youtube.com/watch?v=NGB-s2hW…

1
21
31
3,136
ᴰᵃᵛᵉˡᵈᵗ retweeted
Jan 4
If you’re going into 2026 telling yourself, “This is my year—this is when I turn my trading around,” here are a few things you should consider.
⸻
1. Shift Goals
-Remove PnL goals and replace them with process-driven goals. Instead of “I want to make $500 this week”, change the goal to “I want to take three trades this week that fully follow my process.”
This shift helps you build the mindset and habits needed for long-term success.
⸻
2. Simplify Things
-If you’re trading multiple concepts across multiple assets and you’re not consistently profitable, reduce your process to one concept or strategy on one asset. If you can’t turn a profit with one strategy on one asset, adding more complexity isn’t going to fix the problem.
⸻
3. Build Emotional Control
-The bulk of traders struggle or fail not due to a lack of edge, but due to a lack of self-control. Create an emotional trigger plan. In this plan, assign a specific action to each emotion you struggle with. This will require time, reflection, and self-awareness.
If you struggle with FOMO, maybe you step away for 10 minutes when you feel it coming on. If you’re mid-trade and starting to feel doubt, perhaps you cut half your position so risk is reduced and the fear of loss subsides.
Whatever emotional factors you struggle with, create a plan for each.
⸻
4. Backtest Any Changes
-If you make a change to your process, backtest it. A backtest is a free way to see if something is viable. For example, if you modify how you manage your stop loss, backtest it over a few dozen trades to at least determine whether the change is worth implementing. If the change makes your trading worse in backtesting, it will likely be worse live.
⸻
5. Adjust Risk
-If you’re blowing accounts in a single trade, single day, or even a single week, you’re risking too much—or trading too much (which is still risking too much). Start by cutting your risk in half and observe the difference it makes in both your mindset and your trading.
Restrict yourself to two trades per leg of movement. This allows you to be wrong and try again. After the second loss, however, your read may simply be off. Let price work through whatever range it’s in and form a new pivot, creating a new leg of movement. You’re now in a different scenario instead of chasing the same move.
⸻
6. Map Out Your Process
-Write out your entire process or strategy: entry criteria, entry triggers, emotional trigger plan, risk management, trade management, and everything from opening a trade to closing it. If you can’t quantify your process this way, you’re not trading—you’re gambling.
A defined process means you’re applying logic, not rolling the dice. A defined process is repeatable, and performance can be tracked. An undefined process means every trade operates under a different set of rules.
This defined process is the law. You follow it no matter what. That’s how consistency is built. Whether that consistency leads to losses or wins depends on your edge—but you’ll never know if your process is good or bad unless you can execute it the same way every time.
⸻
Some of these points may seem obvious or even juvenile, but they are foundational principles that can make all the difference—and they are what separate a successful trader from a losing one. Feel free to ask questions below snd good luck.
9
32
186
12,009


10 Dec 2025
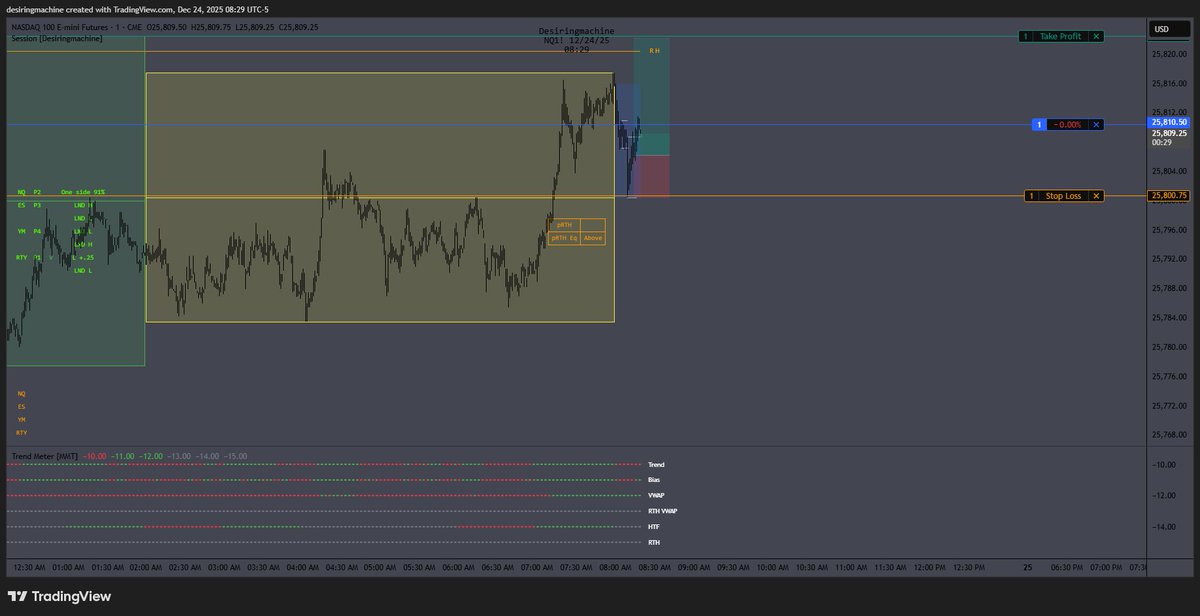
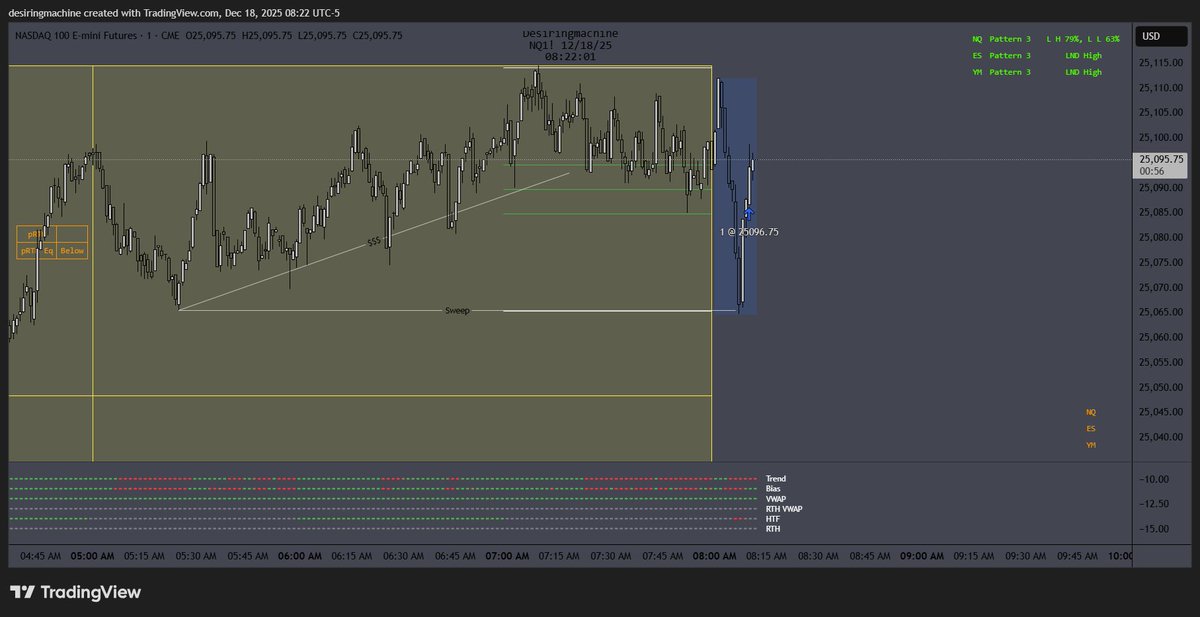
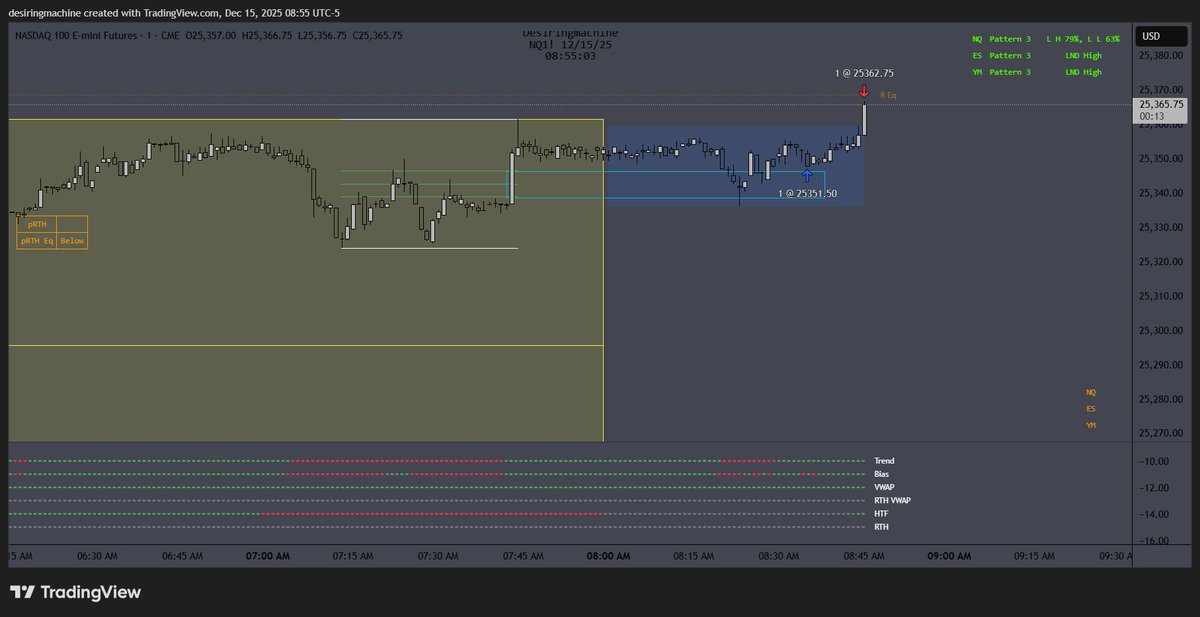
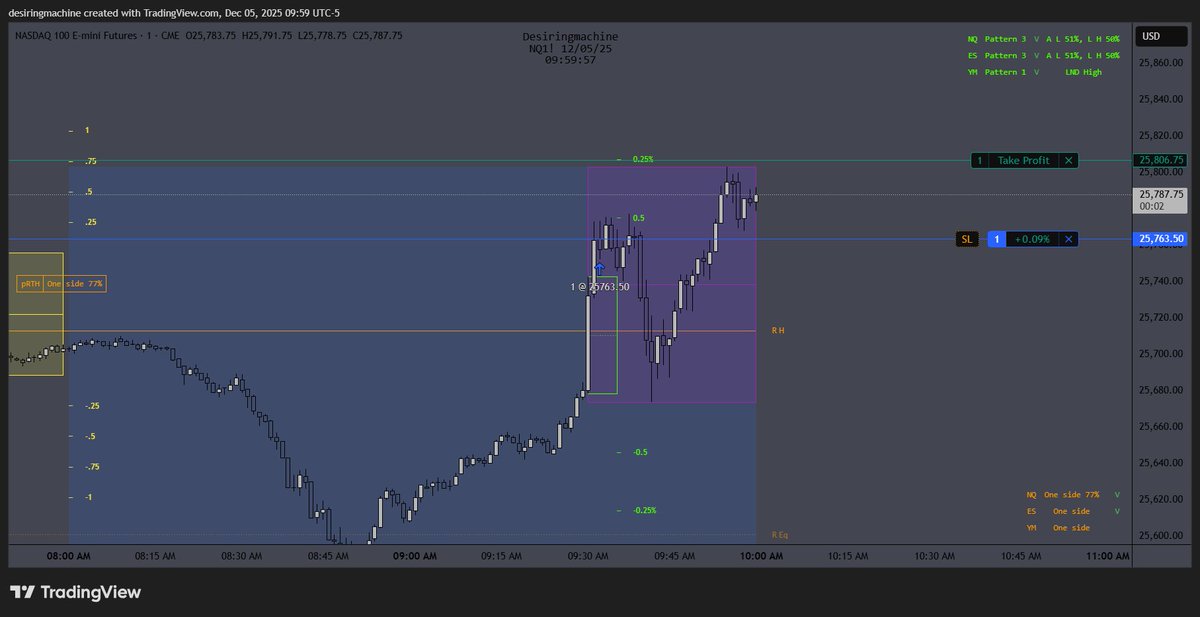
**New features**
Session [Desiringmachine]
tradingview.com/script/gpmT7…
"Session" Indicator Guide:
tr.ee/Fr95ZxGQ4u
tradingview.com/script/gpmT7…
3
5
37
4,861
6 Dec 2025
RT @Matthewwmickey1: We don't predict the market we predict our losses and trade live price with the highest probabilities.
@AC_Trades htt…
10
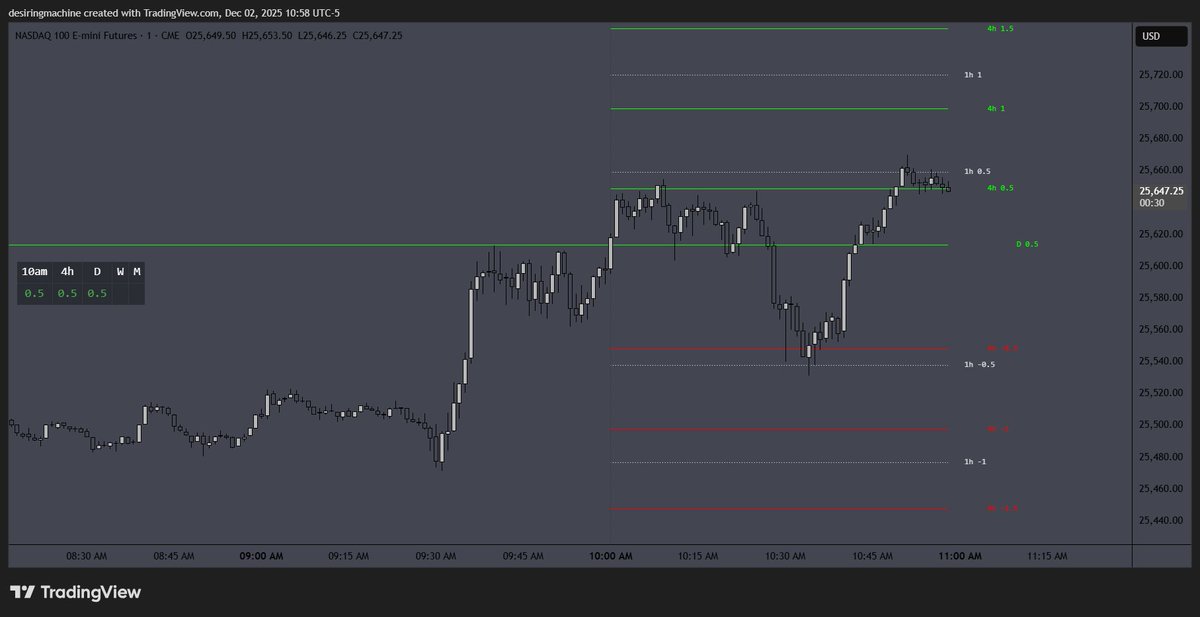
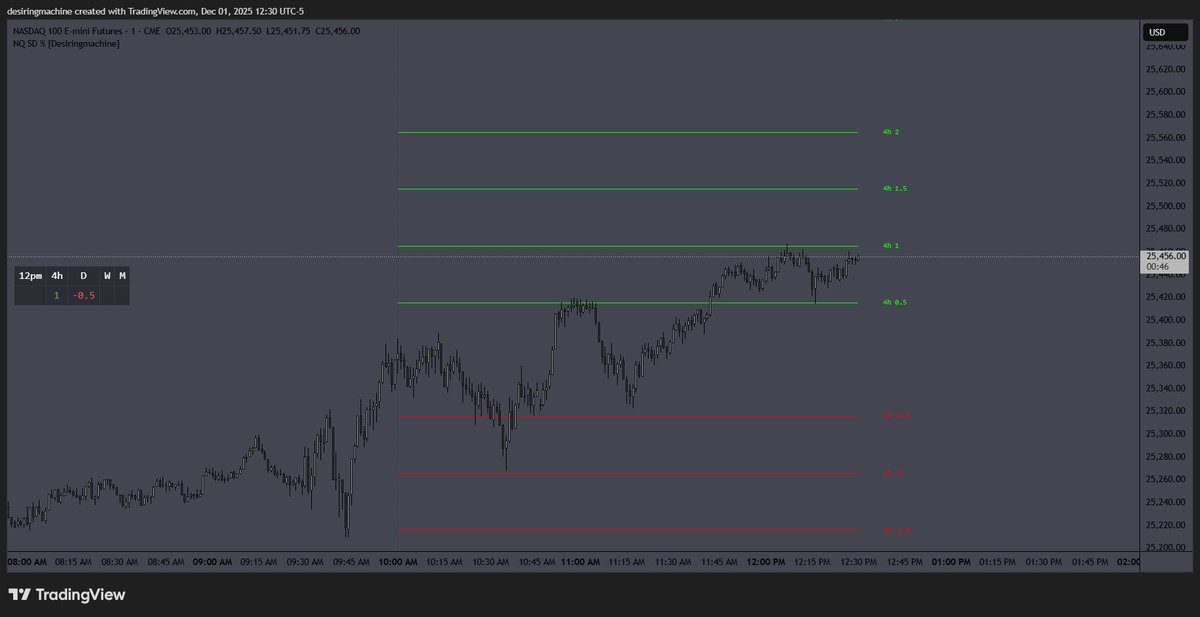
3 Dec 2025
SD ထ [Desiringmachine]
All the tickers you want -> Standard Deviations.
- Custom Lookback.
- Calculation every hour and every 4 hours performed individually.
Feedback are welcome.
Link:
tradingview.com/script/xfDBL…
1
41
3,723
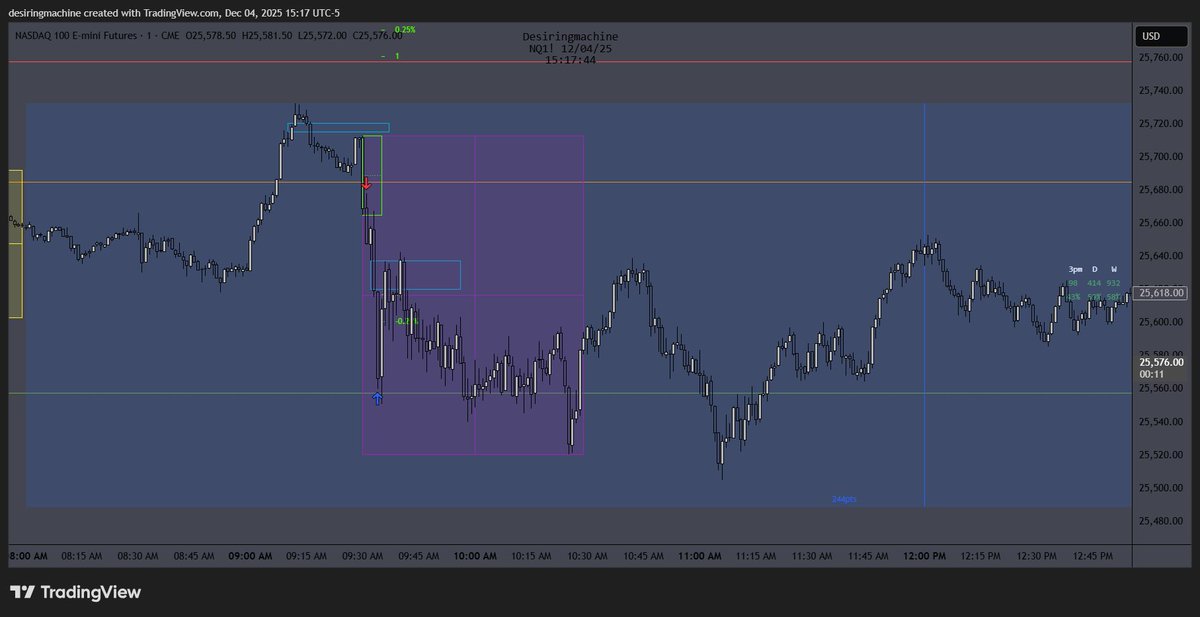
1 Dec 2025
$NQ Standard Deviations % Multi-timeframe
Ready->
tradingview.com/script/uODN3…
3
23
2,517