
AI is entering every analytical lab. Raman spectroscopy is no exception. 🔬
We are already seeing AI-assisted spectral interpretation tools enter pharma QC, gemology and industrial material analysis.
And it raises a question that every analytical scientist, QC manager and lab professional needs to think about seriously 𝗪𝗼𝘂𝗹𝗱 𝘆𝗼𝘂 𝘁𝗿𝘂𝘀𝘁 𝗔𝗜 𝘁𝗼 𝗶𝗻𝘁𝗲𝗿𝗽𝗿𝗲𝘁 𝘆𝗼𝘂𝗿 𝗥𝗮𝗺𝗮𝗻 𝘀𝗽𝗲𝗰𝘁𝗿𝗮 𝘄𝗶𝘁𝗵𝗼𝘂𝘁 𝗵𝘂𝗺𝗮𝗻 𝗿𝗲𝘃𝗶𝗲𝘄?
Vote honestly below.
#RamanSpectroscopy #SpectralAnalysis #PharmaTech #AnalyticalChemistry #LabTechnology #QualityControl
5

Jun 9
Why did I spend yesterday improving RainbowStats' spectral analysis?
Friday's employment report showed a remarkable increase in Leisure and Hospitality employment. That got me thinking about business formation. Were we missing an important signal? It also helped that it is raining in Seattle so no cycling!!
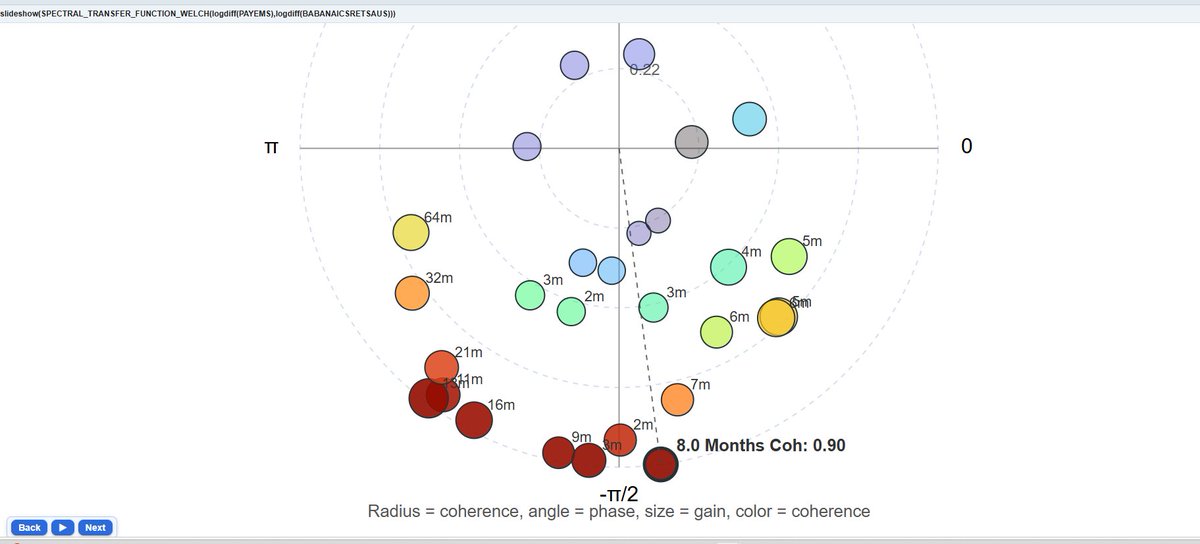
Using a new polar-coordinate transfer-function visualization, I examined the relationship between U.S. Business Applications and Nonfarm Payroll Employment.
The result was striking: an exceptionally strong relationship at the 8-month cycle frequency (coherence ≈ 0.90). The analysis suggests that business formation and hiring are tightly linked at short economic horizons, consistent with the idea that new business creation precedes employment growth.
The polar chart combines:
• Radius = relationship strength (coherence)
• Angle = lead/lag timing (phase)
• Bubble size = response magnitude (gain)
Once again, the entire analysis required just a single line of script.
I'll be away for a week. Let me know if you enjoy my posts!! Cheers and have a great trading week.
rainbowstats.com/simulations…
#Economics #Employment #Jobs
#Entrepreneurship #SmallBusiness
#DataScience #Statistics
#SpectralAnalysis #D3js
#FRED #DataVisualization
#FinTech
128
Jun 9
Coders just code. Yes, that code might be sloppy at first, but the structure is there.
I update my spectral transfer function using Industrial Production and Core CPI as my test case, I added:
• Log-scale coherence charts
• Gain and phase diagnostics
• Polar-coordinate transfer-function plots
• Dominant-cycle annotations
• Animated D3 visualizations
The result was unexpected.
At the dominant business-cycle frequency (~43 months), Industrial Production exhibits a strong relationship with future inflation. Rather than supporting a simple "more goods = lower prices" narrative, the data suggest a classic overheating cycle:
Production rises → economic activity strengthens → labor markets tighten → inflation emerges later.
The new polar chart combines:
• Radius = coherence (relationship strength)
• Angle = phase (lead/lag timing)
• Bubble size = gain (response magnitude)
• Color = coherence
The visualization makes it easy to identify which economic cycles matter and how they propagate through the economy.
All this with one line of script. Just be sure to hit the focus button. Use the back-and-forth buttons appreciate Box-Jenkins signal processing techniques. Engineers can mouse over the bubble points for signal information.
rainbowstats.com/simulations…
Interesting how often new visualizations reveal relationships that are difficult to see in the time domain.
#Economics #Inflation #IndustrialProduction
#DataScience #Statistics #D3js
#TimeSeries #SpectralAnalysis
#MachineLearning #FRED
#DataVisualization #FinTech

3
1
1,042
🌟Give your EEG analysis skills a boost!
Join the #BrainProductsAcademy in Rome, May 27–29, for an immersive 3-day workshop: Hands‑on EEG Analysis with #BrainVision #Analyzer 2.
🔗 Register: brainproducts.zohobackstage.… #SpectralAnalysis #PhaseMeasures #ConnectivityMethods
2
118

Apr 21
Tone Zone by @OrraAudio 🎛️
40-band spectral analysis, 24 genre curves, ref track learning, FFT EQ, 6-band param EQ, analog sat, A/B compare
💻 Mac/Win (VST3/AU/AAX)
🎁 FREE 🔗 orraaudio.com/products/orra-…
#freeplugin #eqplugin #mastering #spectralanalysis #saturation #audioplugin

1
5
281

🔥#HighlyCitedPaper
⚡Interference with Signaling Track Circuits Caused by Rolling Stock: Uncertainty and Variability on a Test Case
🔗Read at: mdpi.com/2079-9292/13/14/287…
Authors from @UniGenova
#ElectricalMeasurements #SpectralAnalysis #SignalProcessing #RollingStock #Railway

2
33
🌟Give your EEG analysis skills a boost!
Join the #BrainProductsAcademy in Rome, May 27–29, for an immersive 3-day workshop: Hands‑on EEG Analysis with #BrainVision #Analyzer 2.
🔗 Register: brainproducts.zohobackstage.… #SpectralAnalysis #PhaseMeasures #ConnectivityMethods
1
4
142

Unlike library-based mixture tools that rely on experimental reference spectra, QMSA builds spectra from first principles (shifts couplings). It works flexibly at any magnetic field strength and handles matrix effects more effectively. #NMR #SpectralAnalysis
2
53

Geometry–dynamics coupling
π encodes periodic structure.
e encodes continuous growth or propagation.
The composition e^π therefore represents:
- exponential unfolding of a periodic generator
Subtracting π removes the base geometric term, leaving the net dynamic output of the system.
In operator language:
e^π ≈ Σₙ πⁿ / n!
So the expression samples the full hierarchy of powers of π.
#MathematicalPhysics #SpectralAnalysis
2
119

18 Dec 2025
Exploration to production, covered.
TerraSpec4, reveNIR, X-550 Geochem, Z-903… SciAps has the mineral analyzers built for wherever your work takes you.
Download the brochure: cdn.prod.website-files.com/6…
#Geology #MiningTech #SpectralAnalysis #TerraSpec4 #reveNIR #XRF #LIBS

2
113

20 Nov 2025
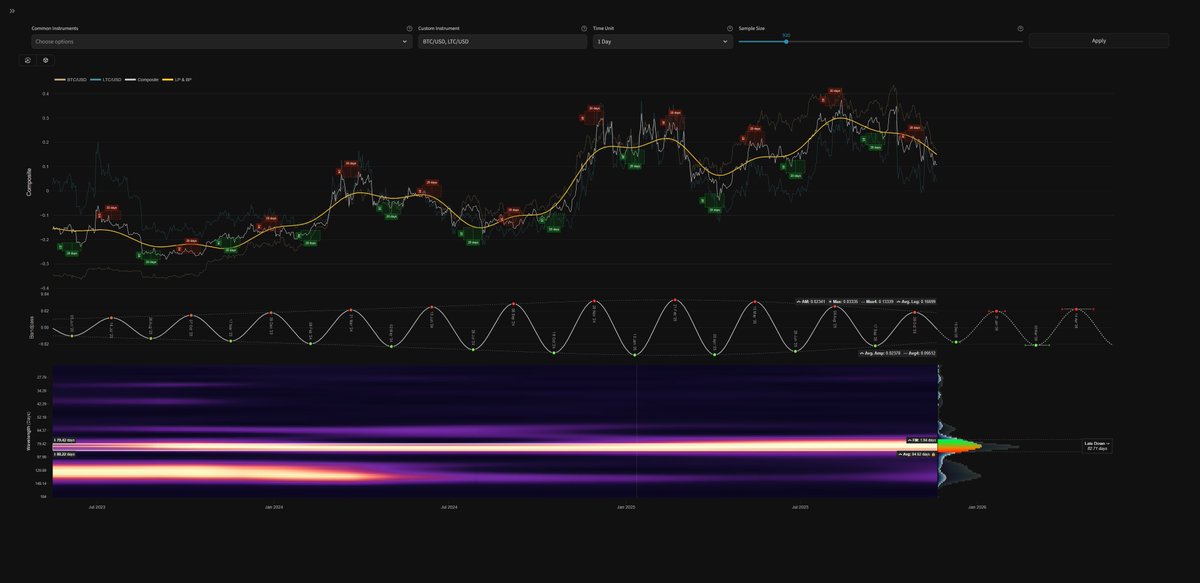
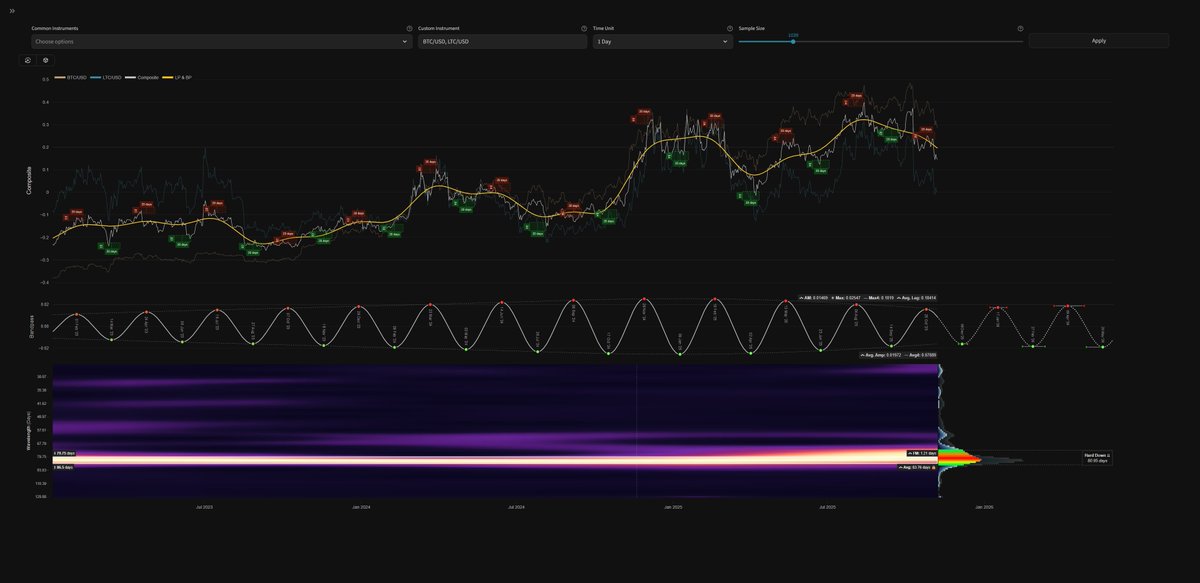
Bitcoin / Litecoin composite and the readily identified ~ 80 day cycle over the last 10 iterations or so.
#timefrequency #spectralanalysis
7 Nov 2025

Progress of nasty 80 day cycle in composite of BTC and LTC as we continue
9
1,315

20 Oct 2025
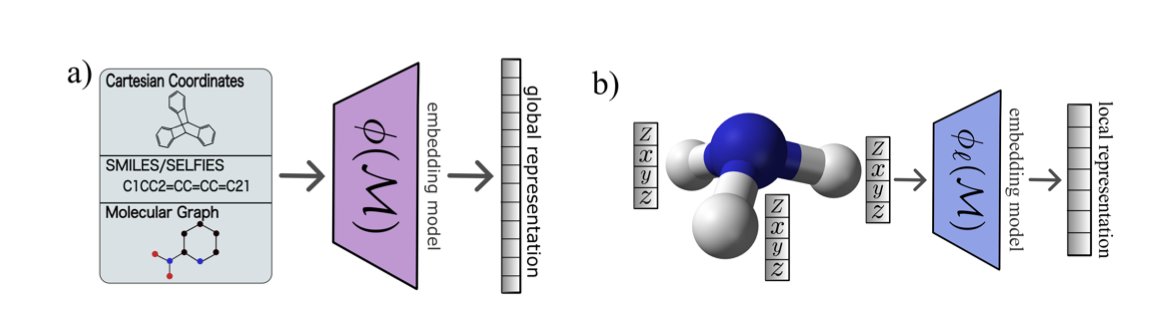
Spectral Analysis of Molecular Kernels: When Richer Features Do Not Guarantee Better Generalization
1. This study provides the first comprehensive spectral analysis of molecular kernels for property prediction on the QM9 dataset, covering a wide range of molecular representations including ECFPs, pretrained transformer-based features, and 3D descriptors. It challenges the common belief that richer spectral features always lead to better generalization.
2. The research shows that for transformer-based and local 3D representations, spectral richness can actually have a negative correlation with performance. This finding is significant as it highlights the nuanced relationship between representation, kernel features, and predictive performance in molecular property prediction.
3. The study implements truncated kernels to probe the relationship between the spectrum and predictive performance. It finds that retaining only the top 2% of eigenvalues can recover nearly all performance in many kernels, indicating that leading eigenvalues capture the most informative features.
4. The authors conducted an ablation study on training size, showing steady improvement in test performance as the training set size increases. This suggests that the observations from spectral analysis may persist for larger training sizes, which is important for practical applications in molecular chemistry.
5. The work also provides insights into the evaluation of self-supervised learning models in the context of molecular chemistry. It suggests that spectral metrics derived from kernel matrices could be a potential way to evaluate these models, opening new avenues for research.
📜Paper: arxiv.org/abs/2510.14217
#MolecularKernels #SpectralAnalysis #MachineLearning #MolecularPropertyPrediction
4
21
1,480

3 Sep 2025
📢 #SpecialIssue
Applications of Hyperspectral Imaging and Chemometrics in Food Analysis
📅 20 April 2026
👨🔬 Guest Editors:
Dr. Lorenzo Strani from University of Modena and Reggio Emilia, Italy
Dr. Nicola Cavallini Politecnico di Torino, Italy
🔗mdpi.com/journal/applsci/spe…
#foodanalysis #hyperspectralimaging #chemometrics #non-destructivedetection #qualitymonitoring #spectralpreprocessing #hyperspectralimagereconstruction #spectralanalysis

2
85
1 Jul 2025
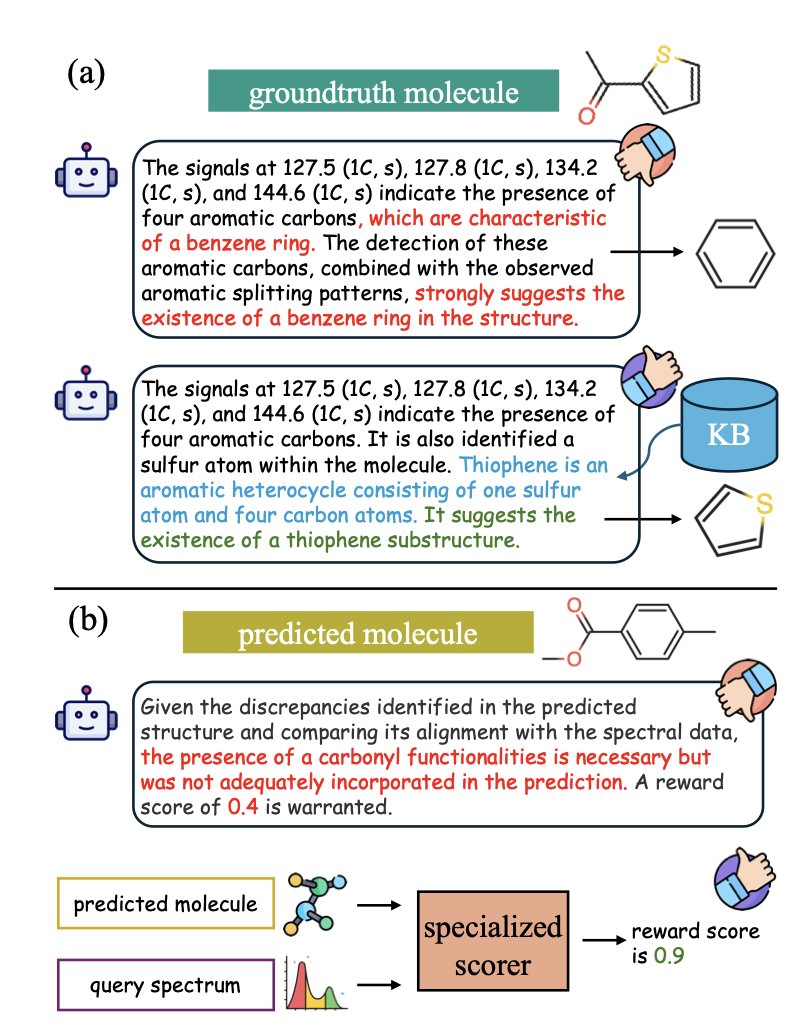
Boosting LLM’s Molecular Structure Elucidation with Knowledge Enhanced Tree Search Reasoning
1.This work introduces K-MSE, a plug-and-play framework that enhances LLMs for molecular structure elucidation by integrating a Monte Carlo Tree Search (MCTS) with domain knowledge and a specialized reward model.
2.K-MSE boosts LLM performance by over 20% on GPT-4o-mini and GPT-4o across multiple metrics including structural accuracy and chemical fingerprint similarity, enabling more reliable molecular structure predictions from spectral data.
3.At the heart of K-MSE is a molecular substructure knowledge base that augments LLMs’ understanding of chemical space. It includes over 500 commonly occurring substructures paired with natural language descriptions, expanding the model's ability to interpret unfamiliar or rare compounds.
4.A key innovation is a specialized molecule-spectrum scorer trained to evaluate how well a predicted molecular structure aligns with input spectral data (C-NMR and H-NMR). Unlike standard LLMs, this scorer provides precise feedback using graph-based encoders and fingerprint features.
5.The scorer also serves as a retriever, linking the spectral input with relevant substructures from the knowledge base, guiding the LLM during reasoning by inserting chemically plausible building blocks.
6.K-MSE uses MCTS to iteratively refine solutions through critique and rewriting. It dynamically evaluates candidate molecules and selects high-reward paths, significantly enhancing the model’s ability to correct itself and explore chemical alternatives.
7.Ablation studies show that removing either the scorer or knowledge base leads to large drops in accuracy, confirming that both components are critical. Supplementing the critique phase with molecular images and formulas further improves model reasoning.
8.Compared to existing reasoning frameworks (e.g., CoT, Self-Refine, MAD), K-MSE achieves higher accuracy with comparable or lower token usage, making it efficient for test-time enhancement.
9.K-MSE demonstrates flexibility: it can be integrated with various LLMs and consistently improves performance across models from LLaMA-3 to GPT-o1, indicating broad applicability without retraining.
10.The work opens a path toward more autonomous chemical analysis systems, suggesting that LLMs, when paired with domain knowledge and tailored reasoning frameworks, can serve as copilots in experimental workflows.
💻Code: github.com/HICAI-ZJU/K-MSE
📜Paper: arxiv.org/abs/2506.23056v1
#AI4Science #LLMs #Chemistry #MolecularStructure #SpectralAnalysis #DrugDiscovery #MonteCarlo #TreeSearch #GPT4 #MachineLearning
2
472

29 May 2025
#コラム
"NMRスペクトルの読み方"
本コラムでは、NMRスペクトルから分かること (ケミカルシフト・積分比・カップリング) についてわかりやすく解説します。
▼詳細はこちら
jeol.co.jp/column/detail005.…
#NMR #SpectralAnalysis #日本電子 #JEOL
2
5
843
23 May 2025
#Column
"How to read the NMR spectra"
This column provides easy-to-understand explanations about what we can learn from the NMR spectra (chemical shift, integration ratio, coupling)
▼Please check it from here:
jeol.com/column/detail005.ph…
#NMR #SpectralAnalysis #JEOL
1
2
565

10 May 2025
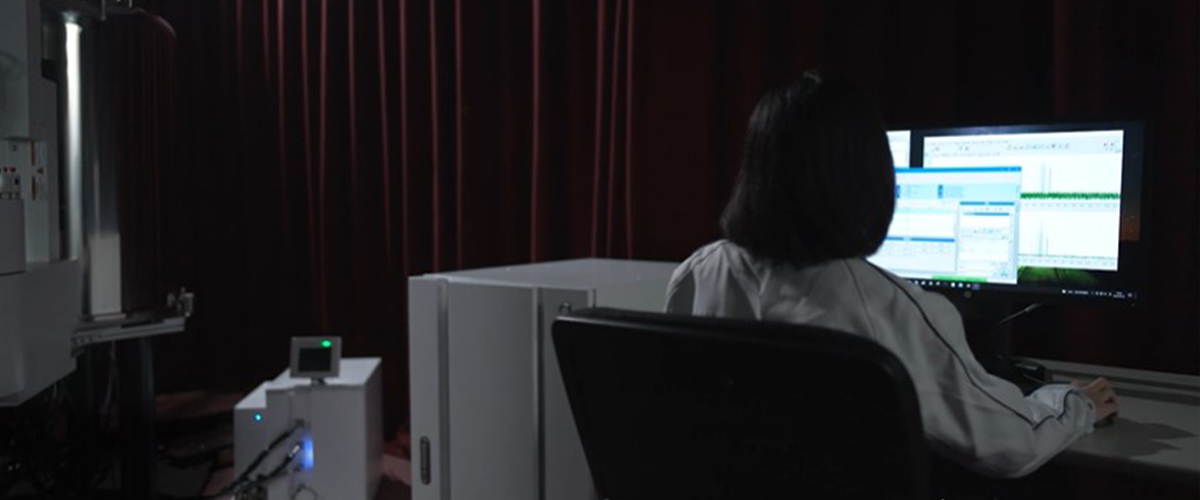
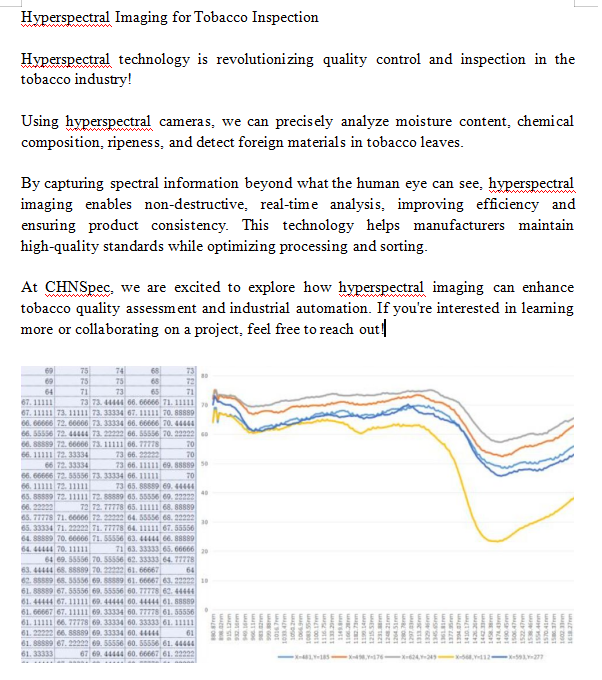
Hyperspectral Imaging for Tobacco Inspection 🚬
#HyperspectralImaging #TobaccoInspection
#QualityControl #CHNSpec #SpectralAnalysis
#TobaccoInspection

2
11

3 Apr 2025
Mastering Hi-Hat Frequencies: Dynamic EQ Techniques Revealed
#MixingTips #MusicProduction #HiHatControl #ProQ4 #DynamicEQ #AudioEngineering #SoundDesign #SpectralAnalysis #MusicMixing #ProAudio
2
120

3 Apr 2025
Need to polish your #EEG analysis skills? Join our #BrainProductsAcademy workshop A-Z of EEG Analysis with #BrainVision #Analyzer. We'll cover practical data processing and analysis from pre-processing & #ERP analysis to #spectralanalysis & #connectivity.
brainproducts.zohobackstage.…
2
448

20 Feb 2025
🔍 Struggling to identify unknown spectra? Discover the latest tools and techniques to enhance your spectral analysis workflow!
📅 Date: February 26, 2025
🕒 Time: 10 am EST
ow.ly/ltXk50USwht
#SpectralAnalysis #Webinar #KnowItAll #SmartSpectra #AnalyticalChemistry

1
2
488