
May 19
#Trade Setup – May 19, 2026 (Pre-Market Briefing) based on May 18 close:
OVERALL MARKET VIEW
🔹 Nifty 50 closed nearly flat at ~23,650 ( 6 pts / 0.03%), rebounding from intraday lows.
🔹 Technicals: Bearish momentum (MACD sell crossover, RSI weak, below EMAs).
🔹 Short-term range: 23,250–23,800.
Above 23,800 → watch 24,000–24,100 hurdles.
Below 23,400 → risk drag to 23,250, then 23,100.
🔹 Sentiment cautious: India VIX up 4.47% to 19.63, high oil prices, DI- > DI .
KEY LEVELS (PIVOT POINTS)
Nifty 50 (~23,650)
Resistances: 23,699 → 23,788 → 23,933
Supports: 23,410 → 23,320 → 23,176
Bank Nifty (~53,537, -0.3%)
Resistances: 53,667 → 53,876 → 54,214 (Fib: 54,422/55,809)
Supports: 52,992 → 52,783 → 52,445 (Fib: 52,798/51,532)
Both indices formed bullish candles with long lower wicks (buying at lows) but stayed below key MAs, showing bearish momentum.
OPTIONS DATA HIGHLIGHTS
Nifty Calls — Max OI at 24,000 (1.26 Cr contracts) → strong resistance; heavy call writing at 24,000/24,200.
Nifty Puts — Max OI at 23,000 (1.24 Cr) → major support; strong put writing at 23,400.
PCR — Rose to 1.24 (from 1.01) → bullish sentiment (more put selling).
Bank Nifty — Max call OI at 55,000; max put OI at 53,000.
OTHER POINTS
🔹 India VIX — 19.63 (rising); risk for bulls if >20.
🔹 Market Breadth — Mixed: 34 long build-up, 77 long unwinding, 74 short build-up, 27 short covering.
🔹 F&O Ban — Kaynes Technology India, SAIL.
🔹 Funds Flow — Recent sessions saw institutional buying (FIIs DIIs).
TECHNICAL TAKEAWAY
Short-term weakness persists despite recovery candle. Bulls need sustained move above 23,800–24,000 for strength. Bears target below 23,400. Watch global cues, oil prices, and rupee weakness.
#TradeSetup #Nifty50 #BankNifty #OptionsData #IndiaVIX #TechnicalLevels #Markets
Disclaimer :
The information provided is for general informational purposes only and should not be construed as financial, investment, legal, or tax advice. Past performance is not indicative of future results. Each investor’s circumstances are unique; therefore, you should consult a qualified professional before making any financial commitments. While every effort has been made to ensure accuracy, I assume no liability for any errors or for outcomes resulting from the use of this information.
2
330

Solana drops to ~$78 as bearish momentum persists and resistance limits recovery; what factors might determine whether SOL stabilizes or continues its decline?
#NCNNews2026 #NameCoinNews #Solana #SOL #MarketDecline #TechnicalLevels
namecoinnews.com/solana-exte…
2
9

Mar 13
Market Setup & Key Levels 📊
📉 Nifty 50
➡️ Down 0.95% to close at 23,639 in prev session
➡️ Hits 10-month low
⚠️ Price Action
➡️ Today’s high near previous session’s low → weak structure
➡️ 23,500 emerging as support (also visible in options positioning)
———x
🏦 Nifty Bank
➡️ Down 1.1% to close at 55,100 in orev session
⚠️ Technical Setup
➡️ Hits 5-month low & lowest close in 5 months
➡️ Today’s high near previous session’s low
🎯 Key Level
➡️ 54,300 support zone
➡️ Last year a bottom formed from this area (~1.5% lower)
#Nifty #BankNifty #MarketSetup #TechnicalLevels #StockMarket #tradersdiary
4
217
Mar 12
Market Setup & Key Levels 📊
📉 Nifty 50
➡️ Down 1.6% to close at 23,866 in orev session
➡️ RSI in oversold zone ⚠️ → downside may be limited
🎯 Key Levels
➡️ Above 24,000 = Neutral
➡️ Above 24,300 = Positive
➡️ Below this → Negative to sideways bias
———
🏦 Nifty Bank
➡️ Down 2.1% to close at 55,735 in orev session
➡️ Lowest closing in 5 months
⚠️ Technical Setup
➡️ Below 200-DMA for 3rd session (~57,500)
➡️ Positive only above 57,500
📊 RSI here also in oversold zone
#Nifty #BankNifty #MarketSetup #TechnicalLevels #StockMarket 📉📊
3
473

Feb 16
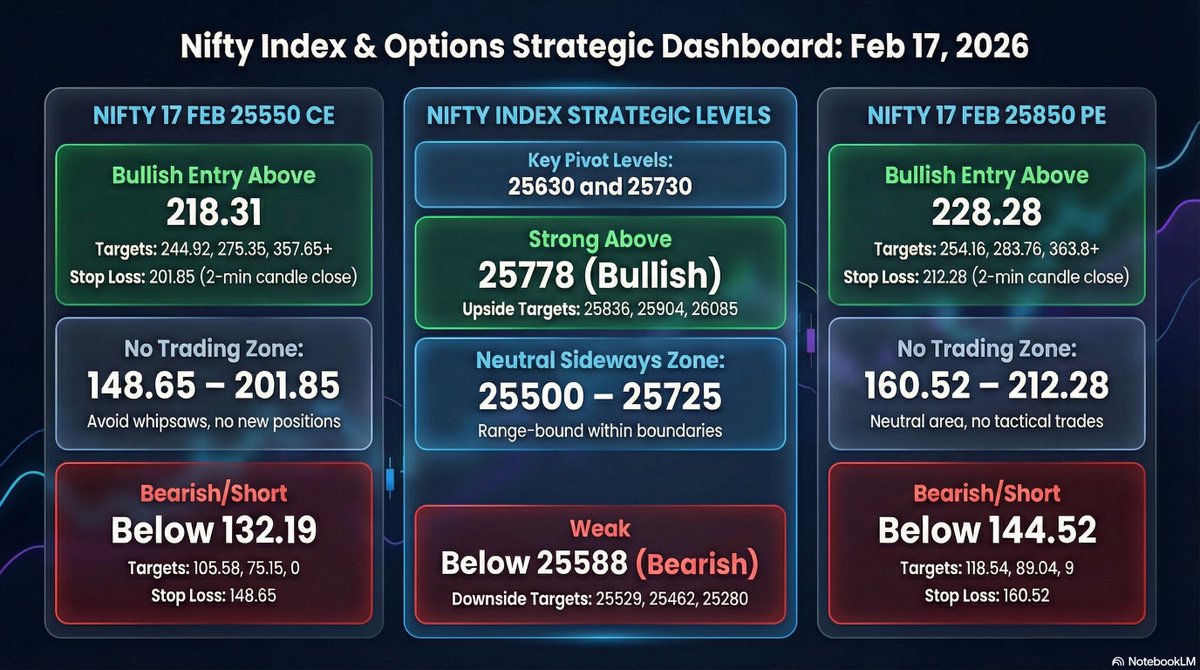
View for 17-02-2026 of CE & PE:
NIFTY 17 FEB 25550 CE
Looking Strong Above 218.31 for 244.92, 275.35, 357.65
SL 201.85 If Entry at 218.31 (02 Min Candle Closing Basis.)
Below 132.19 May hit 105.58, 75.15, 0
SL 148.65 If you Short at 132.19 (02 Min Candle Closing Basis.)
No Trading Zone is 148.65 to 201.85
NIFTY 17 FEB 25850 PE
Looking Strong Above 228.28 for 254.16, 283.76, 363.8
SL 212.28 If Entry at 228.28 (02 Min Candle Closing Basis.)
Below 144.52 May hit 118.64, 89.04, 9
SL 160.52 If you Short at 144.52 (02 Min Candle Closing Basis.)
No Trading Zone is 160.52 to 212.28
#NIFTY #NIFTYOptions #NIFTYExpiry #NIFTY17FEB #NIFTY25850PE #NIFTY25550CE #OptionsTrading #IntradayOptions #IndexOptions #BreakoutLevels #BreakdownLevels #LevelBasedTrading #OptionsStrategy #OptionsSetup #OptionsView #MarketView #MarketAnalysis #TechnicalLevels #PriceActionTrading #MomentumTrading #ExpiryWeek #BullishAbove #BearishBelow #NoTradingZone #RiskManagement #StrictStopLoss #CandleCloseConfirmation #IntradayTrading #IndianStockMarket #DerivativesMarket #ProfessionalTrading #TradeSetup #TradingDiscipline
2
253

Feb 10
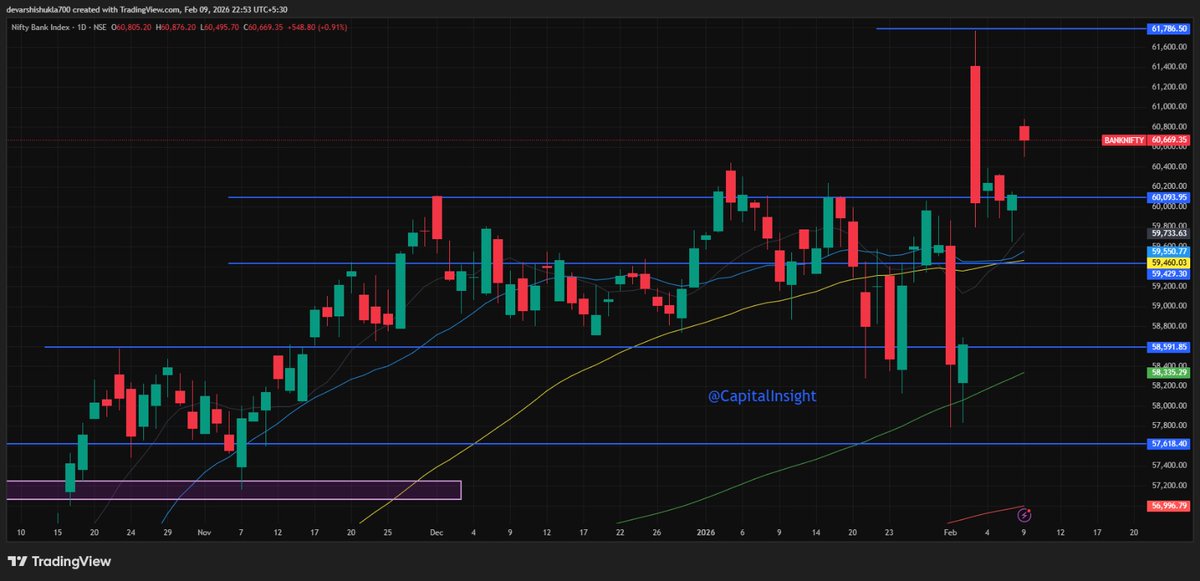
NIFTY BANK
✅ Highly volatile zone — expect sharp moves
✅ Support levels: 60450 / 60090 / 59880
✅ Resistance levels: 60870 / 61020 / 61400
✅ Trade with caution and strict risk management
⚠️ Not a buy/sell recommendation
📚 For educational purposes only
#NiftyBank #MarketView #TechnicalLevels #StockMarketIndia
2
66

GOLD #XAUUSD
4941$ ke upar sustain hota hai to trend good ✨
Iske neeche pressure rahega, aur downside dekhne ko mil sakta hai
SILVER #XAGUSD
Jab tak 93$ ke upar nahi jaata,
tab tak structure weak / not good ⚠️
📊 Simple rule:
Levels hold = strength
Levels fail = caution
#Gold #Silver #CommodityMarket #TechnicalLevels #chart_sab_kuch_bolta_hai #chartsabkuchboltahai
2
4,135
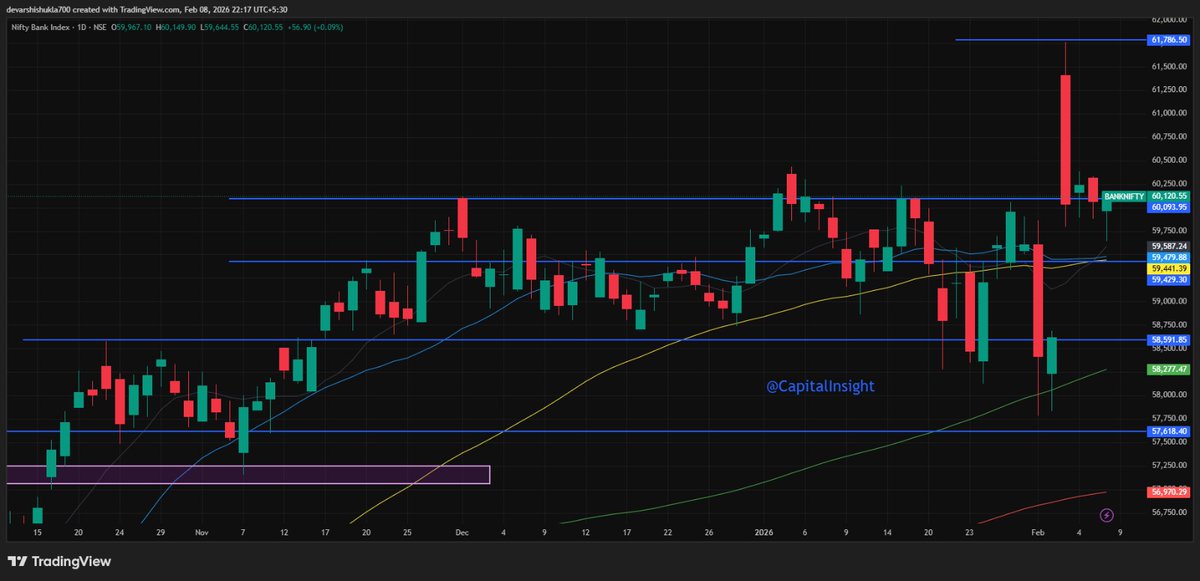
NIFTY BANK
✅ Highly volatile zone – expect sharp moves
✅ Support levels: 59880 / 59430 / 59020
✅ Resistance levels: 60400 / 61000
✅ Disclaimer: Not a buy/sell recommendation
✅ For educational purposes only
#NiftyBank #MarketView #TechnicalLevels #StockMarket
2
68
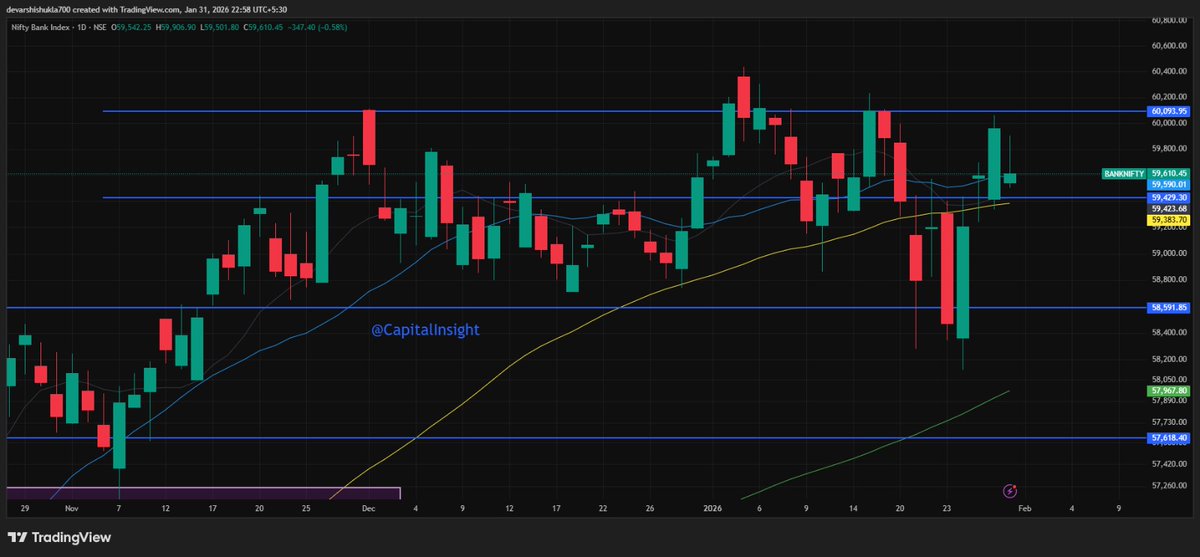
NIFTY BANK – Budget Day
✅ Trading near all-time highs (ATH)
✅ Key Supports: 59,430 / 59,230 / 58,850
✅ Key Resistances: 59,900 / 60,090 / 60,440
✅ Volatility likely to remain elevated during Budget session
❗ Not a buy/sell recommendation
📚 For educational purposes only
#NiftyBank #BudgetDay #TechnicalLevels #StockMarket #TradingView
2
69
NIFTY – Budget Day
✅ Tariff & geopolitical concerns remain key overhangs
✅ Support levels: 25,180 | 25,040 | 24,910
✅ Resistance levels: 25,460 | 25,610 | 25,850
⚠️ Not a buy/sell recommendation
📚 For educational purposes only
#NIFTY #BudgetDay #MarketOutlook #TechnicalLevels
2
83
#NIFTY
✅ Trading at All-Time High (ATH)
✅ Support levels: 26,120 / 26,040 / 25,960
✅ Resistance levels: 26,280 / 26,500 / 26,700
⚠️ Not a buy/sell recommendation
📘 For educational purposes only
#Nifty50 #TechnicalLevels #MarketUpdate #IndexWatch

2
113

Jan 5
Scenario 1: Shallow Retracement
If MTNN pulls back mildly, strong demand should step in between ₦465 – ₦480. This zone aligns with prior consolidation and dynamic support, making it the first area to watch.
#MTNN #SupportResistance #NGX #TechnicalLevels #Charting #Investing
1
1
7
1,048
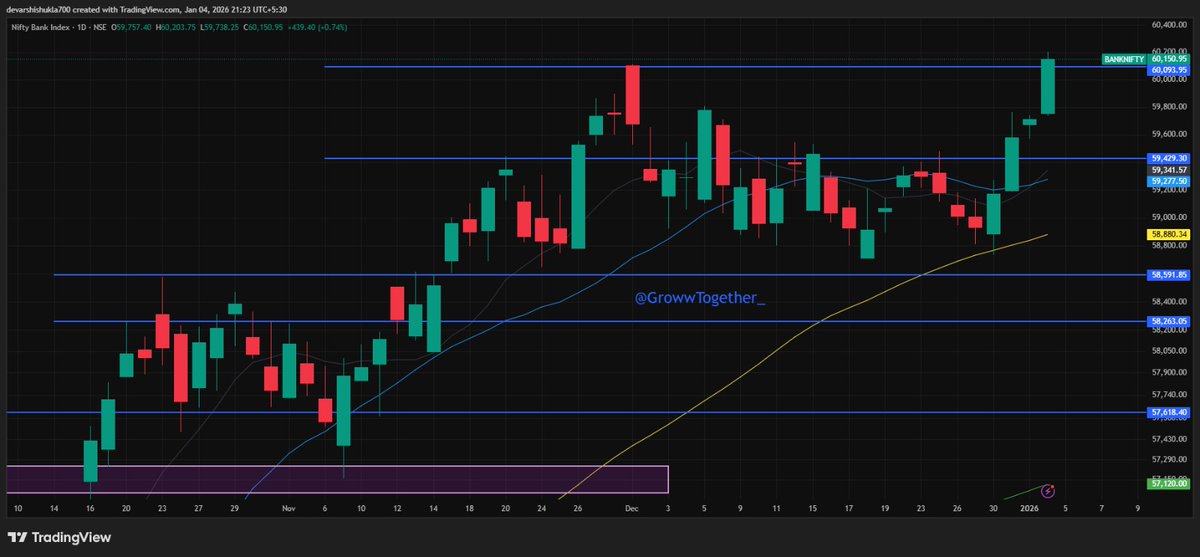
NIFTY BANK trading near all-time highs (ATH)
✅ Support levels: 60090 / 59800 / 59570
✅ Resistance levels: 60300 / 60500
⚠️ Not a buy/sell recommendation
📚 For educational purposes only
#NiftyBank #BankNifty #TechnicalLevels #MarketView #TradingEducation
2
70
30 Dec 2025
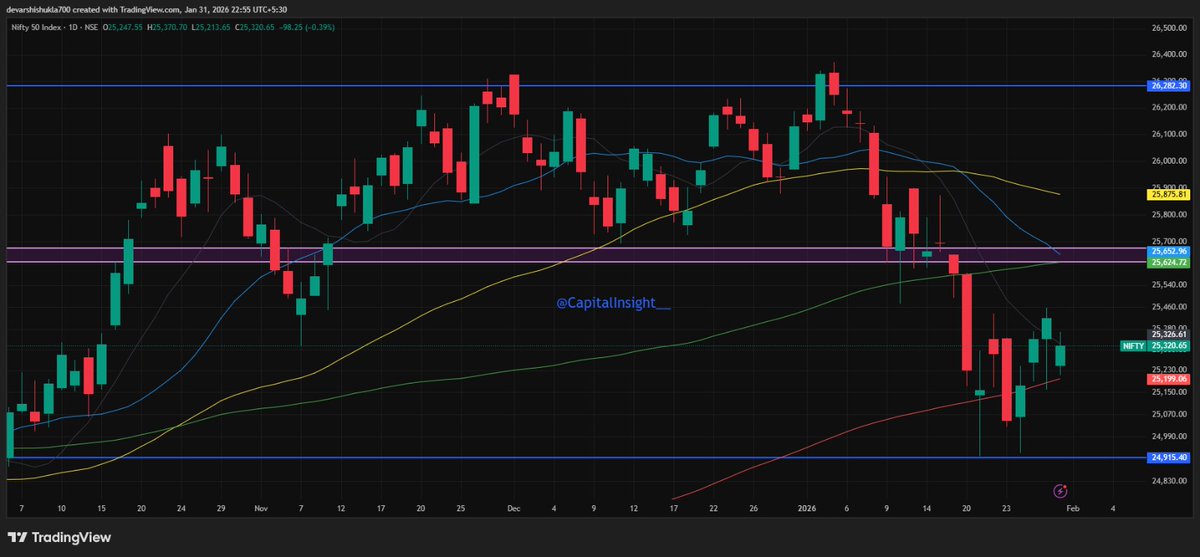
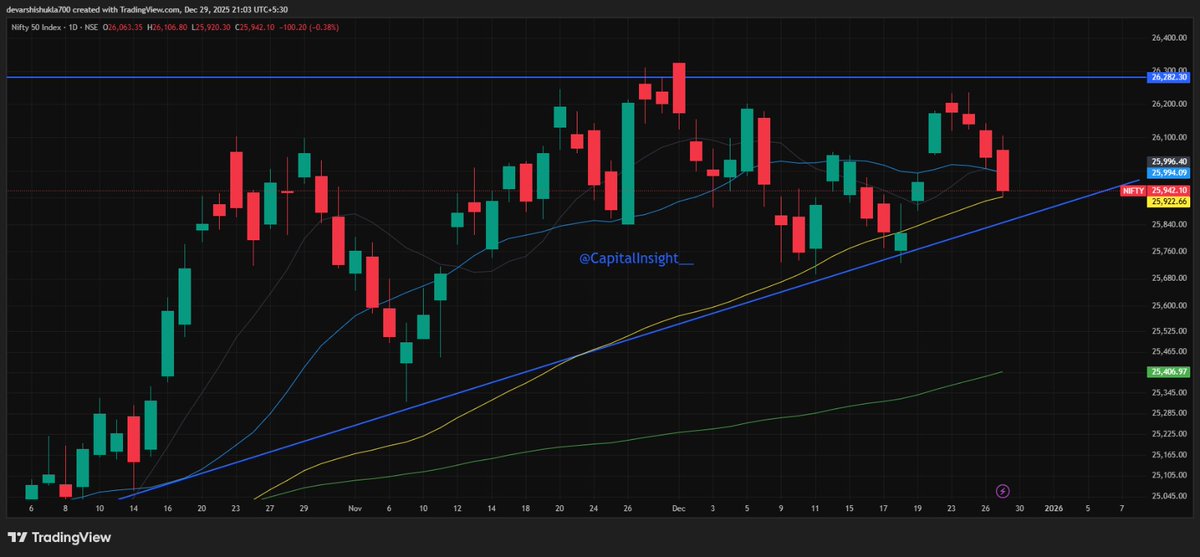
NIFTY Outlook
✅ Likely to remain volatile near all-time highs (ATH)
✅ Support levels: 25,920 / 25,840 / 25,730
✅ Resistance levels: 26,020 / 25,140 / 25,220
⚠️ Not a buy/sell recommendation
📘 For educational purposes only
#Nifty #MarketOutlook #TechnicalLevels #StockMarket #EducationOnly
2
102

26 Nov 2025
#Nifty Hourly | 26-11-2025
Nifty is currently facing resistance near the 26,030 zone.
Immediate support lies around the 200-MA range of 25,790–25,740, which has acted as a base on two prior occasions.
This is a purely technical/educational view to highlight support & resistance zones only — not a Buy/Sell/Hold or investment/trading recommendation.
Warning & Disclaimer:
“Investments in securities market are subject to market risks. Read all the related documents carefully before investing.”
“Registration granted by SEBI, Enlistment as RA with Exchange and certification from NISM in no way guarantee performance of the intermediary or provide any assurance of returns to investors.”
#NiftyHourly #SupportResistance #TechnicalLevels #MarketAnalysis

4
1,443
21 Nov 2025
RELIANCE INDUSTRIES (RIL) building hurdle on a gap of 25 points?
🔥 4-month high: 1550
📈 Up 2% to close at 1549, almost at day’s high
Range Breakouts 🔓 25 points gap
➡️ 11-session range (1475–1500) → Breakout on 12 Nov
➡️ 6-session range (1500–1525) → Breakout today from 1525
Now price is hitting a fresh hurdle at 1550.
Why 1550 Is a Big Level? 🎯
🔺 1551 = YTD Top (9 July)
🔻 After that high, RIL corrected 12% within a month
✔️ That’s why 1550–1551 is a critical supply / profit-booking zone
#Reliance #RIL #Nifty50 #MarketUpdate #Breakout #TechnicalLevels #StockAnalysis
2
311

29 Oct 2025
The recent correction in #gold and #silver aligns with technical expectations, given the significant #resistance at $4,000/oz for gold and $50/oz for silver, following their sharp upward surge earlier this year. The underlying drivers for both precious metals remain strongly intact—#GlobalDebt remains elevated, #inflationary pressures have intensified due to post-Trump tariff impacts, central banks continue accumulating gold as a #NeutralReserve asset, and #InterestRates are projected to stay soft.
#TechnicalLevels and Support:
Gold found strong resistance at $4,000/oz and is now consolidating, with notable technical support at $3,500/oz.Silver reversed near $50/oz, with support at $40/oz, both levels being watched closely by institutional investors and traders.
Market sentiment suggests it’s unlikely for prices to retest these lower supports in the near term, given the robust macro backdrop.
#MacroFundamentals:
Persistently high global debt and ongoing central bank gold buying continue to underpin bullish sentiment in precious metals markets. Inflation has remained sticky and may accelerate due to the ripple effects of tariffs and trade shifts, which drives demand for hard assets like gold and silver. Central banks are rebalancing reserves, with gold increasingly seen as a “#NeutralReserve” to diversify away from US dollar and other fiat currencies.
#PriceOutlook for 2026:
Gold is projected to rebound and possibly set new highs in 2026, with targets ranging from $4,500/oz to $5,000/oz. Silver is also positioned to rally, targeting $60/oz in a scenario of persistent bullish fundamentals and renewed investor flows into precious metals.
#KeyTakeaways:
This correction is a natural phase in a broader #bullish cycle and reflects technical factors rather than any deterioration in core fundamentals. Investors and wealth managers continue to see gold and silver as strategic diversification assets amidst ongoing macro uncertainty. Both metals retain strong narrative support; long-term macro trends favor renewed strength and potential record highs as the next cycle unfolds.
#Disclaimer:
These are my personal views. Read this along with my note on why financial reset is unfolding. This is for information purposes only and should not be construed as investment advice.
1
4
1,099

Stock in Focus: Apollo Micro Systems Ltd.
Highlighted as part of our stock movers list based on technical analysis and price behavior.
For more details, refer to the latest analysis by Anand Rathi Investment Services.
#StockMarketUpdate #TechnicalLevels #AnandRathi

1
4
606

14 Oct 2025
Pre-Market Watchlist:
NVDA sitting between pre-market low and high levels (leves183–187).
Break above 187 → reclaim momentum.
Break below 183 → continuation toward 180 zone.
This range will dictate the first hour’s sentiment.
#NVDA #premarketanalysis #marketstructure #daytrader #technicallevels #stockmarket #alirezatrades
Disclaimer: This post is for educational purposes only. Nothing shared here is financial advice or a trade recommendation.

2
17

4 Sep 2025
🔍 Market Outlook: Why Is the Market Still Range-Bound Despite GST Buzz?
Despite GST news circulating in the market, we’re witnessing a range-bound setup. Let’s break it down through chart levels, participant data, and option activity to understand what’s really happening beneath the surface. 📉📊
📌 Key Technical Levels to Watch
Range: 24,700 – 25,000
Immediate Resistance: 24,830
Breakout Target: 25,150 (only above 25,000)
Support Zone: 24,700
Breakdown Target: 24,600
🔺 Upside Scenario:
If 24,830 is breached, we may see a move towards 25,000, and if momentum sustains, even 25,150 is possible.
🔻 Downside Scenario:
If 24,700 breaks, expect a move down to 24,600 – indicating short-term weakness.
⚙️ Derivatives Data Snapshot
IV Skew: Signaling a potential attempt toward 24,800
FII Futures Data: 92% positions still short – any breakout can trigger short covering
Options Activity:
📉 Heavy Call Writing – Resistance pressure building
⚠️ Put Unwinding – Weakness in support levels
🧠 What This Means
Despite news triggers like GST, the market is respecting its technical range. It’s a wait-and-watch game until a decisive breakout or breakdown occurs. Option writers and FII data indicate a cautious stance, but any move beyond key levels could lead to swift directional moves.
✅ Conclusion
The market remains at a critical juncture. Traders should track 24,830 on the upside and 24,700 on the downside for the next directional cue. Data suggests a possible breakout — but confirmation is key.
📈 Follow for more real-time market breakdowns, data-led insights, and actionable levels.
#TradingStrategy #StockMarketIndia #NiftyAnalysis #DerivativeData #FIIFutures #OptionChainAnalysis #TechnicalLevels #MarketOutlook
2
86