
Monday Decisive Kyun Hai — OI Data Bol Raha Hai
Casually OI data dekh raha tha. 2 cheezein dikhi.
1. Call Writers — Buri tarah swaha ho gaye 🔥
Sirf aur sirf 24,000 pe call writing bachi hai.
Baaki sab cover ho gaye. Bears swaha hogye. 🏳️🤣
2. Put Writers — Andar ghus ghus kar writing karke gaye hain 😂
24,000 In The Money tak put writing kar ke gaye hain.
Itna confidence hai ki bazaar neeche nahi jaayega.
Agar deal hui:
Abki baar 24000 paar. Ya shayad aur upar. 🚀
Agar deal nahi hui:
Jaise call writers swaha hue — subah 15 minute mein in over-confident put writers ki lanka lagegi. 😅
God be kind to them. 🙏😂
Monday will be a binary event I see.
#nifty #Banknifty #IndianStockMarket #OptionsData #GiftNifty

15
1
65
23,593
Aaj kuch unusual observe kiya FII options data mein 🧵
Bahut lambe time baad — FII positioning mein bullish change dikha aaj ke session ke liye.
What they did:
→ 27,466 Call Longs added
→ 22,377 Put Shorts added
→ Classic Bull Debit Spread structure
6,035 Futures Shorts bhi add kiye — likely hedge ke liye.
What does this mean?
Yeh necessarily bullish turn nahi hai. But short term tone thoda change ho skta hai — jo bahut lambe time baad dikh raha hai.
FII abhi bhi cautious hain — futures shorts prove karte hain. But options positioning mein jo bullish bias aaya hai — woh ignore karne wali cheez nahi.
Lets watch until they turn bearish again 😂🤣
Market structure watch karna hoga carefully.
Disclaimer: Not SEBI registered. Not financial advice. Personal observation only. 🙏
#Nifty #FII #OptionsData #IndianStockMarket #Banknifty
1
4
610

Jun 8
#NIFTY 50 Technical View (Closing Basis) | June 8, 2026
🔹 Closing Analysis: Nifty 50 ended at 23,123.00, down 243.70 points (-1.04%), as rising geopolitical tensions and risk-off sentiment triggered broad-based selling across sectors
🔹 Candlestick Pattern: The daily chart formed an Inverted Hammer, often considered an early reversal signal if supported by bullish confirmation in the next trading session
🔹 Key Support Levels:
🔹 Immediate Support: 23,060 – 23,040
🔹 Strong Support: 22,880 – 22,860
🔹 A decisive break below 23,040 could accelerate downside momentum toward lower support zones
🔹 Key Resistance Levels:
🔹 Immediate Resistance: 23,300 – 23,340
🔹 Major Resistance: 23,400 – 23,500
🔹 Sustained buying above 23,340 will be required to improve near-term sentiment
🔹 Technical Indicators:
🔹 RSI (14): 36.21
🔹 Momentum remains weak and continues to favor bears
🔹 Moving Averages (MA5 to MA200): All major moving averages continue to indicate a "Sell" signal
🔹 Option Chain Insights:
🔹 Significant Call Writing observed at 23,400 and 23,500 strikes, creating a strong resistance zone
🔹 Strong Put Open Interest concentrated at the 23,100 strike, providing near-term support
🔹 Market Structure:
🔹 The index remains under pressure below key resistance levels
🔹 While the Inverted Hammer suggests a possible short-term bounce, confirmation through follow-up buying is essential before any bullish reversal can be considered
🔹 Outlook for Next Session:
🔹 Traders should closely monitor the 23,040 support zone
🔹 Holding above support could trigger a relief rally toward 23,300–23,340
🔹 A breakdown below 23,040 may open the door for further weakness toward 22,860–22,880
#Nifty50 #TechnicalAnalysis #NiftyTechnical #StockMarketIndia #TradingView #MarketAnalysis #OptionsData #NiftySupport #NiftyResistance #IndianMarkets #June82026
Disclaimer :
The information provided is for general informational purposes only and should not be construed as financial, investment, legal, or tax advice. Past performance is not indicative of future results. Each investor’s circumstances are unique; therefore, you should consult a qualified professional before making any financial commitments. While every effort has been made to ensure accuracy, I assume no liability for any errors or for outcomes resulting from the use of this information.
1
5
386
Jun 4
🇮🇳 Nifty 50 Technical Analysis – Closing View | June 4, 2026
🔹 The #Nifty 50 ended the session at 23,416.55, gaining 10.95 points (0.05%) after witnessing considerable intraday volatility.
🔹 The index staged a strong recovery from its intraday low of 23,247.30, reflecting robust buying interest at lower levels and successfully defending the crucial 23,400 zone.
🔹 Technically, the market formed a recovery-oriented price structure, rebounding from early weakness and managing to close in positive territory.
🔹 The ability of the index to recover from lower levels indicates that buyers remain active despite ongoing geopolitical concerns and caution ahead of the RBI policy announcement.
🔹 Immediate resistance is seen near 23,550, where a significant concentration of Call Open Interest is positioned, creating a near-term hurdle for the bulls.
🔹 On the downside, 23,300 remains a key support zone, supported by recent price action and a notable buildup in Put Open Interest.
🔹 A decisive breakout above 23,550, accompanied by stronger trading volumes, could pave the way for a fresh leg of upward momentum in the market.
🔹 Failure to sustain above 23,400 may invite profit-booking and increase the probability of a retest of lower support levels.
🔹 The India VIX eased to 15.89, signaling a moderation in market volatility and an improvement in trader confidence.
🔹 Lower volatility readings generally support market stability, although traders remain cautious ahead of major event risks.
🔹 The upcoming RBI Monetary Policy Committee (MPC) decision on June 5 is expected to act as the primary trigger for the market's next directional move.
🔹 Until then, the index is likely to remain range-bound, with traders closely monitoring policy commentary, global developments, crude oil prices, and institutional fund flows.
📌 Key Levels for the Next Session
🔹 Support: 23,300 → 23,200
🔹 Resistance: 23,550 → 23,600
🔹 Bias: Range-bound with a cautiously positive undertone above 23,300.
#Nifty50 #TechnicalAnalysis #StockMarketIndia #MarketUpdate #TradingView #NSE #NiftyAnalysis #IndianStockMarket #RBI #MPCMeeting #OptionsData #IndiaVIX #Investing #DalalStreet
Disclaimer :
The information provided is for general informational purposes only and should not be construed as financial, investment, legal, or tax advice. Past performance is not indicative of future results. Each investor’s circumstances are unique; therefore, you should consult a qualified professional before making any financial commitments. While every effort has been made to ensure accuracy, I assume no liability for any errors or for outcomes resulting from the use of this information.
1
2
239

May 27
Will Friday really open Gap Up… or is the market hiding something bigger?
Will #WTI / #Brent and the global cues help? Let’s learn the possibilities for Friday.
youtu.be/TH3Y39MPtLI
#Nifty #BankNifty #Elliottwave #Priceaction #Optionsdata
3
5
24
2,689

May 20
we are taking the optionsdata stripping out the bs and handing normal people a weapon
1
3
24
May 19
#Trade Setup – May 19, 2026 (Pre-Market Briefing) based on May 18 close:
OVERALL MARKET VIEW
🔹 Nifty 50 closed nearly flat at ~23,650 ( 6 pts / 0.03%), rebounding from intraday lows.
🔹 Technicals: Bearish momentum (MACD sell crossover, RSI weak, below EMAs).
🔹 Short-term range: 23,250–23,800.
Above 23,800 → watch 24,000–24,100 hurdles.
Below 23,400 → risk drag to 23,250, then 23,100.
🔹 Sentiment cautious: India VIX up 4.47% to 19.63, high oil prices, DI- > DI .
KEY LEVELS (PIVOT POINTS)
Nifty 50 (~23,650)
Resistances: 23,699 → 23,788 → 23,933
Supports: 23,410 → 23,320 → 23,176
Bank Nifty (~53,537, -0.3%)
Resistances: 53,667 → 53,876 → 54,214 (Fib: 54,422/55,809)
Supports: 52,992 → 52,783 → 52,445 (Fib: 52,798/51,532)
Both indices formed bullish candles with long lower wicks (buying at lows) but stayed below key MAs, showing bearish momentum.
OPTIONS DATA HIGHLIGHTS
Nifty Calls — Max OI at 24,000 (1.26 Cr contracts) → strong resistance; heavy call writing at 24,000/24,200.
Nifty Puts — Max OI at 23,000 (1.24 Cr) → major support; strong put writing at 23,400.
PCR — Rose to 1.24 (from 1.01) → bullish sentiment (more put selling).
Bank Nifty — Max call OI at 55,000; max put OI at 53,000.
OTHER POINTS
🔹 India VIX — 19.63 (rising); risk for bulls if >20.
🔹 Market Breadth — Mixed: 34 long build-up, 77 long unwinding, 74 short build-up, 27 short covering.
🔹 F&O Ban — Kaynes Technology India, SAIL.
🔹 Funds Flow — Recent sessions saw institutional buying (FIIs DIIs).
TECHNICAL TAKEAWAY
Short-term weakness persists despite recovery candle. Bulls need sustained move above 23,800–24,000 for strength. Bears target below 23,400. Watch global cues, oil prices, and rupee weakness.
#TradeSetup #Nifty50 #BankNifty #OptionsData #IndiaVIX #TechnicalLevels #Markets
Disclaimer :
The information provided is for general informational purposes only and should not be construed as financial, investment, legal, or tax advice. Past performance is not indicative of future results. Each investor’s circumstances are unique; therefore, you should consult a qualified professional before making any financial commitments. While every effort has been made to ensure accuracy, I assume no liability for any errors or for outcomes resulting from the use of this information.
2
330

Apr 27
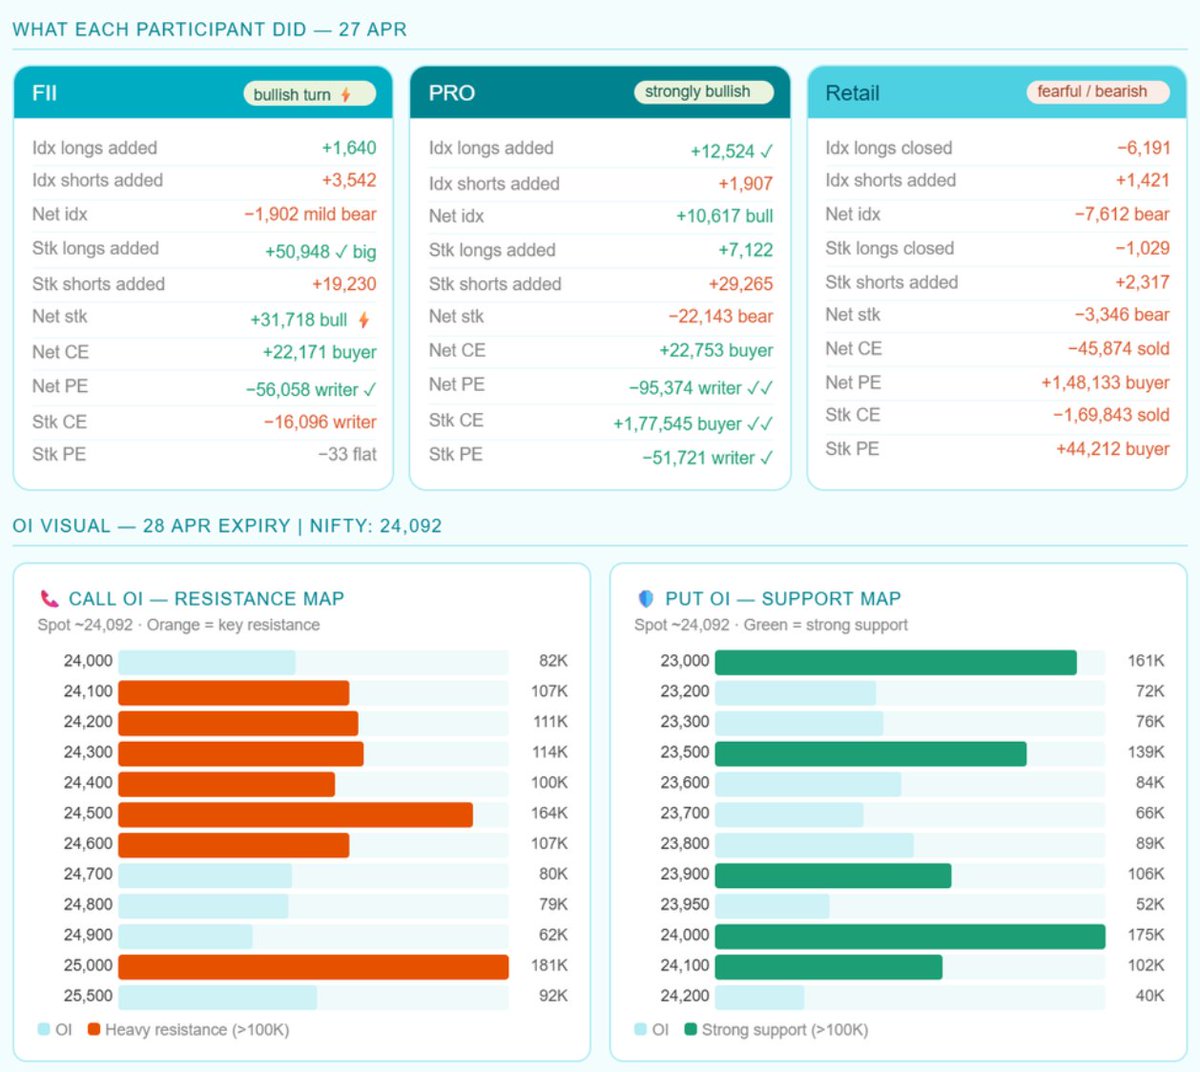
#ThinkAboutit💡
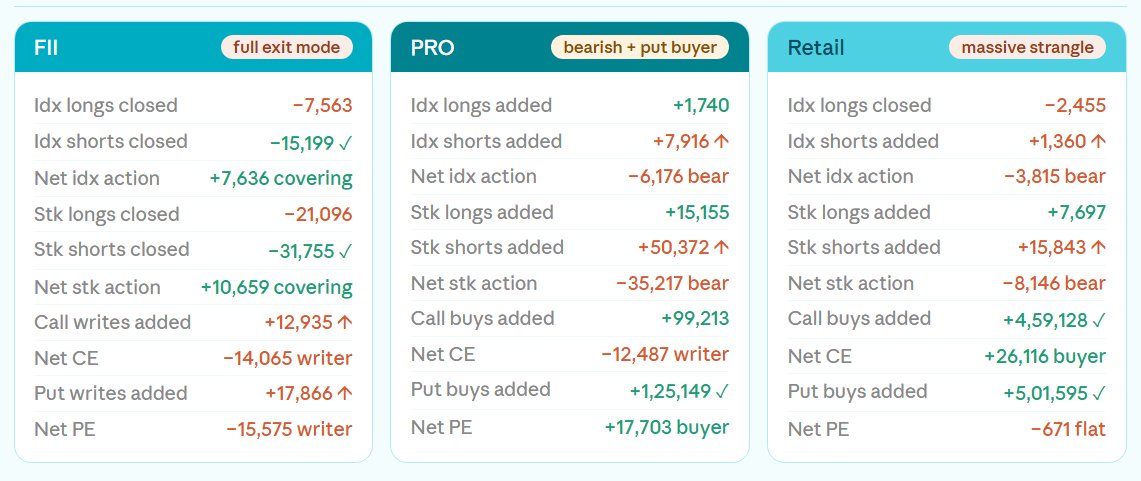
PRO wrote 95,374 puts on Apr 27 (betting market won't fall) while simultaneously keeping stock futures net short (−22,143).
If PRO is bullish enough to write puts at this scale, why are they still short stocks via futures? Are they confused --- or is there a precise strategy at work?
#Nifty #FII #PRO #OptionsData #SmartMoney #Volatility #MarketOutlook #ThinkAboutit
1
3
285
Apr 21
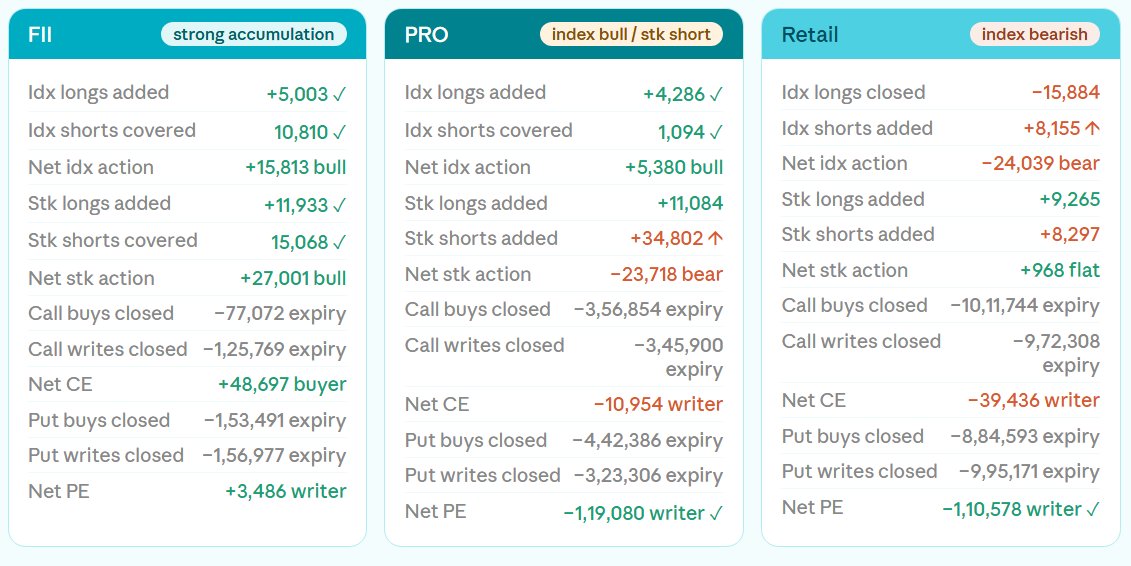
NSE Participant Data - 21 Apr 2026 | Weekly Expiry Day
Weekly expiry day --- millions of options closed across all participants. Ignore the options noise and focus on the futures: FII covered 10,810 index shorts AND 15,068 stock shorts while adding longs on both. Strongest single-day accumulation signal in weeks. 28 Apr series option chain sets new range: 24,000 floor, 25,000 ceiling.
think about it
FII has now been consistently accumulating index and stock longs for several sessions while PRO refuses to cover its stock shorts despite being bullish on the index. If both are smart money - why does one believe in stocks and the other doesn't? And which one will be forced to change their view first?
#Nifty #FII #PRO #OptionsData #SmartMoney #Volatility #MarketOutlook #ThinkAboutit #Discovery #Stocomotive
1
3
265

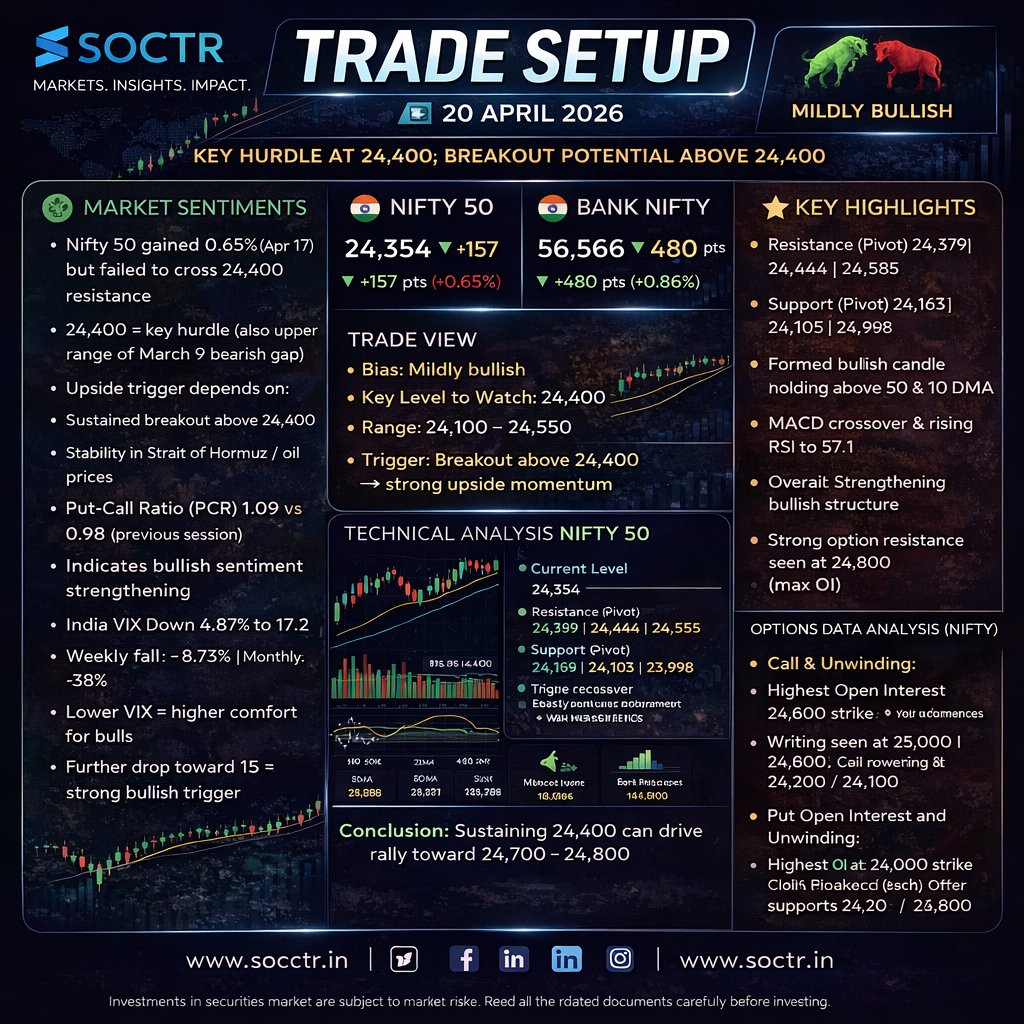
24,400 = The BATTLE ZONE ⚔️📊
Nifty holds strong, momentum building… but breakout is the real game 🔥
👉 Sustain above 24,400 = Rally toward 24,700–24,800
👉 Fail here = More consolidation
💡 VIX cooling PCR rising = Bulls gaining confidence
⚠️ But resistance still heavy near 24,800
Smart traders wait for confirmation… not emotions 👀
#Nifty50 #BankNifty #StockMarketIndia #TradeSetup #TechnicalAnalysis #OptionsData #DalalStreet #Investing #MarketOutlook #Soctr
2
114
Apr 17
NSE Participant Data 17 Apr 2026
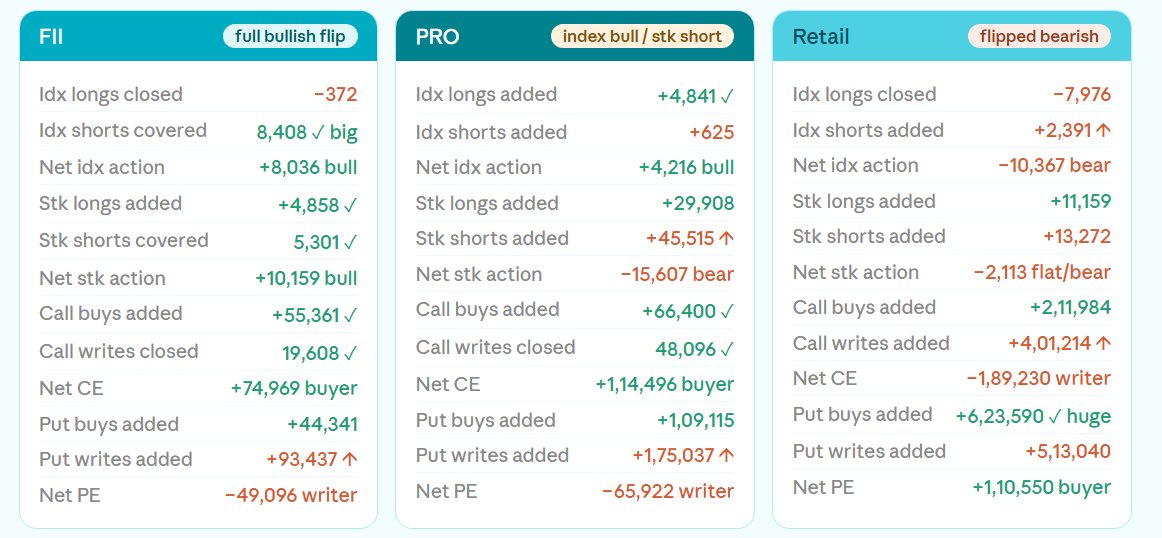
FII makes a dramatic complete reversal... covering all index shorts, buying calls, writing puts. PRO also turns bullish on index and closes call writes. Retail flips bearish after being aggressively bullish yesterday. Option chain confirms: resistance walls at 24,000–24,400 are being demolished by call writers covering. 24,800 is now the last ceiling.
#Nifty #FII #PRO #OptionsData #SmartMoney #Volatility #MarketOutlook #ThinkAboutit
2
7
334
Apr 15
NSE Participant Data : 15 Apr 2026
Smart money confused, market amused 😂
Ab price action hi batayega kaun zyada confident hai
#Nifty #FII #PRO #OptionsData #SmartMoney #Volatility #MarketOutlook #ThinkAboutIt
1
3
437

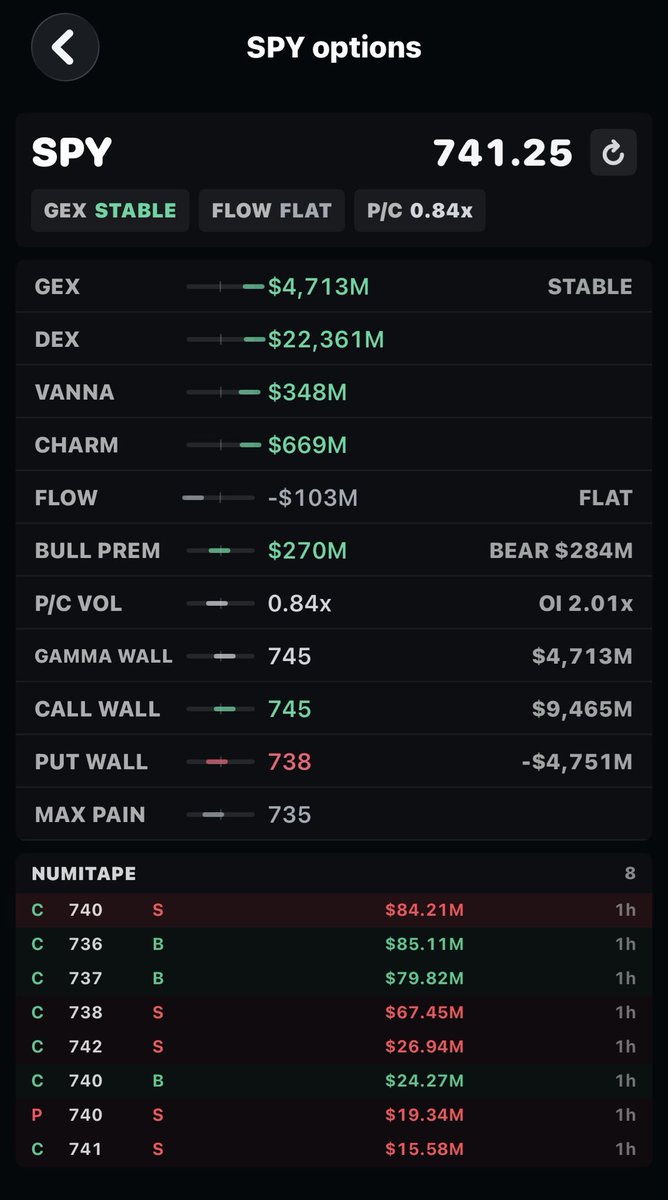
*#Nifty spot*
🌄*Data at 10:27 am*
✅*Strike 24500*
CE 49 lakh
PE 9 lakh
*Difference 40 lakh*
(Bearish)
✅*Strike 24300*
CE 43 lakh
PE 21 lakh
*Difference 22 lakh*
(Bearish)
✅*Strike 24200*
CE 53 lakh
PE 62 lakh
*Difference 9 lakh*
(Bullish)
✅*Strike 24000*
CE 22 lakh
PE 44 lakh
*Difference 22 lakh*
🌄*Conclusion*
Nifty looks buy on dips
*Strong Resistance 24340-24350*
Cmp 24260
#Nifty #Nifty50 #StockMarketIndia #IndianStockMarket #ShareMarket #StockMarketLive #NiftyTrading #OptionTrading #OptionsData #MarketAnalysis #IntradayTrading #SwingTrading #BankNifty #FuturesAndOptions #TechnicalAnalysis #StockMarketTips #TradingStrategy #BullishMarket #BearishMarket #MarketTrends #StockMarketNews #DalalStreet #WealthCreation #InvestingIndia #RetailTraders #SmartMoney #PriceAction #MarketUpdate #LiveTrading #ChartAnalysis #SupportAndResistance #BreakoutTrading #TrendFollowing #OptionsTradingIndia #NiftyLevels #StockMarketLearning #FinancialFreedom #PassiveIncome #TraderLife #MarketPulse #IntradaySetup #StockMarketEducation #TradeSmart #RiskManagement #MomentumTrading #Scalping #MarketInsights #TradingCommunity #NiftyUpdate
3
4
270
Apr 8
#Nifty 50 Technical View (Closing Basis) (April 7, 2026)
The Nifty 50 reclaimed the 23,000 mark and closed at 23,123.65.
This marks the fourth consecutive session of gains.
PRICE ACTION
The index gained 155.40 points ( 0.68%) on the day.
It closed firmly above the psychological 23,100 level.
This indicates strengthening short-term momentum.
TREND VIEW
Sustaining above 23,000 confirms a mean-reversion recovery.
The index is rebounding from previously oversold conditions.
Short-term bias is improving but not yet fully bullish.
RESISTANCE LEVELS
Immediate resistance is placed at 23,150–23,200.
This zone saw intraday selling pressure.
Crucial resistance stands at 23,500.
A decisive close above this level is required for trend reversal.
This aligns closely with the 20-day EMA.
SUPPORT LEVELS
Immediate support is at 22,900–22,850.
Holding this zone is key for sustaining momentum.
Major support is at 22,500.
A breakdown below this level would negate the recovery.
INDICATORS
The index is trading above its 10-day SMA.
This reflects a positive shift in short-term trend.
RSI has moved up to the 42–45 zone.
This suggests exit from deeply oversold territory.
VOLATILITY CHECK
India VIX declined ~3% and is now below 25.
This signals easing market anxiety.
Positioning remains cautious ahead of key events.
DERIVATIVES DATA
Call Open Interest is concentrated at 23,200 and 23,500.
These levels act as near-term ceilings for expiry.
Options data indicates supply at higher levels.
OVERALL BIAS
The setup remains Sideways to Cautiously Positive.
As long as the index holds above 22,800–22,900, the recovery stays intact.
Sustained breakout above 23,500 is needed for a stronger bullish confirmation.
#Nifty50 #StockMarketIndia #TechnicalAnalysis #NSE #TradingView #MarketUpdate #OptionsData #IndiaVIX #RSI #SupportResistance #SwingTrading #Investing2026
2
203
Apr 7
#Nifty 50 Shows Strong V-Shaped Recovery – April 6, 2026 📈
The Nifty 50 staged a resilient V-shaped recovery, reclaiming key psychological levels after a volatile start to the session.
📊 Technical Summary
Candlestick Pattern: Formed a small bullish candle with a long lower wick, signaling aggressive buying at lower levels
Gap Action: Successfully filled the opening gap-down, reinforcing the return of a buy-on-dips sentiment
Closing Strength: Settled at 22,968.25, near the day’s high of 22,998, just below the crucial 23,000 mark
📉 Trend & Indicators
Moving Averages: Still trading below
▸ 20-day SMA: 23,440
▸ 50-day SMA: 24,659
→ Indicates cautious intermediate trend
RSI (Relative Strength Index): At 37.56, rising from oversold territory but still below the neutral 50 level
Volatility: India VIX remains elevated near 25.52, suggesting continued sharp price swings
📌 Key Levels to Watch
Support: 22,450 – 22,500 (strong base forming)
Resistance:
▸ Immediate: 23,000 – 23,100
▸ Major: 23,500
📐 Technical Context
The rebound aligns with a relief bounce from the 78.6% Fibonacci retracement level
Derivative Data: Strong Put writing at 22,500 & 22,600 reinforces a solid floor for the current expiry
#Nifty50 #StockMarketIndia #TechnicalAnalysis #TradingView #MarketOutlook #DalalStreet #Fibonacci #RSI #OptionsData
1
2
265
We already anticipated pullback @12:30 in 'Superfast Futures' show
➡️ What we said at 12:30
→ Heavy positions by Call traders & Put buyers at 22,200
→ If market sustains → short covering can trigger buying in market
———x
➡️ What happened 👀
→ Nifty sustains & closed above 22,700 🚀
→ Bears forced to cover positions
———x
⚡ Takeaway:
→ Classic option trap → short covering rally
→ Momentum driven by positioning, not fundamentals
#Nifty #OptionsData #ShortCovering #FOMarket #StockMarket #superfastfutures
4
163

Mar 25
Nifty pulling back from 23430 → 23350, but OI data still favors bulls.
15-min Change in OI shows:
• Strong Put build-up (~60%) vs Calls (~39%)
• Heavy support formation near 23150–23250 zone
• Call writing seen higher around 23450–23600
Interpretation: Current dip looks like profit booking, not trend reversal.
Buyers still active on lower levels.
Key Intraday Levels:
Support: 23300 / 23200
Strong Support: 23150
Resistance: 23450 / 23550
View:
As long as 23200 holds, trend remains positive.
Expect range-bound to bullish price action after this dip.
Strategy:
Buy on dips near support, avoid chasing highs.
#Nifty #OptionsData #Intraday #Trading
1
147

Mar 23
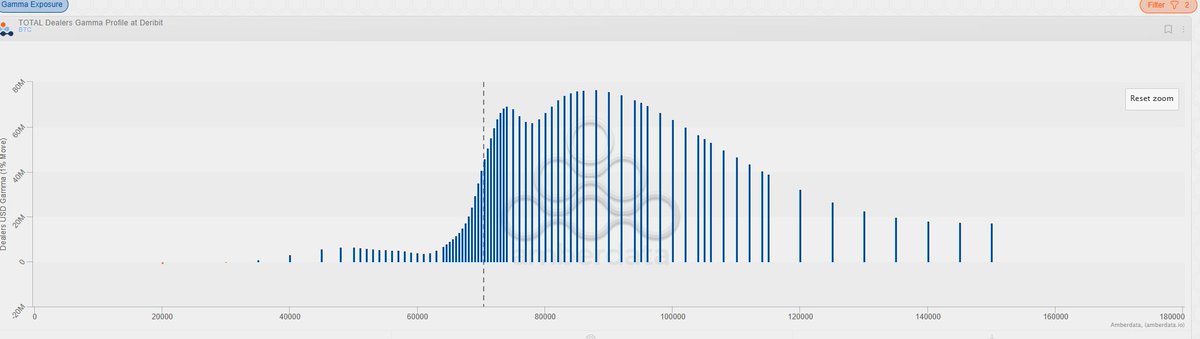
จับตา $ 67-68,000 ห้ามหลุด! ถ้าประคองตัวยืนได้ เป้าหมายถัดไปคือการทะลวงด่าน $80K เพื่อไปหาเป้าใหญ่ที่ $90K ครับ 🚀
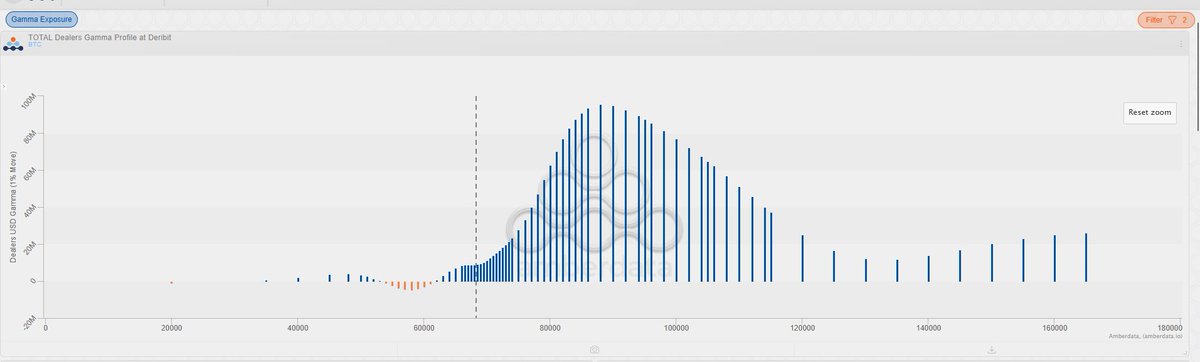
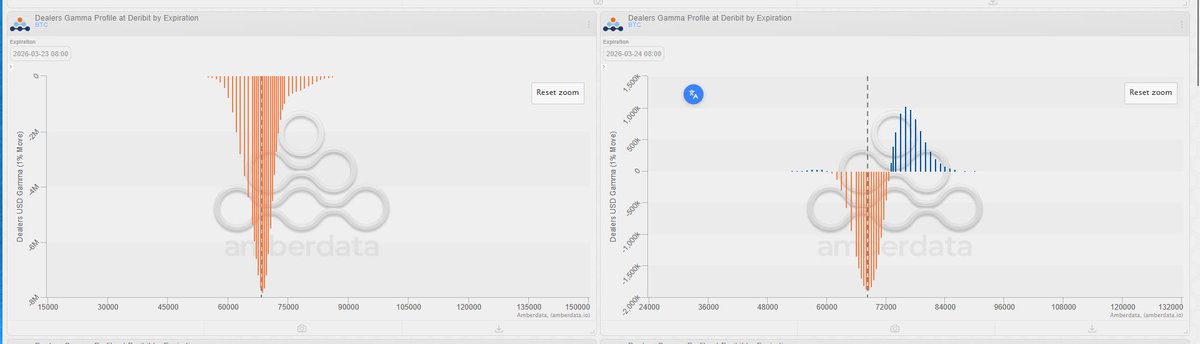
📊 BTC Gamma Profile: 12/03/2026 vs 23/03/2026
จังหวะ "เตรียมเลือกทิศทาง" ครั้งใหญ่!
เทียบโครงสร้าง Dealers ที่ Deribit ระหว่างกลางเดือนกับปัจจุบัน เห็นสัญญาณการบีบตัวเพื่อรอ Breakout ที่ชัดเจนมากครับ:
🔍 1. จาก "กระจายตัว" สู่ "การบีบอัด" (Compression):
• 12/032026: Long Gamma กระจายตัวกว้าง (ยอด ~$80M) ตลาดดูผ่อนคลายกว่า
• ปัจจุบัน (23/03/2026): กองกำลังสถาบันมาสู้กันหนาแน่นที่ $90,000 (พุ่งแตะ $100M ) นี่คือกำแพงเหล็กที่ "รอทดสอบ" ในขาขึ้นรอบถัดไป
🚦 2. Flip Zone ขยับต่ำลง = บีบให้เลือกข้าง:
• จุดวัดใจ (Flip Zone) ขยับจาก $70,000 ลงมาอยู่ที่ $68,000
• ราคาปัจจุบันคลอเคลียจุดเปลี่ยนเลนพอดี บ่งบอกว่าตลาดกำลัง "เตรียมเลือกทิศทาง" ครั้งสำคัญ หากยืนเหนือ $68K ได้มั่นๆ แรง Short Gamma จะเปลี่ยนเป็นแรงส่งฝั่ง Long ทันที
🎯 มุมมอง : มีโอกาสไปทางไหนมากกว่า?
หากดูจาก CME Options ประกอบกับ Deribit Gamma ผมให้น้ำหนักไปทาง "Bullish (ขึ้น)" มากกว่า ด้วยเหตุผลดังนี้:
1. Short-term Call Demand: ฝั่ง CME มีแรงซื้อ Call Option มากกว่า Put ถึง 2 เท่าในระยะสั้น (5D)
2. Long-term Target: กำแพง Gamma Wall ที่ $90K - $100K หนาแน่นขึ้นเรื่อยๆ สะท้อนว่า Smart Money เริ่มวางเป้าหมายทำกำไรไว้ที่โซนบนเรียบร้อยแล้ว
3. Gamma Stabilization: หากราคาข้ามผ่าน
$75,000 ไปได้ จะเข้าสู่โซน Positive Gamma หนาแน่น ซึ่งจะช่วยพยุงราคาให้เสถียรและดันขึ้นไปหาเป้าหมาย $90K ได้ง่ายกว่าเดิม
#Bitcoin #BTC #Deribit #GammaExposure #OptionsData #CryptoTrading #TechnicalAnalysis #BTCUpdate
Mar 12

🧵 Dealer Hedge น้อย = อันตรายที่หลายคนมองข้าม
รู้ไหมว่า ตอนนี้ BTC อยู่ในโซนที่ "ไม่มีใครกันกระแทก"ทั้งขึ้นสุดลงสุด ในช่วงนี้"
มาทำความเข้าใจกัน 👇
1/ 🏦 Dealer คือใคร?
Options Dealer หรือ Market Maker คือสถาบันที่ ขาย Options ให้นักลงทุนทั่วไป
ทั้ง Call และ Put
พอขายไปแล้ว → Dealer แบกรับความเสี่ยงจาก Delta ไว้เอง
2/ ⚖️ แล้ว Delta Hedging คืออะไร?
Dealer ขาย Call BTC ให้ลูกค้า → Dealer มี Short Delta (ถ้า BTC ขึ้น Dealer ขาดทุน) → Dealer ต้อง ซื้อ BTC จริงๆ เพื่อ offset ความเสี่ยง
นี่คือ Delta Hedging ทำให้ Dealer เป็น กันชน ของตลาดโดยไม่รู้ตัว
3/ 📐 Gamma บอกว่า Dealer ต้อง Hedge มากแค่ไหน
Gamma สูง = ราคาขยับ 1% → Delta เปลี่ยนมาก → Dealer ต้อง rebalance ถี่มาก
Gamma ต่ำ = ราคาขยับ 1% → Delta แทบไม่เปลี่ยน → Dealer นิ่งเฉย ไม่ต้องทำอะไร
4/ 💥 "Dealer Hedge น้อย" ในทางปฏิบัติ
เมื่อ Gamma ต่ำ (โซนต่ำกว่า $69K) :
ราคา BTC ขยับ → Delta ของ Dealer แทบไม่เปลี่ยน → Dealer ไม่ต้อง Buy หรือ Sell BTC → ไม่มี "แรงดูดกลับ"→ ราคาวิ่งได้อิสระ ทั้งขึ้นและลง ไม่มีแรงพยุง
เหมือนรถที่ ไม่มีโช้คอัพ วิ่งบนถนนขรุขระ 🚗💨
5/ 🗺️ โครงสร้าง Gamma ของ BTC ตอนนี้
🔴 ต่ำกว่า $69K → Gamma ต่ำมาก ราคาผันผวนสูง วิ่งได้เร็วมาก
🟡 $69K–$80K → Gamma กำลังเพิ่ม Dealer เริ่ม hedge → มีแรงต้านบ้าง
🟢 $80K–$95K → Gamma Peak ราคาติด range Dealer hedge หนัก ดูดกลับตลอด
ตอนนี้ BTC ~$70K อยู่ตรงขอบล่างของ Gamma Ramp ⚠️
6/ 🎯 แล้วทิศทางจะไปไหน?
ขาขึ้น
🟢 : ถ้าทะลุ $73,300 ได้ → เปิดทางสู่ $80,700 และยิ่งราคาขึ้น Gamma ยิ่งสูง → Dealer ต้อง buy delta ตาม → เป็น tailwind ให้ราคาวิ่งต่อ
ขาลง
🔴 : ถ้าหลุด $69K → เข้าโซน Gamma ต่ำ ไม่มีแรงพยุง ราคาวิ่งได้รุนแรงมาก เป้าหมายถัดไปคือ $65K และ $60K
7/ 📌 Key Levels ที่ต้องจับตา
🔵 $73,300 → Breakout signal
🔵 $70,906 → Resistance ใกล้สุด
🟡 $69,000 → Gamma Floor / แนว support
🔴 $65,000 → ถ้าหลุด = bearish ชัดเจน
🔴 $80,000 → Peak Gamma Wall ราคาจะเริ่มติด
8/ 🧠 สรุป
Gamma Profile ไม่ได้บอกทิศทาง แต่บอก "โครงสร้างของตลาด"
โซนที่ Gamma ต่ำ = ตลาดเปราะบาง ระวังการเคลื่อนไหวแบบ spike
โซนที่ Gamma สูง = ตลาดมีเสถียรภาพ แต่ราคาจะวิ่งช้าลง
ตอนนี้ BTC อยู่ ระหว่างสองโลก 👁️
4
253

Mar 20
F&O Market @ 12:30 📊⚖️
NIFTY
➡️ Buying after yesterday’s sharp sell-off 📈
➡️ Move remains range-bound 🤏
➡️ Trading within previous session range
➡️ Need close above 23,380 (prev high) for directional move 🚧
➡️ RIL buying offset by HDFC Bank selling
→ ( 60 / -50) ⚖️
📊 Option Chain
➡️ Max Call Buying @ 23,300
➡️ Max Put Writing @ 23,200
———x
NIFTY BANK
➡️ Buying seen after sharp fall 📈
➡️ Hovering near 54,000 psychological level ⚠️
📊 Futures Data
➡️ OI -1.7% → Short Covering 🔄
⚡ Setup: Relief bounce, but needs breakout above key levels for trend
#FOMarket #Nifty #NiftyBank #OptionsData #superfastfutures
3
157

Key Observation from the Total Open Interest (TOI) Framework
One recurring pattern we have observed using the Total Open Interest (TOI) indicator — developed at Definedge with AP Sir — is related to data sufficiency for EMA calculations.
📊 Observation:
Whenever TOI does not have sufficient data from the last 5 trading sessions, the system is unable to plot the 10-day & 30-day EMA and their respective spread.
⚠️ What happens next?
Historically, such situations often occur near market exhaustion points, where the ongoing trend struggles to sustain momentum.
In several instances, this has been followed by:
• Market halting the current move
• Loss of directional strength
• Potential reversal or sharp mean reversion
📌 Current Context
In yesterday’s data:
• TOI → Unable to plot its EMA
• CE Spread → Also unable to plot its EMA
This rare data condition is worth monitoring closely as it may signal a possible turning point in market direction.
⏳ Keeping fingers crossed for a reversal setup.
Nishesh Jani,CFTe
#OptionsData
#OpenInterestAnalysis
#MarketStructure
#Definedge
#DerivativesTrading
#Nifty
#InstitutionalData
#TradingInsights
#nsiheshjani #AhmedabadNest
@ap_pune @Definedge

1
16
4,155