
23 Aug 2025
Future Signal for Bitcoin (BTC)
Current Price: $114.7K
Position: LONG ✅
Reasoning: Strong base at $110K–$112K. As long as it doesn’t lose $110K
Stop Loss: $110K ❌
T.P1 ($118K) 🎯
T.P2 ($120K)🎯
T.P3 ($124K)🎯
#BTCUSDT #CryptoTrading #Bitcoin #technicaloverview
44

11 Feb 2025
I'm flexible and eager to discuss this further. #Web3Identity #ZKPs #DecentralizedIdentity #TechnicalOverview

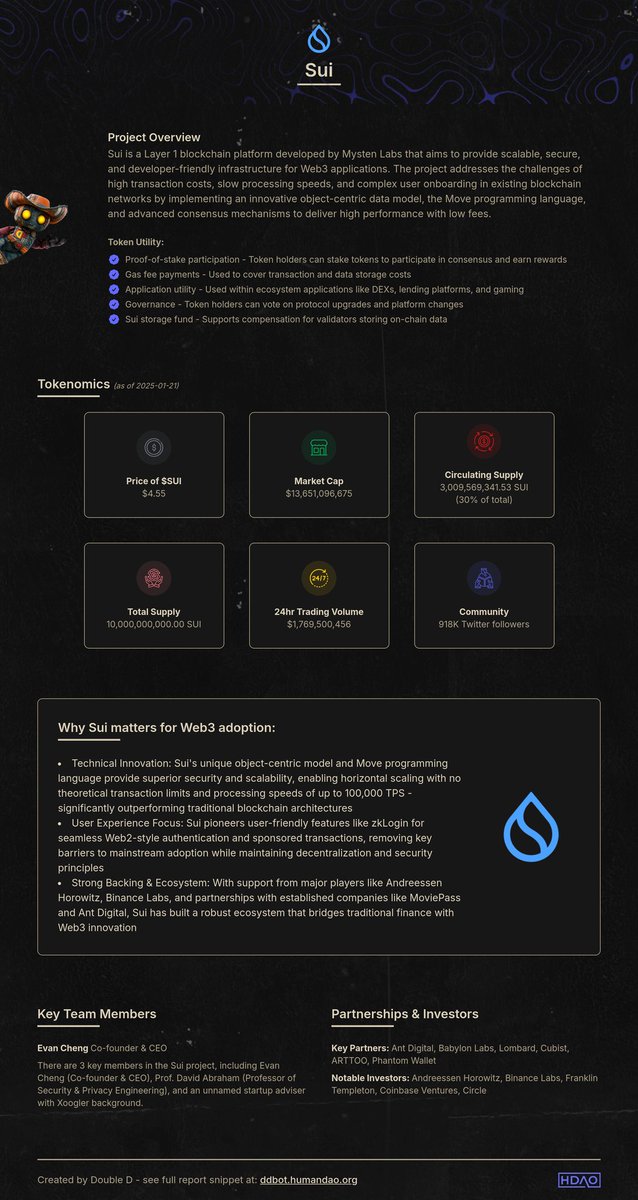
$SUI TechnicalOverview 💥
Long-term Trend: Bullish 🐂
The weekly chart shows an impressive uptrend since August 2023, with $SUI moving from $0.50 to above $4.50. However, we’re currently in a short-term consolidation phase.
Key Levels:
🔹 Support: $4.20-$4.30 (Watch for potential buying opportunities)
🔹 Resistance: $5.00-$5.20 (Breaking this could fuel more upside)
Indicators:
🔸 RSI: 46.91 (Neutral Momentum)
🔸 1-day MA: Price above both 20 & 50-day MAs, signaling bullish trend
Current Opportunity:
At $4.53, $SUI is nearing the lower end of the range, suggesting a potential entry point near support, but be cautious with stop losses below $4.20.
🚨 What’s Next?
🔹 A bounce from $4.20-$4.30 could confirm buying interest.
🔹 A break below $4.20 could signal further downside.
🔹 A rise above $5.20 could push the uptrend forward.
Double D analysis shows a strong long-term outlook, but short-term volatility calls for careful entry and risk management. 📊 #Crypto #Blockchain #trading #SUI
3
6
323

21 Aug 2024
#TechnicalOverview
4/ 🔍 By linking NFTs to metadata and assets stored on IPFS, creators ensure long-term accessibility and integrity of their digital assets.
1

25 Dec 2023
"Just read this technical overview of the AV1 video codec. It breaks down the coding tools in the spec. A must-read for all video nerds out there! 🤓 #AV1 #VideoCodec #TechnicalOverview" github.com/QuPengfei/Technic…
13

31 Aug 2023
Il 4 ottobre ritorna #EngageYourPeople!
Ovviamente, noi di Allos | Part of Fiven non mancheremo e con la partecipazione del nostro CEO Vincenzo De Giovanni, porteremo la nostra #technicaloverview su tutto ciò che riguarda l'area #Learning.
Iscriviti subito bitly.ws/TyV6

11

14 Apr 2023
🎉 Celebrating the birth Anniversary of the renowned social reformer and leader, BABASAHEB.
#Celebrating #BirthAnniversary. #Ambedkar #india #enjoy #freedome #women #happyness #RedHat #OpenStack #CL010 #CloudComputing #TechnicalOverview #CloudInfrastructure #Virtualization

2
67

14 Apr 2023
🎉 Celebrating the birth Anniversary of the renowned social reformer and leader, BABASAHEB.
#Celebrating #BirthAnniversary. #Ambedkar #india #enjoy #freedome #women #happyness #RedHat #OpenStack #CL010 #CloudComputing #TechnicalOverview #CloudInfrastructure #Virtualization

38


of applications.
If you want to learn more about how Data Flows work in the Ownity Protocol, check out the technical overview in our documentation. #OwnityProtocol #DataFlows #TechnicalOverview
5

29 Jan 2023
Cardano Price Analysis: What to Expect in the Next 48 Hours
#CoinEdition #Cardano #PriceAnalysis #TechnicalOverview
coinedition.com/cardano-pric…
19

25 Jan 2023
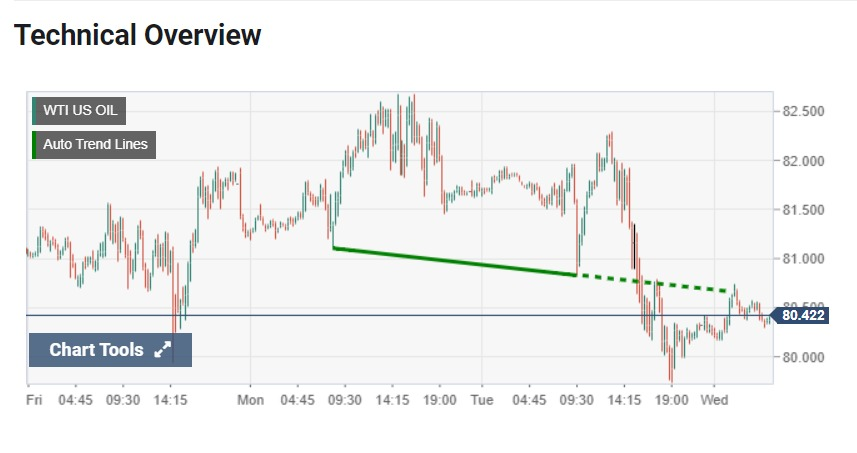
#WTI stays defensive above $80.00 on mixed economic concerns, EIA Crude Oil Stocks Change eyed..
#forex #forextrading #WTI #technicaloverview #usoil
116

27 Oct 2022
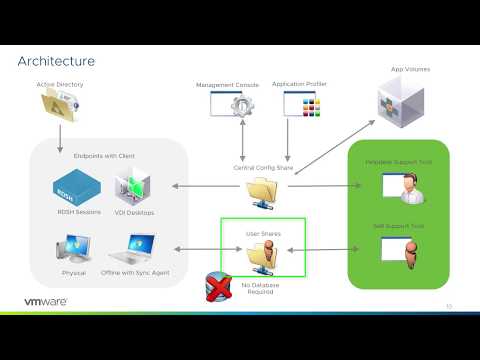
VMware Dynamic Environment Manager: Technical Overview #euc #vmware #endusercomputing #horizon #horizon7 #JMP #technicaloverview #userenvironmentmanager
tinyurl.com/25lbuqho
25 May 2022
VMware Dynamic Environment Manager: Technical Overview #euc #vmware #endusercomputing #horizon #horizon7 #JMP #technicaloverview #userenvironmentmanager
tinyurl.com/2y9nlkos

1

18 May 2022
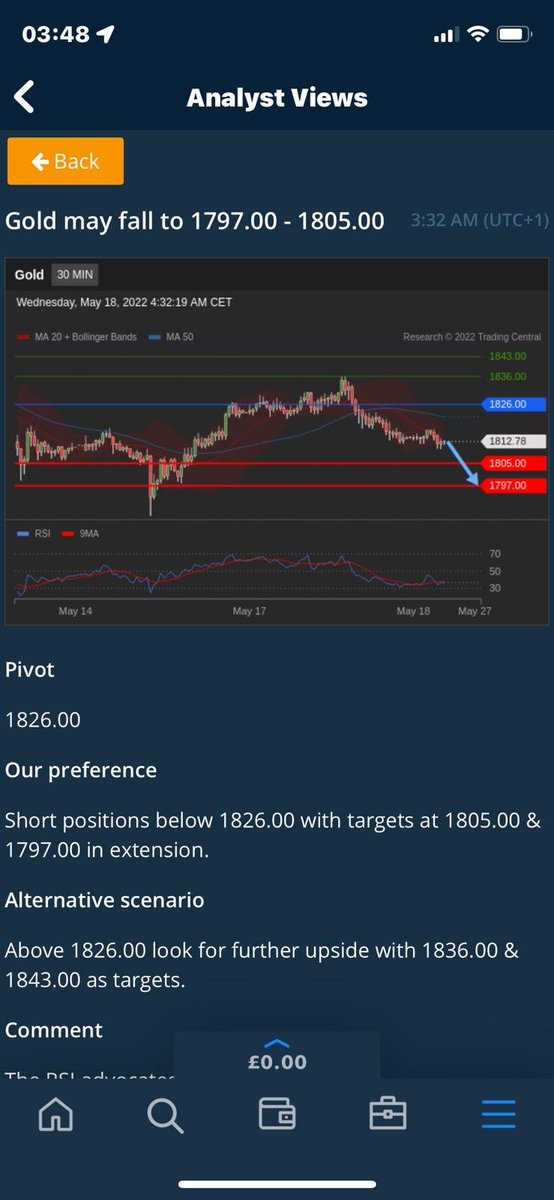
XAUUSD TECHNICAL VIEW.🔥
DM me for more info. @ t.me/jianajohn
#XAUUSD #gold #comexmarket #goldtrading #technicaloverview #commodities

28 May 2021
#NVMeoF Resources via The Cloud Platform Tech Zone @VMwarevSphere #Storage #TechnicalOverview #Deploy #Manage @VMware dy.si/RD9jyy

2 May 2021
Technical overview of the week of Nifty 50 in a minute.
Worried about a dip? Don't be, because every dip will be a buying opportunity as the long-term trend remains intact
#technicaloverview #nifty50 #marketatglance #niftytrend #trend #indianstockmarket #stockmarket #marketnews

5 Feb 2021
vRealize Automation (vRA) 8.3 is the first 8.x version in our move to quarterly releases for on premises installations. #vra #technicaloverview dy.si/M9E2K
1