
May 24
🚨 THE BLOCKCHAIN RAILS ARE HERE... And Every Major Institution Is Quietly Panicking
Why are BlackRock, JPMorgan, Visa, governments, and tech giants ALL racing to build on the "Everything Code" infrastructure?
This isn’t another crypto bull run.
This is the moment blockchain becomes the new operating system for the entire financial world and everything else.
Think about it:Trillions in value moving at light speed with zero middlemen
Real-time settlement replacing 3-day bank wires
Programmable money that follows rules automatically
Assets, identity, contracts, and data all living on unbreakable rails
They’re not calling it “crypto” anymore. They’re calling it The Everything Code.
The institutions that control the old world are now building the new one, because they know if they don’t, someone else will.
The rails are being laid right now.
The question is: Will you be riding them… or watching from the platform
Drop a like if you’re ready for the infrastructure revolution #Blockchain #TheEverythingCode #Crypto #Finance #Web3
Apr 20

🚨 OMG: #SUI Just Pulled a Knife in the Back on #Ripple With a SECRET GOVERNMENT DEAL!
While #Ripple was busy playing regulator games and pushing for $XRP approval... $SUI quietly locked in a MASSIVE behind-the-scenes partnership with the government for QUANTUM-PROOF TRANSACTIONS that even quantum computers can’t crack!
No leaks.
No announcements.
Just pure stealth mode.
Is the U.S. government choosing SUI as its unbreakable blockchain weapon?
Are #XRP holders are about to get left in the dust???
This changes EVERYTHING in crypto.
Drop your thoughts and smash if you’re riding the quantum wave! #SUI #SuiNetwork #Ripple #XRP #QuantumProof #Crypto #GovernmentCrypto #ToTheMoon
7
19
1,244

19 Dec 2025
Thank you!
@RaoulGMI and @BittelJulien’s work on #TheEverythingCode is incredible alpha.
No, it doesn’t fit in a single tweet—that’s why CT often doesn’t know what to do with it.
But this community does 🔥
19 Dec 2025

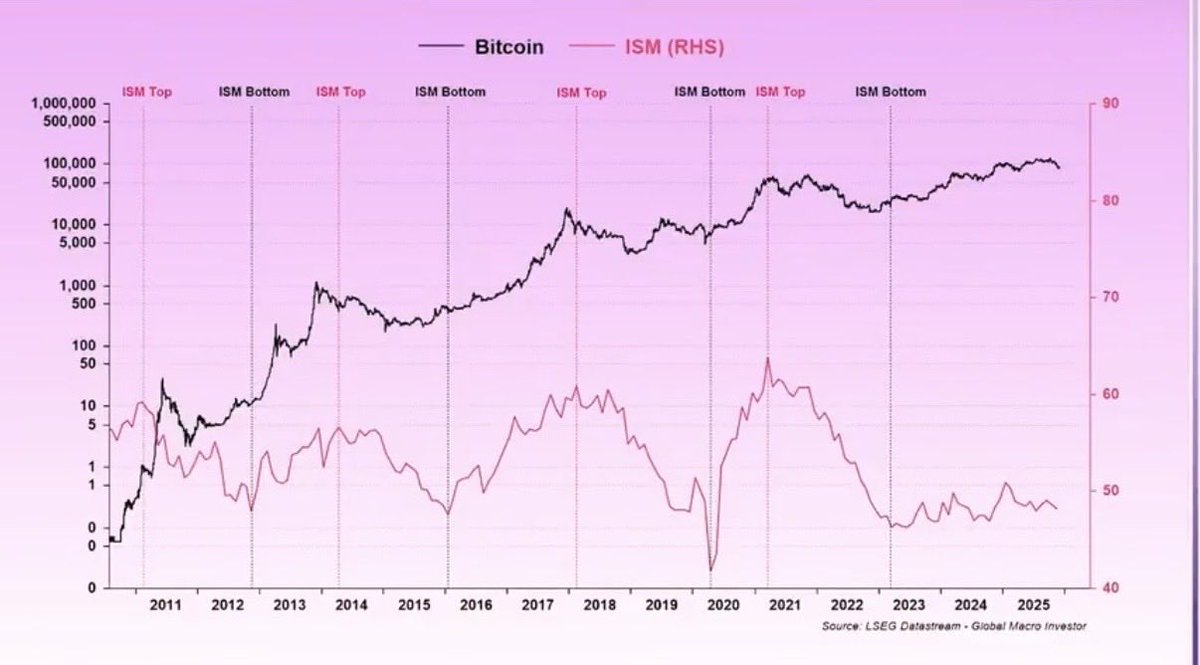
Truthfully, @RealVision have been speaking about the ISM for years.
Quite literally, years.
It went largely under the radar at the time because it fit the “4 year cycle” narrative.
A narrative, is all the 4 year cycle ever was. This chart proves it.
Now the disparity between Bulls & Bears is more prevalent than ever, the majority have been looking for a reason why.
Those who believe there is something more than the simplicity of a 4 year cycle, are leaning in to the ISM more.
They are looking at the bigger picture of adoption, institutional buying, the TGA, FED spending, Debt buybacks and everything in between.
In my opinion, rightly so.
The mechanics of price are governed by liquidity.
In 2026, you will see why.
The RV platform is now upgraded and the clarity is immaculate.
To stay one step ahead of the curve, to see what comes next, BEFORE these charts start doing the rounds on X, click below and start your journey today. 🤝
5
5
81
10,339
16 Dec 2025
51
112
619
70,730
26 Oct 2025
📊 Crypto doesn’t move with headlines — it moves with the business cycle. @RaoulGMI and @BittelJulien on #TheEverythingCode
When ISM pushes above 50, capital flows out of BTC and into riskier altcoins as confidence returns.
30
118
656
48,135
25 Oct 2025
⏰ Central banks are always late — and markets know it. @RaoulGMI and @BittelJulien on #TheEverythingCode
Despite rising inflation, rate cuts keep coming. Are we reading the wrong signals?
24
71
254
33,872
24 Oct 2025
💸 Liquidity explains everything — and the rest is just noise. @RaoulGMI and @BittelJulien on #TheEverythingCode
From Bitcoin to tech stocks, one macro variable dominates 90–96% of price action.
21
54
370
28,509
24 Oct 2025
Watch the full video on #TheEverythingCode:
youtube.com/watch?v=X_PkXDje…
11
17
57
16,749
24 Oct 2025
🧩 The secret sequence driving markets: financial conditions → liquidity → ISM.
@RaoulGMI and @BittelJulien break down how #TheEverythingCode can give you a 9-month lead on the economy 👀
23
55
251
28,581
23 Oct 2025
23 Oct 2025

Huge thanks to everyone who joined my session on The Everything Code and to the awesome @Zebu_live team for putting on such a great event.


6
17
89
15,127
7 Oct 2025
🍌 The Banana Zone is back — and we’re still early. @RaoulGMI and @BittelJulien on #TheEverythingCode 2025 Update.
Phase 2 is unfolding now, with crypto markets primed for another potential breakout as liquidity trends shift.
27
29
308
35,660
6 Oct 2025
📉 The business cycle just got longer — and markets haven’t caught on yet.
Extended debt maturity may delay the downturn, reshaping macro outlook and muting crypto performance.
@RaoulGMI and @JulienBittel on #TheEverythingCode 2025 Update.
18
44
410
35,794
1 Oct 2025
🔄 Since 2008, markets run on a hidden 4-year debt refinancing cycle. @RaoulPal and @BittelJulien on #TheEverythingCode
Governments’ zero interest rates reset debt, syncing all assets to money printing cycles.
11
8
104
11,400
1 Oct 2025
1 Oct 2025

Looks like everyone is catching up to what @RaoulGMI @BittelJulien of @RealVision been saying for couple of months now..
9
23
16,651
30 Sep 2025
💸 Interest payments are outpacing growth — and that breaks the system. @RaoulGMI and @BittelJulien on #TheEverythingCode
When debt levels are this high, the only option left is to monetize… and that means currency debasement.
10
29
238
18,810
19 Aug 2025
⏳ The cycle isn’t broken—it’s just been delayed.
High rates have pushed #TheEverythingCode out by a year, reshaping the entire macro landscape.
Don’t miss the latest episode of Shooting The Sh!t with @RaoulGMI and @BittelJulien.
13
31
370
26,117

9 Jun 2025
$BTC #TheEverythingCode
💎🙌 📈🚀🌑💲💰
#SOFTWAR 🇺🇸⚡️🦌
#BTC #Bitcoin #Titcoin #SXT #SUI #WAL #ATH #Aethir #Buckazoids #USDUC #USDUCeth #Sha256 #Bullrun #CryptoBullrun #Crypto #Blockchain #DeFi #DePIN #RWA #AI #DigitalAssets #Stocks #Macroeconomics #HODL #MSTR #21Shares
9 Jun 2025
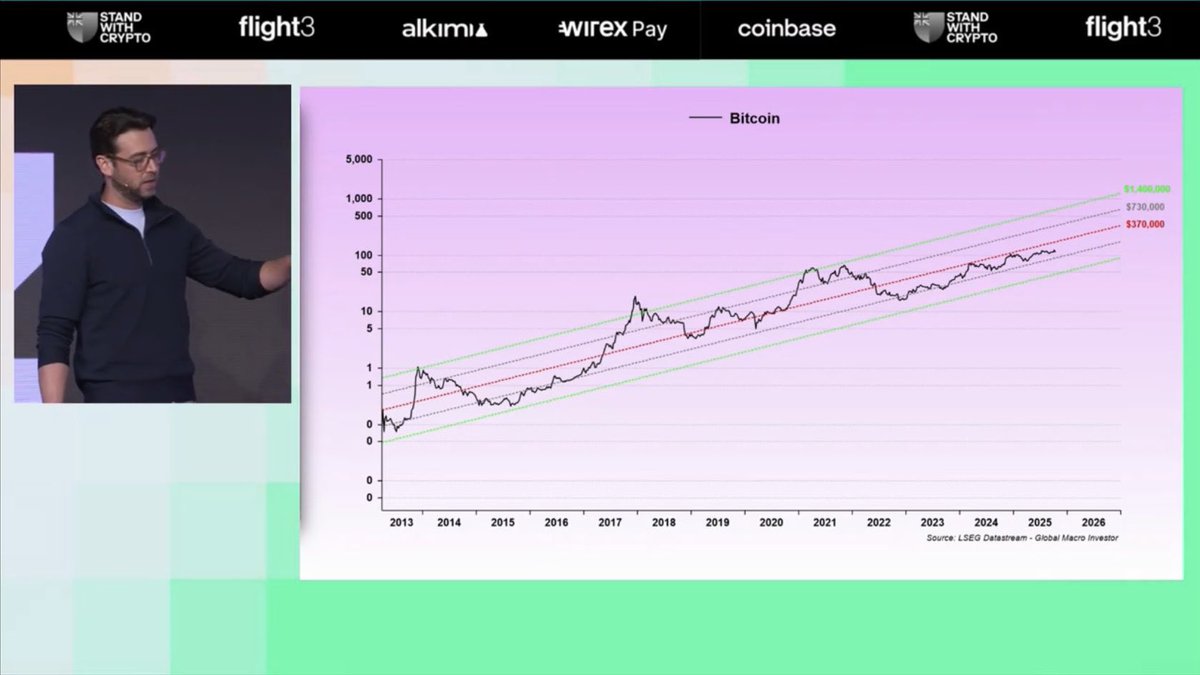
The Everything Code TL;DR.
The labor force participation rate isn’t going to rise anytime soon – it’s set to keep declining over time. This is a structural problem…
We’ve got aging demographics, falling birth rates, and now the rise of automation.
Humans are already being replaced by AI and robots at a staggering pace, and that shift is only just beginning. This is deflationary.
It also reinforces the need for ongoing stimulus to keep the system afloat.
Fewer workers. More tech. Same debts…

3
142