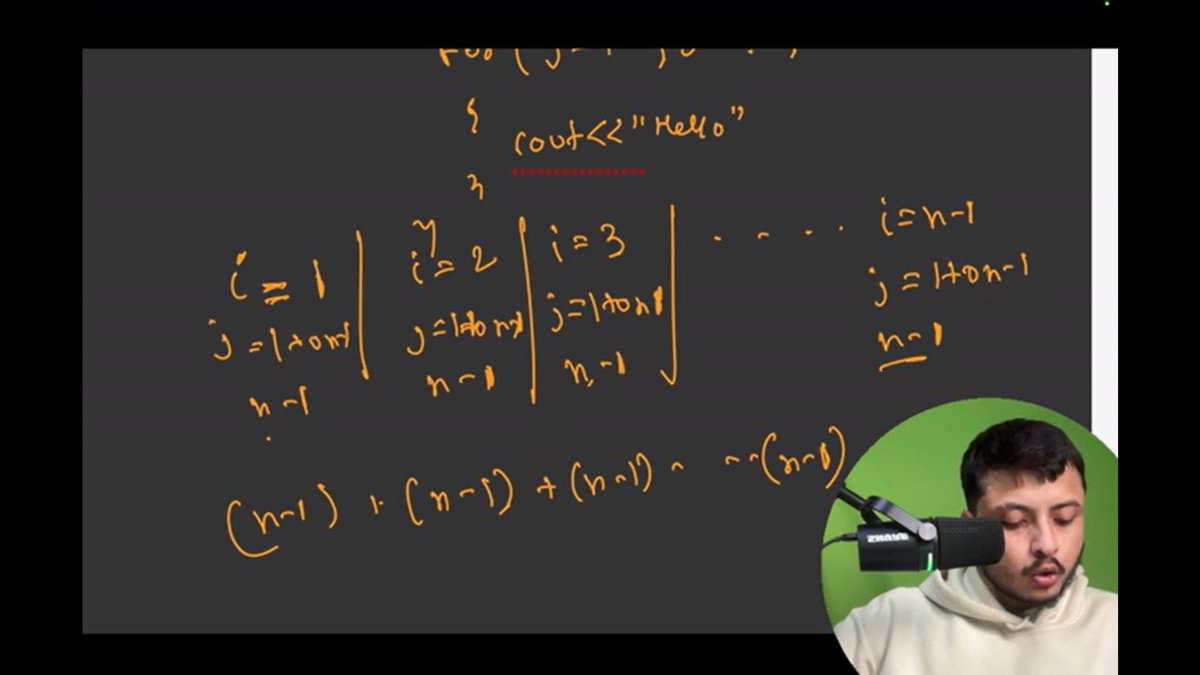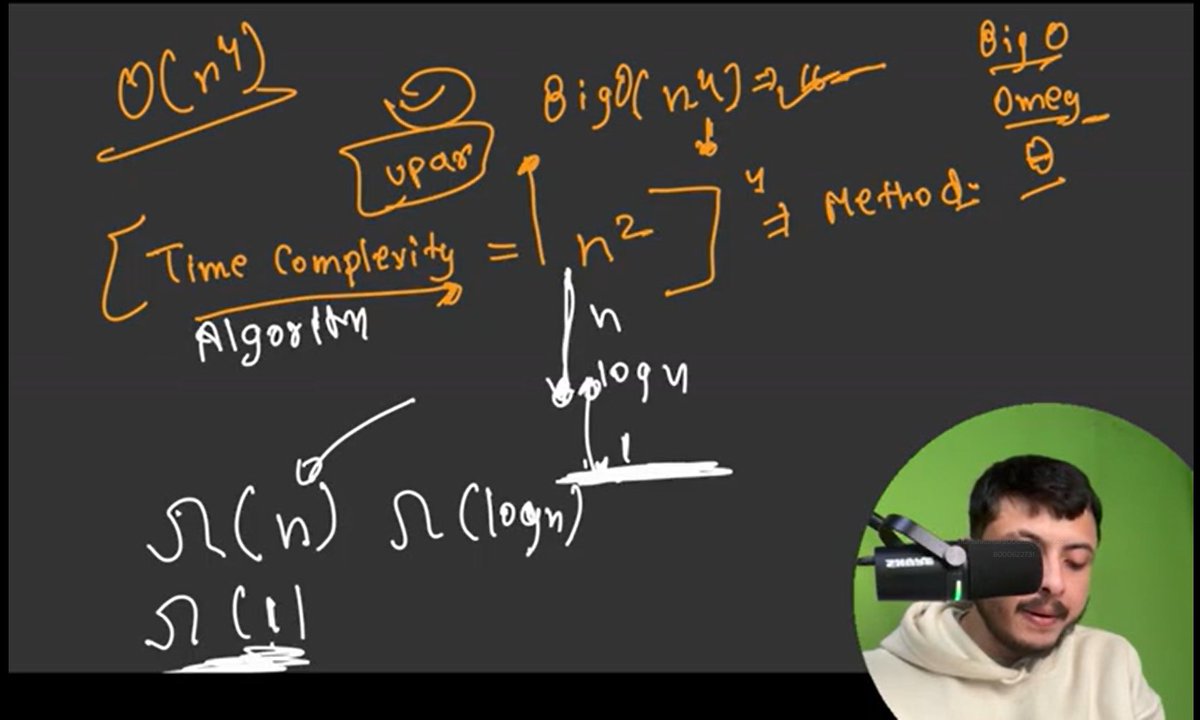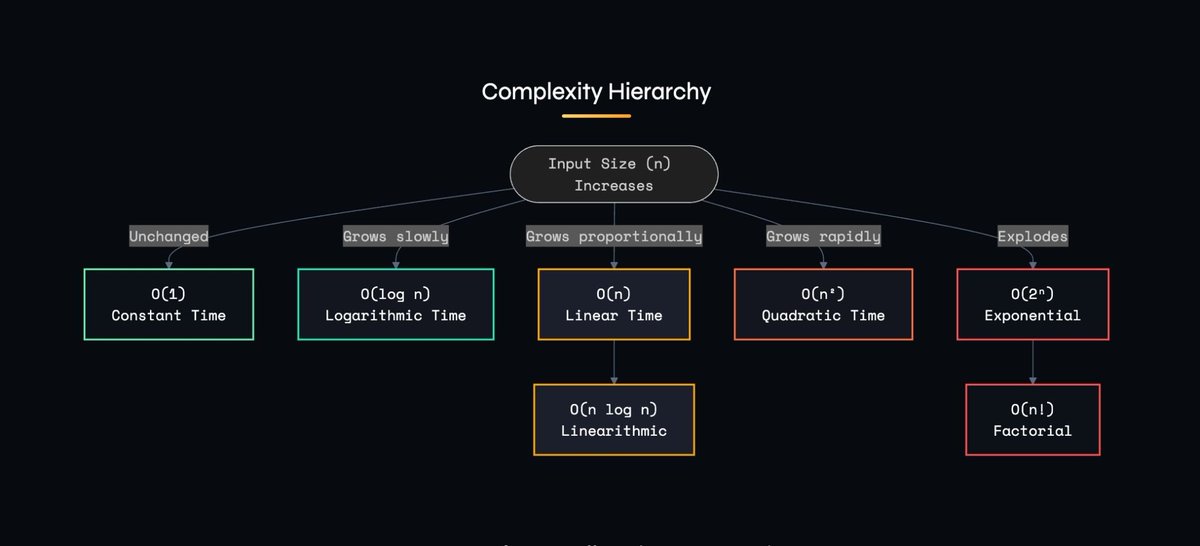

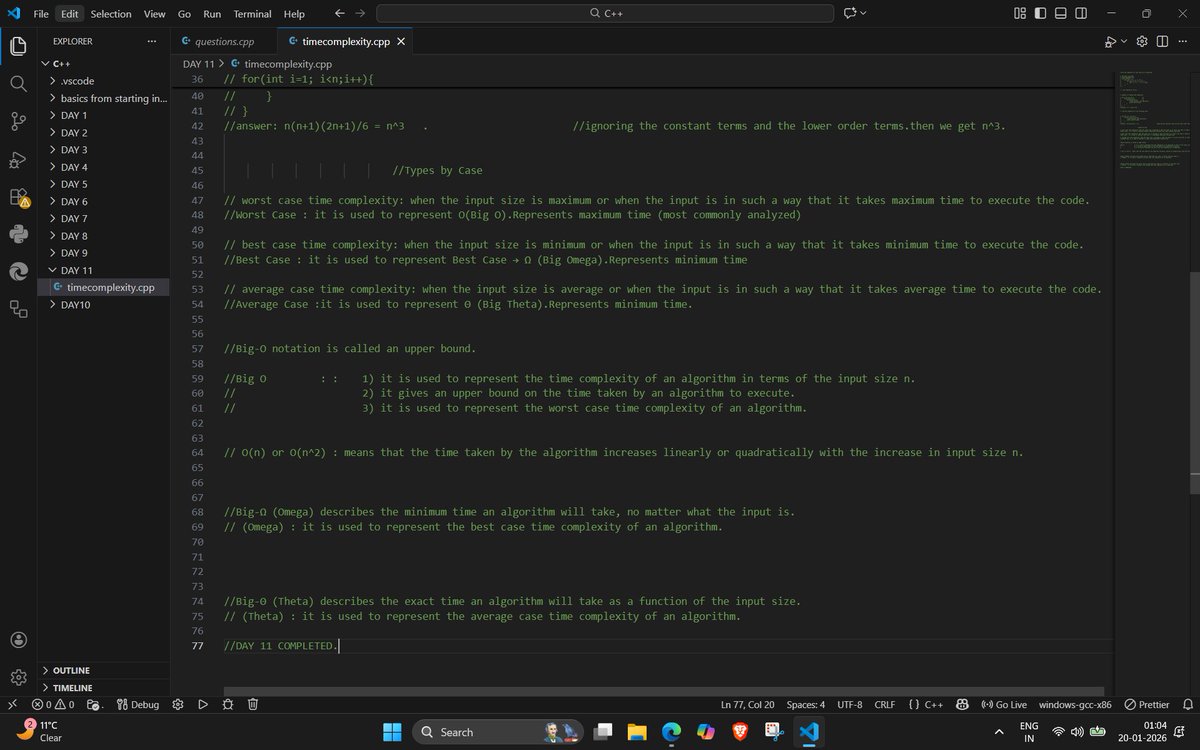
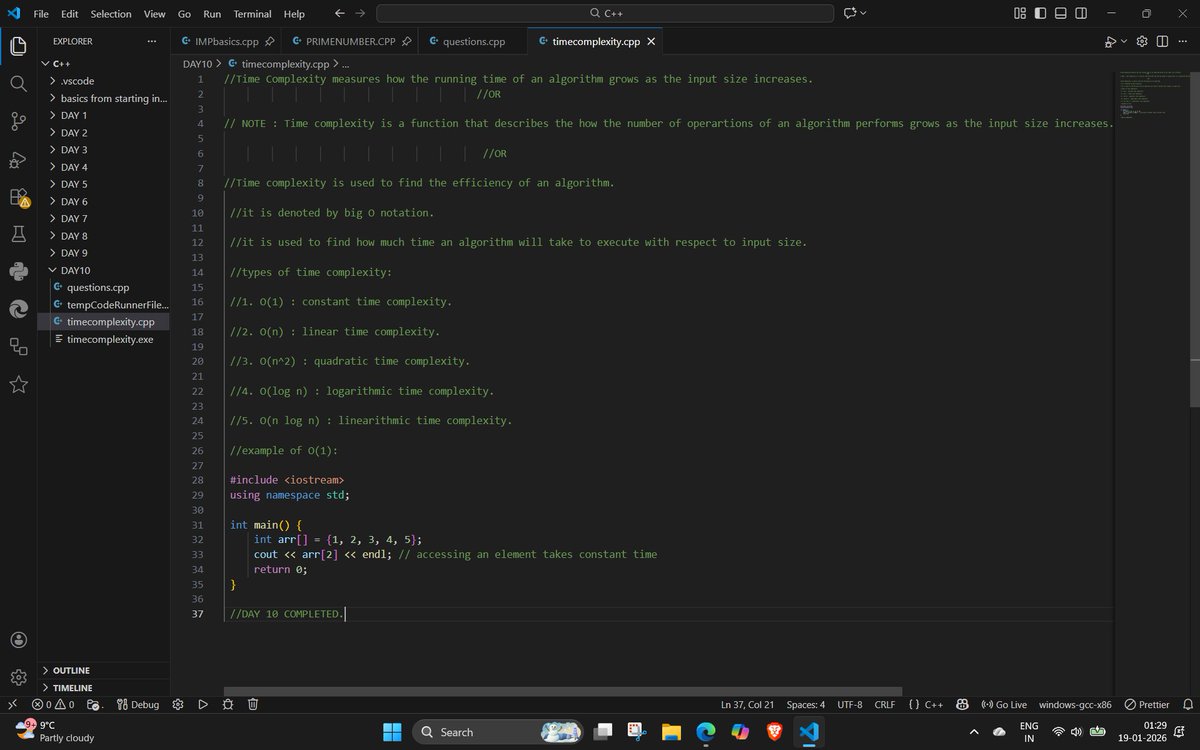

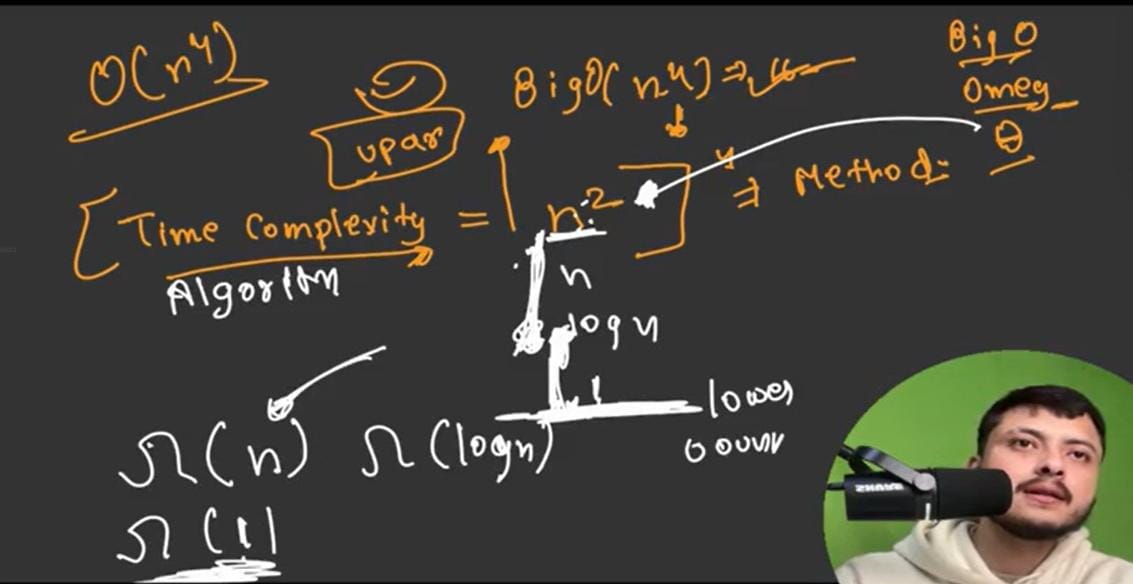
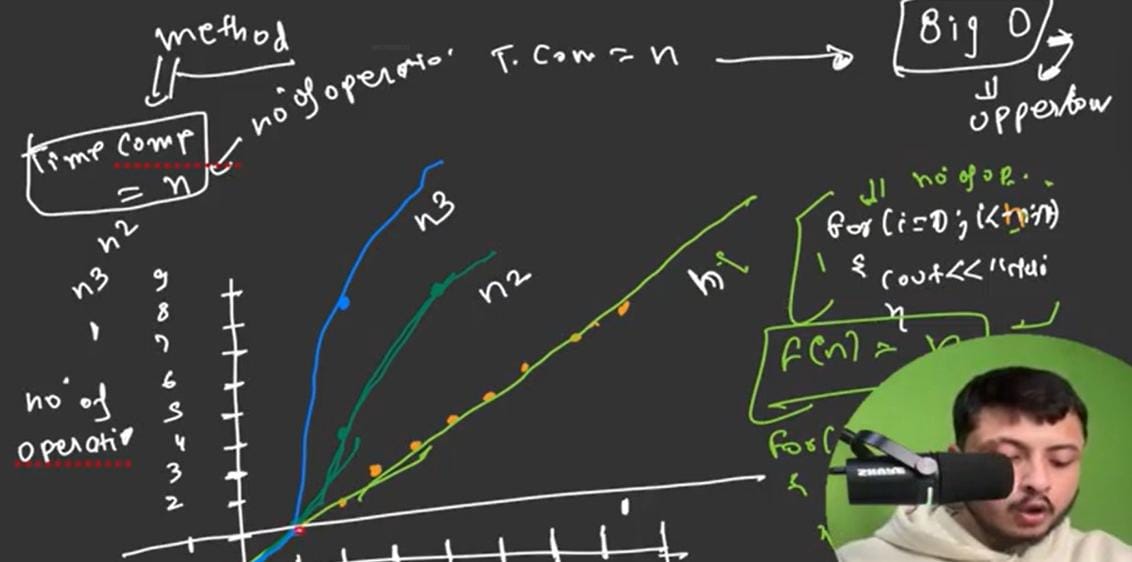
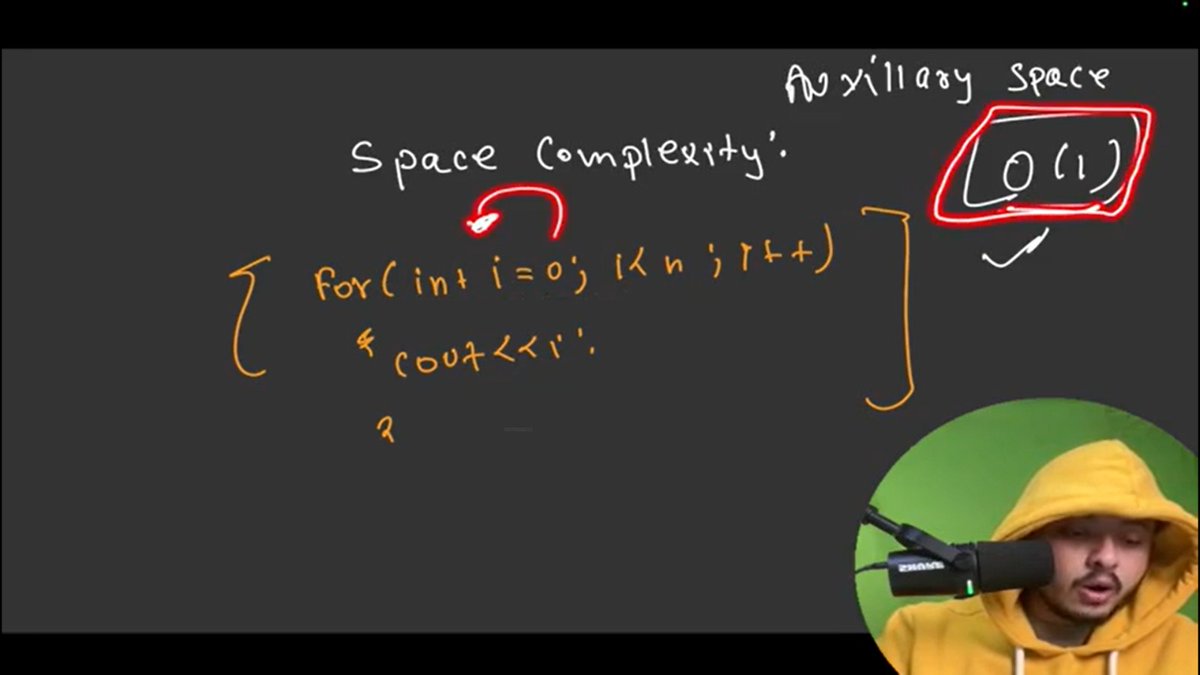

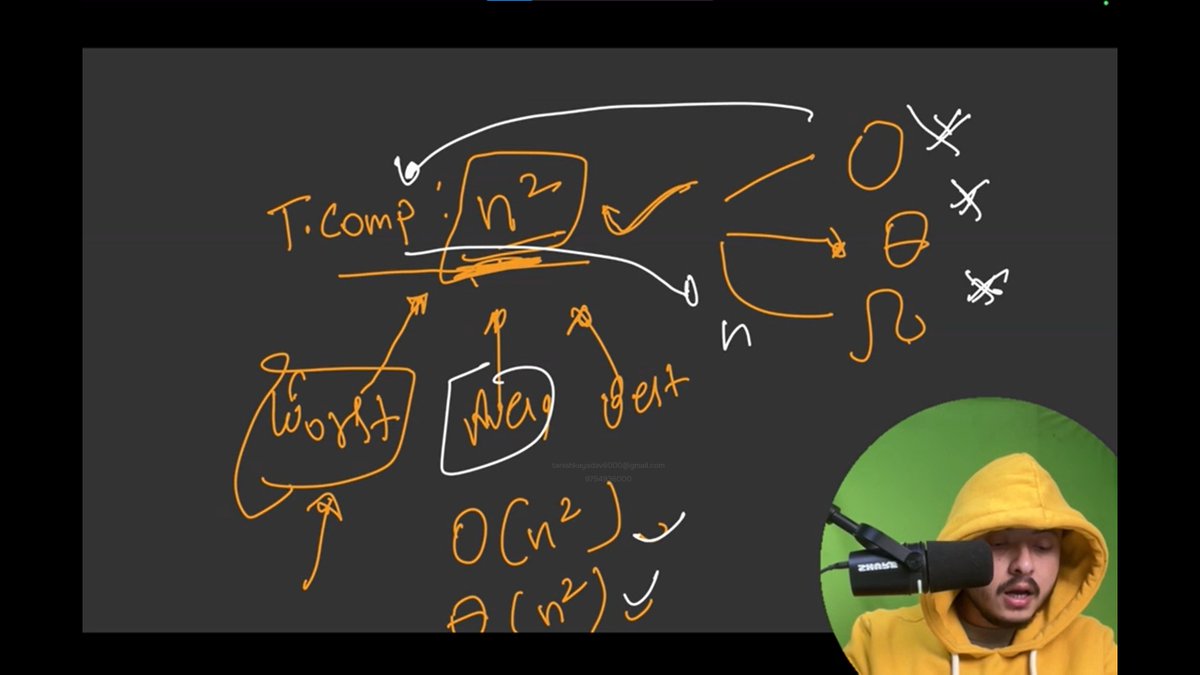


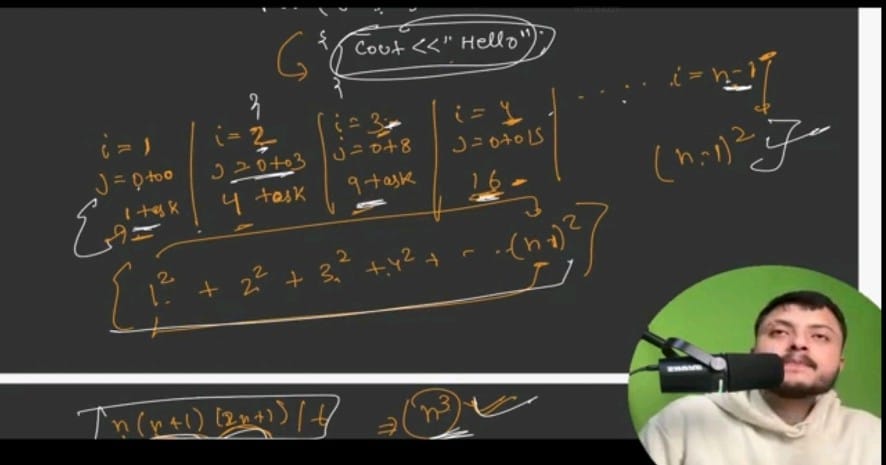


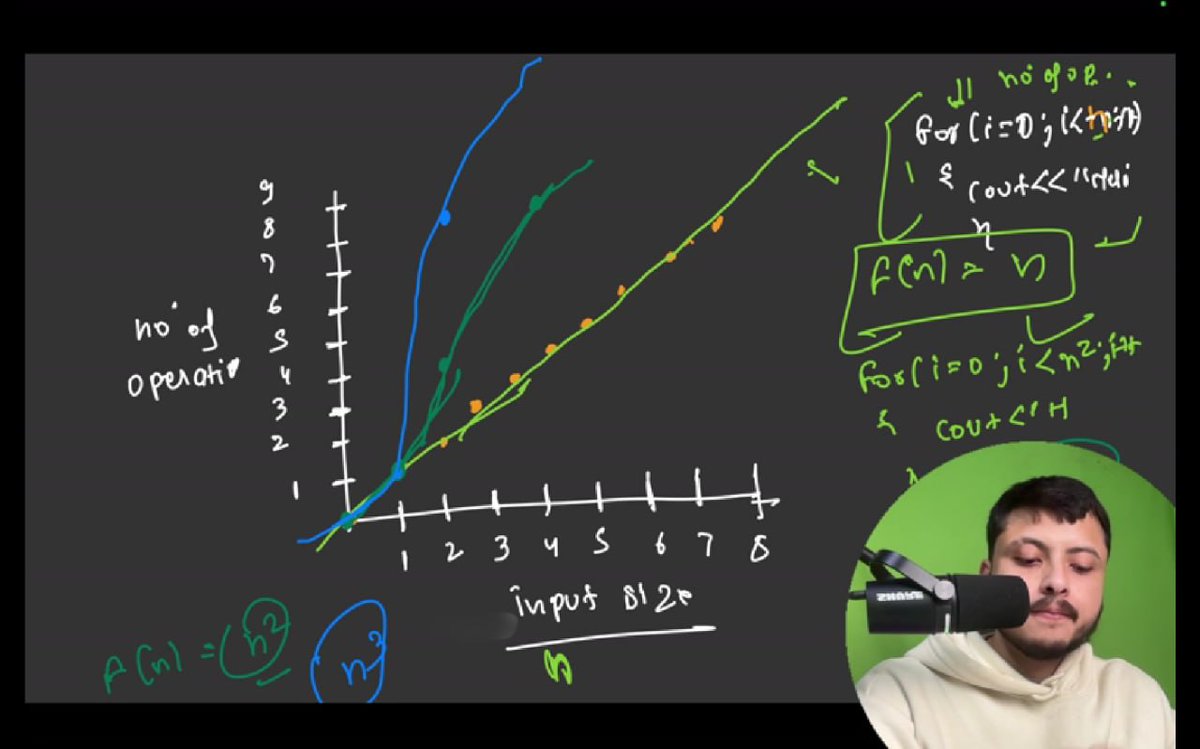

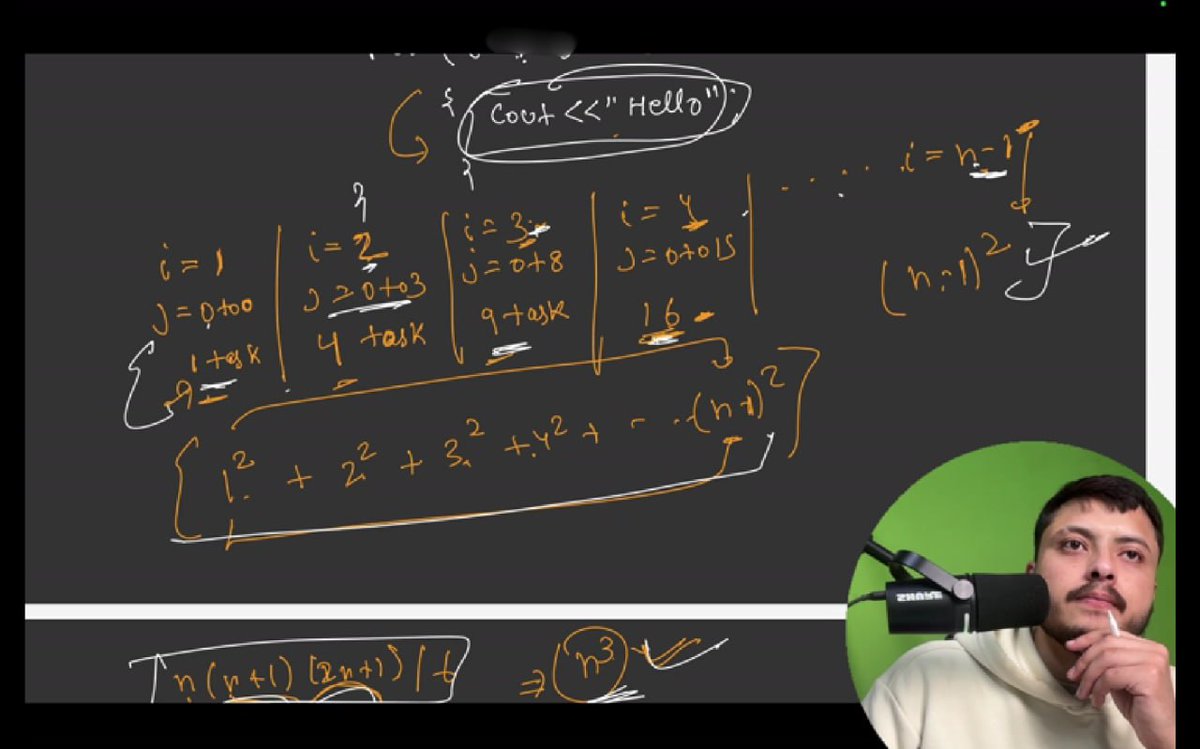

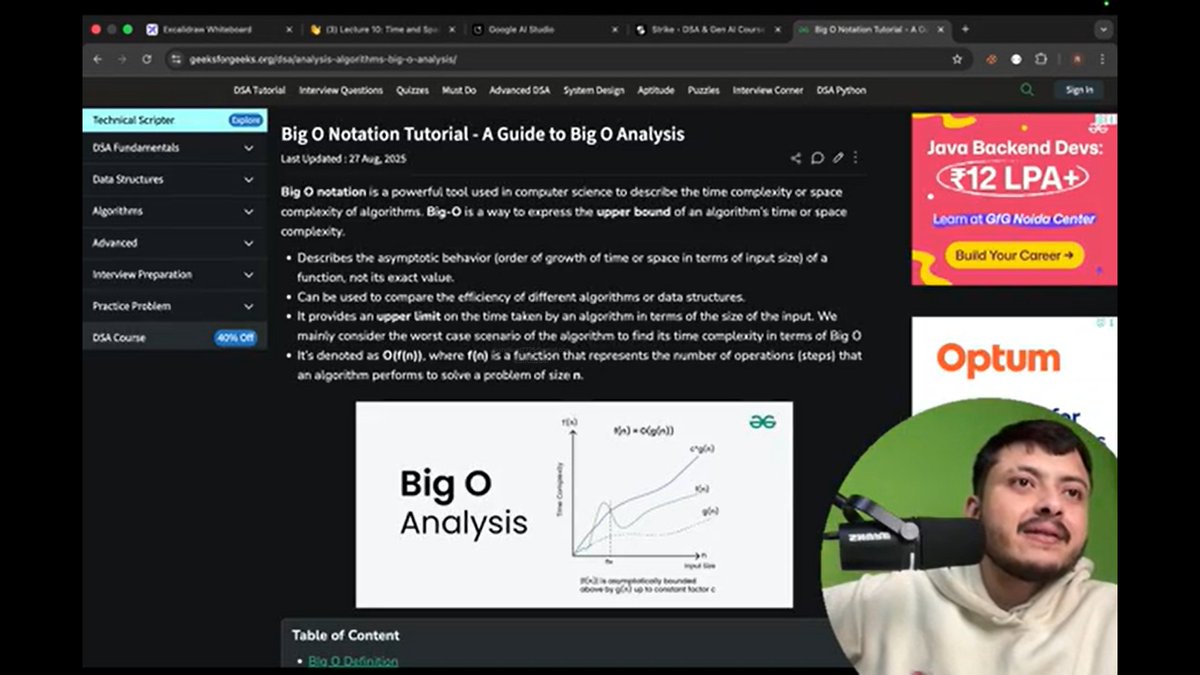
ALT **Day 18 of #StrikeDSA & #GenAI with Rohit Bhaiya 🚀** Today I fixed one of the **most misunderstood topics in Computer Science**: **Big-O, Omega (Ω) and Theta (Θ)**. ### ✅ Correct definitions (no shortcuts): 🔹 **Big-O (O)** → Represents an **upper bound** → Actual function can be **equal to or below** it 🔹 **Omega (Ω)** → Represents a **lower bound** → Actual function can be **equal to or above** it 🔹 **Theta (Θ)** → Represents the **exact bound** → Tight growth on both sides ### 📌 Example: If **Θ(n²)** is the exact complexity, then: * **Big-O** can be: `n²`, `n³`, `n⁴`, … * **Omega** can be: `n²`, `n`, `1`, … ❌ Myth broken: Big-O ≠ worst case Omega ≠ best case Theta ≠ average case ✅ They are **mathematical bounds**, not performance labels. Understanding this changes how you analyze algorithms forever. #DSA #TimeComplexity #BigO #Theta #Omega #ComputerScience #StrikeDSA