
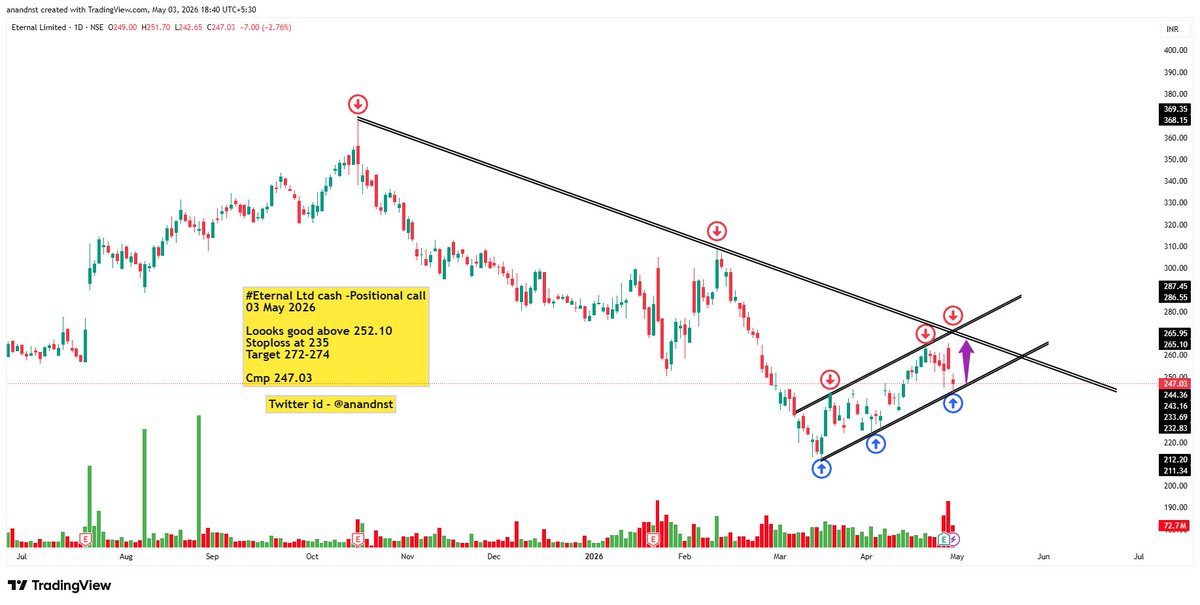
Stock Overview: Eternal Limited
The chart reflects the daily price movement of Eternal Limited, showing a prolonged bearish trend followed by a recent recovery phase. The stock has been forming lower highs for months, but recent price action indicates a possible shift toward bullish momentum as it attempts to break key resistance levels.
Fundamental Analysis
Eternal Limited operates in a competitive business environment where performance depends heavily on sector demand, operational efficiency, and financial discipline. Investors typically evaluate such companies based on revenue growth, profitability margins, debt levels, and future expansion strategies.
If the company demonstrates consistent earnings growth and controlled debt, it becomes attractive for long-term investment. However, if earnings are volatile or margins are under pressure, the stock may remain range-bound. Market sentiment also plays a key role, especially if the company is in a cyclical industry. Any positive developments such as expansion plans, improved earnings, or sector tailwinds can act as catalysts for price appreciation.
From a broader perspective, investors should monitor quarterly results, management commentary, and industry trends before taking long-term positions.
Technical Analysis
The chart clearly shows a strong downtrend marked by a descending trendline connecting multiple lower highs. This indicates sustained selling pressure over time. However, in recent weeks, the stock has started forming higher lows, suggesting accumulation and early signs of trend reversal.
A rising trendline from recent lows indicates improving demand at lower levels. This creates a pattern where price is moving within a narrowing range between a descending resistance line and an ascending support line. This type of structure often leads to a breakout move.
The key resistance zone lies around 252, which is also highlighted as a breakout level. A strong move above this level can confirm bullish momentum and invalidate the previous downtrend structure. Volume activity appears to increase during upward moves, which supports the possibility of accumulation by larger participants.
Momentum indicators, though not explicitly labeled here, appear to support recovery as price is making higher lows. However, the stock still faces resistance from the long-term trendline, making this a crucial decision point.
Key Levels to Watch
The immediate resistance is around 252, and a sustained move above this level could open the path toward 272–274 levels. On the downside, strong support is seen near 235, which also serves as a logical stop-loss level. Below this, the trend could weaken again.
The confluence of resistance from the descending trendline and support from the rising trendline makes the current price zone very important. A breakout or breakdown from this zone will likely define the next major move.
Trading Strategy Insight
A positional strategy can be considered above 252, where confirmation of breakout is visible. Maintaining a stop-loss near 235 helps manage risk effectively. If the breakout sustains, the stock may move toward the 272–274 target zone, offering a favorable risk-to-reward setup.
Traders should avoid early entry before confirmation, as false breakouts are possible in such consolidation patterns. Waiting for strong price action with volume support is a more disciplined approach.
Conclusion
Eternal Limited is currently at a critical technical juncture where a potential trend reversal is developing after a prolonged downtrend. While the fundamentals need continuous monitoring, the technical structure suggests that a breakout above key resistance could trigger a bullish move. Traders and investors should focus on confirmation levels and maintain proper risk management before entering positions.
Hashtags
#EternalLimited #StockMarketIndia #TechnicalAnalysis #FundamentalAnalysis #StockTrading #SwingTrading #BreakoutStocks #IndianStocks #NSEStocks #StockMarketLearning #InvestingIndia #StockAnalysis #MarketTrends #TradingStrategy #EquityMarket #StockMarketTips #VolumeAnalysis #PriceAction #ChartReading #StockMarketEducation #InvestSmart #WealthCreation #LongTermInvesting #ShortTermTrading #StockBreakout #TrendReversal #SupportResistance #MarketAnalysis #StockIdeas #TradingViewAnalysis #IndianEquity #StockInvesting #FinancialMarkets #StockResearch #InvestmentIdeas #BullishStocks #BearishToBullish #MarketMomentum #StockInsights #DailyChart #StockForecast #TradeSmart #StockOpportunities #CapitalMarkets #EquityResearch #InvestorMindset #SmartInvesting #StockWatcher #MomentumTrading #BreakoutTrading
5
394

21 Sep 2025
🚨 TECHNOFUNDA ANALYSIS 🚨
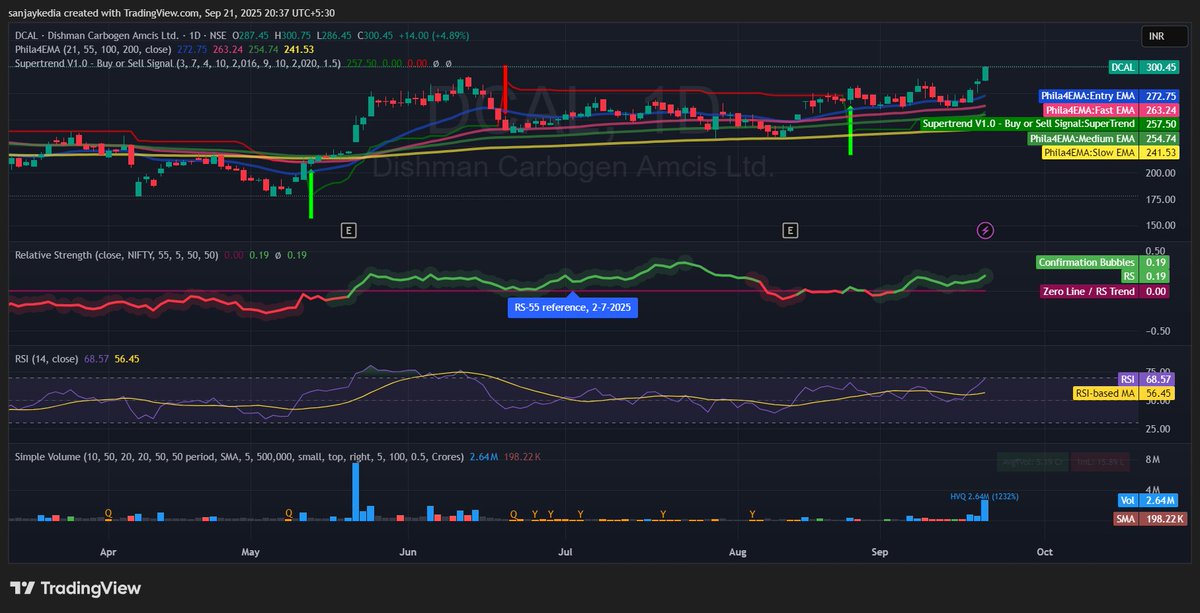
📈 Stock: Dishman Carbogen Amcis Ltd. (NSE: #DCAL)
💡 Sector: Pharma & CRAMS (Contract Research & Manufacturing Services)
🔹 Technical View:
Strong breakout above ₹300 with bullish momentum.
Trading above all key EMAs (Fast EMA ₹263, Medium EMA ₹254, Entry EMA ₹272, Slow EMA ₹241) → confirms trend reversal 📊.
Supertrend Buy Signal active ✅ (Support ~₹257).
RSI: 68.5 → bullish, but not yet overbought → room for further upside.
Relative Strength vs NIFTY: 0.19 → stock is outperforming benchmark.
Volume surge (1232% higher 🔥) confirms strong buying interest.
🔹 Fundamental View:
A leading player in CRAMS & specialty pharma, serving global innovator companies.
Strong export exposure, especially to regulated markets (Europe, US).
Potential re-rating candidate with rising demand in contract manufacturing & R&D outsourcing.
📊 Conclusion:
Short-Term Trend: Bullish, may test ₹315–₹330.
Medium-Term View: Positive, supported by strong pharma sector demand technical breakout.
Key support zone: ₹270–₹280.
⚠️ Disclaimer: This is a TechnoFunda analysis shared for educational purposes only. Not a buy/sell recommendation. Please do your own research (DYOR) or consult your financial advisor before investing.
🔥 #TechnoFunda #DCAL #BreakoutStocks #PharmaStocks #CRAMS #NSEStocks #TradingViewAnalysis #MomentumStocks
4
494

30 Apr 2025
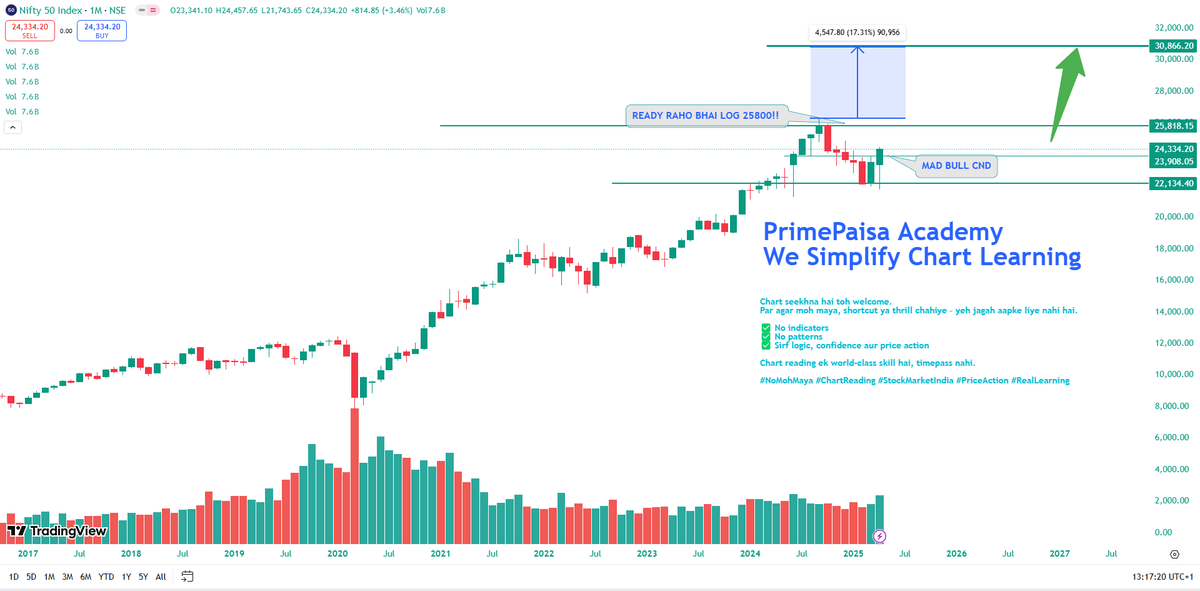
📊 #Nifty 50 Monthly Chart Analysis (as of April 2025)
🔹 Current Price: ₹24,334
🔹 Volume: ~7.6B (significant uptick in recent month)
🔹 Timeframe: Monthly candles
🔍 Technical Overview
✅ Support & Resistance
Strong Resistance: ₹25,818 (previous all-time high zone)
Strong Support: ₹22,134 (prior breakout & retest zone)
The current candle shows bullish strength with a large green body bouncing from the ₹22,134 support level.
📈 Trend
Long-term trend remains bullish since the COVID-19 bottom (March 2020).
The index corrected from ₹25,818 to ~₹22,134, and the current candle indicates a recovery attempt.
A breakout above ₹25,818 would likely trigger another bullish leg, potentially targeting ₹28,000–30,000
📊 Volume Analysis
The current month shows high volume with a bullish candle, indicating strong institutional participation and renewed buying interest.
⚠️ Risk Factor
If the index fails to break ₹25,818 again, it may revisit the ₹24200 -100 zone.
Sustained failure at resistance with increasing volume could indicate distribution.
🧭 Key Levels to Watch
Level TypePriceMajor Support₹22,134Immediate Resistance₹25,818Breakout Target₹28,000–30,000 Breakdown Risk Below ₹22,000
📌 Conclusion
Bullish Bias above ₹22,134.
Breakout above ₹25,818 = strong buy signal.
Rejection near ₹25,818 = watch for consolidation or dip buying near support.
#Nifty50
#NiftyAnalysis
#StockMarketIndia
#TechnicalAnalysis
#NiftyMonthlyChart
#PriceActionTrading
#NiftyLevels
#IndianStockMarket
#BankNifty
#StockMarketUpdate
#SwingTrading
#StockMarketEducation
#TradingViewAnalysis
#StockMarketTips
#StockMarketNews
2
10
1,214

10 Mar 2025
Bitcoin Bearish Case Emerges – Is A Dump To $73,000 Coming?
news.nbtc.finance/bitcoin-be…
#TradingViewAnalysis #BitcoinBreakdown #CryptoMarket #BitcoinSupportTest #BitcoinAtCrossroads #Crypto #Bitcoin #NBTC

1
56

11 Jan 2025
#Reliance Industries
#RelianceTechnicalAnalysis : Monthly Chart
#stockmarketnews #nifty50 #niftytoday #StockSwingCycle
1. Chart Overview:
The monthly Reliance Industries (NSE) chart highlights key technical levels and trends over an extended period. The analysis focuses on the breakdown of significant support levels, historical price movements, and market reactions to external events.
2. Key Observations:
a. Major Support Levels:
Support Level during COVID Crash (2020):
The major support at ₹673 was broken during the global COVID-19 pandemic.
This sharp decline reflected market-wide panic, followed by a swift recovery as market conditions stabilized.
Support Breakdown in December 2024:
Another significant support level around ₹1329 was broken in December 2024.
This resembles market conditions during the COVID crisis, potentially indicating broader market concerns or economic headwinds.
b. Trendline Analysis:
The chart shows a long-term upward channel trendline guiding price movements from 2017 to 2023.
The recent breach of the support trendline signals a possible change in market sentiment and a shift from bullish to bearish momentum.
c. Price Action Characteristics:
Post-COVID recovery saw the stock price steadily climb, following the upward channel.
However, the current breakdown suggests heightened selling pressure and potential reversal signals.
3. Technical Indicators Analysis:
a. Moving Averages (MA):
The 50-month moving average (MA) acts as dynamic support but appears to have been tested or breached, signaling weakening momentum.
b. Relative Strength Index (RSI):
Likely trending towards oversold territory given the sustained downward movement, suggesting a possible technical rebound or temporary stabilization.
c. Volume Analysis:
Elevated selling volumes typically accompany such breakdowns, reinforcing bearish sentiment.
Monitoring volume for signs of capitulation or trend reversal is crucial.
4. Potential Scenarios:
a. Bullish Reversal Scenario:
A recovery above ₹1329 and sustained buying momentum could invalidate the bearish breakdown.
Key resistance levels to watch: ₹1400, ₹1550.
b. Bearish Continuation Scenario:
If prices fail to reclaim the broken support, the next potential downside targets include ₹1050 and ₹700.
c. Consolidation Scenario:
The stock may enter a consolidation phase between ₹1200 and ₹1350 as the market digests recent developments.
5. External Factors to Monitor:
Macroeconomic Conditions:
Economic policies, interest rate changes, and global market sentiment can impact price movements.
Sectoral Developments:
Changes in energy markets and regulations may directly influence Reliance’s stock performance.
Company-Specific Announcements:
Key announcements regarding business expansions, partnerships, or earnings could sway market sentiment.
6. Conclusion:
The breach of key support levels at ₹1329 mirrors historical patterns observed during the COVID crisis, signaling potential challenges. Traders and investors should closely monitor the price action near support and resistance levels, volume trends, and market indicators to gauge future movements. While bearish momentum is dominant, caution is advised until clear reversal signals emerge.
7. Recommendations:
For Traders:
Utilize stop-loss strategies to manage risk amid heightened volatility.
For Long-Term Investors:
Evaluate fundamentals alongside technicals and consider accumulating on further dips if broader market conditions improve.
For Analysts:
Monitor macroeconomic factors and sentiment shifts to better understand market behavior.
Disclaimer: This report is for educational purposes only and should not be construed as financial advice.
#StockMarketInsights #RelianceIndustriesNSE #SupportResistanceLevels #MarketBreakdown #TradingViewAnalysis #PriceActionStrategy #InvestmentOutlook #BearishTrend #MarketVolatility #TechnicalBreakout #RelianceStock

4
455